
A novel translational control mechanism involving RNA structures within coding sequences
- Jennifer Jungfleisch1,
- Danny D. Nedialkova2,3,10,
- Ivan Dotu4,10,
- Katherine E. Sloan5,
- Neus Martinez-Bosch6,
- Lukas Brüning5,
- Emanuele Raineri7,
- Pilar Navarro6,
- Markus T. Bohnsack5,8,
- Sebastian A. Leidel2,3,9 and
- Juana Díez1
- 1Molecular Virology Group, Department of Experimental and Health Sciences, Universitat Pompeu Fabra, 08003 Barcelona, Spain;
- 2Max Planck Research Group for RNA Biology, Max Planck Institute for Molecular Biomedicine, 48149 Münster, Germany;
- 3Cells-in-Motion Cluster of Excellence, University of Münster, 48149 Münster, Germany;
- 4Research Programme on Biomedical Informatics (GRIB), Department of Experimental and Health Sciences, Universitat Pompeu Fabra, Hospital del Mar Medical Research Institute (IMIM), 08003 Barcelona, Spain;
- 5Institute for Molecular Biology, Göttingen University Medical Department, 37073 Göttingen, Germany;
- 6Program of Cancer Research, Hospital del Mar Medical Research Institute (IMIM), 08003 Barcelona, Spain;
- 7Statistical Genomics, Centro Nacional de Analisis Genomica, 08028 Barcelona, Spain;
- 8Göttingen Center for Molecular Biosciences, Georg-August University, 37073 Göttingen, Germany;
- 9Faculty of Medicine, University of Münster, 48149 Münster, Germany
- Corresponding author: juana.diez{at}upf.edu
-
↵10 These authors contributed equally to this work.
Abstract
The impact of RNA structures in coding sequences (CDS) within mRNAs is poorly understood. Here, we identify a novel and highly conserved mechanism of translational control involving RNA structures within coding sequences and the DEAD-box helicase Dhh1. Using yeast genetics and genome-wide ribosome profiling analyses, we show that this mechanism, initially derived from studies of the Brome Mosaic virus RNA genome, extends to yeast and human mRNAs highly enriched in membrane and secreted proteins. All Dhh1-dependent mRNAs, viral and cellular, share key common features. First, they contain long and highly structured CDSs, including a region located around nucleotide 70 after the translation initiation site; second, they are directly bound by Dhh1 with a specific binding distribution; and third, complementary experimental approaches suggest that they are activated by Dhh1 at the translation initiation step. Our results show that ribosome translocation is not the only unwinding force of CDS and uncover a novel layer of translational control that involves RNA helicases and RNA folding within CDS providing novel opportunities for regulation of membrane and secretome proteins.
Structural features in messenger RNA (mRNA) regulate its localization, translation, and degradation. The dynamic folding of mRNA into secondary and tertiary structures guides the interaction with proteins and RNAs that ultimately directs mRNA fates. Yet, the elucidation of such structures and their functional implications remain elusive. Recent advances in next-generation sequencing (NGS) in combination with nuclease treatments or chemical probing allowed, for the first time, experimental genome-wide measurements of RNA secondary structures. These seminal studies have uncovered novel evolutionary conserved structural patterns and their nexus to translational control (Mortimer et al. 2014). A surprising discovery was that the CDSs of Saccharomyces cerevisiae mRNAs present a higher degree of secondary structures than untranslated regions (UTRs) in vitro (Kertesz et al. 2010). Subsequent studies demonstrated that CDSs are significantly less structured or, alternatively, more structurally dynamic in vivo than in vitro (Rouskin et al. 2014). This remodeling is energy-dependent, as depletion of ATP results in recovery of the structure, mimicking the in vitro results. How this in vivo remodeling is achieved and what functional implications it represents are poorly understood. Ribosome translocation during translation elongation has been traditionally considered to drive CDS unwinding since strand separation activity is inherent to the ribosome, requiring no exogenous helicases (Takyar et al. 2005). However, this activity might not be the only unwinding force in vivo, as high ribosome occupancy within coding regions is not associated with lower structure propensities (Rouskin et al. 2014).
Strong candidates for factors directing mRNA unfolding in vivo are ATP-dependent helicases. From these, the large DEAD-box family of RNA helicases is involved in all cellular processes that require RNA remodeling, such as transcription, pre-mRNA splicing, ribosome biogenesis, and RNA decay (Martin et al. 2013; Jarmoskaite and Russell 2014). In addition to ATP-dependent RNA unwinding activities, DEAD-box RNA helicases promote RNA duplex formation, serve as assembly platforms for the formation of large RNP complexes, and displace proteins from RNA (Linder and Jankowsky 2011). Dhh1 is a highly evolutionarily conserved member of the family of DEAD-box RNA helicases. The conservation is such that, in yeast, Dhh1 can be functionally replaced by its counterparts from Drosophila melanogaster (Me31B), Xenopus laevis (Xp54), or humans (DDX6) (Maekawa et al. 1994; Tseng-Rogenski et al. 2003; Westmoreland et al. 2003; Alves-Rodrigues et al. 2007). Dhh1 functions as a translational repressor and as a decapping activator in the major deadenylation-dependent 5′-3′ mRNA decay pathway (Presnyak and Coller 2013). Former in vitro studies suggested that Dhh1 represses mRNA translation by acting on translation initiation and translation elongation (Coller and Parker 2005; Franks and Lykke-Andersen 2008; Sweet et al. 2012). In humans, DDX6 functions as well in promoting miRNA-mediated repression via association with AGO1, AGO2, and the CCR4-NOT complex (Chu and Rana 2006; Chen et al. 2014; Mathys et al. 2014).
In contrast to the well-established Dhh1 repressing functions, we and others have found that Dhh1 activates translation of viral RNA genomes. By using a model system that allows the replication of the plant Brome mosaic virus (BMV) in yeast, we have previously shown that Dhh1 depletion dramatically inhibits BMV RNA translation (Alves-Rodrigues et al. 2007). Moreover, this role is extended to its human homolog DDX6 since first, in the yeast model system it replaces Dhh1 to promote BMV RNA translation, and second, it promotes translation of the human Hepatitis C virus (HCV) RNA genome in hepatoma cell lines (Alves-Rodrigues et al. 2007; Scheller et al. 2009; Huys et al. 2013). The mechanism for translational activation by Dhh1 is unclear, but it should not involve the cap structure because, unlike BMV RNA, HCV RNA is translated via an IRES-dependent mechanism. BMV and HCV belong to the large group of positive-strand RNA viruses whose RNA genomes are highly structured. Throughout infection, positive-strand RNA genomes display three mutually exclusive functions. They first function as mRNAs for expression of the viral proteins, later as templates for RNA replication, and subsequently as genomes for encapsidation of new particles. Profound remodeling steps of the viral ribonucleoprotein complex are temporarily required to coordinate these essential transitions that are poorly understood. Given the dynamic folding properties of viral RNA genomes and the fact that viruses hijack processes already existing in the host, we hypothesized that the positive role of Dhh1 in viral RNA translation is linked to specific RNA folding regulations that may be extended to a specific set of cellular mRNAs. By combining viral studies in the BMV/yeast system with high-throughput RNA-seq, ribosome profiling and CRAC (UV crosslinking and analysis of cDNA) of host mRNAs, here, we uncover an additional layer of translational control involving an RNA helicase and RNA folding within CDSs that is seemingly conserved from yeast to humans and hijacked by viruses.
Results
Dhh1 ATPase activity promotes translation of BMV RNA2
Dhh1 has been well described as a translational repressor and a decapping activator; however, by using the ability of BMV RNA to translate and replicate in the yeast Saccharomyces cerevisiae, we have previously shown that Dhh1 promotes translation of the BMV RNA2 (Mas et al. 2006). BMV RNA2 is 5′-capped and contains a tRNA-like structure instead of a poly(A)-tail at the 3′ end (Noueiry and Ahlquist 2003). To elucidate which Dhh1 features are required for this unexpected function, we introduced several characterized point mutations in multiple conserved motifs (Cheng et al. 2005; Dutta et al. 2011) and studied their in vivo effect on both yeast viability and BMV RNA2 translation (Fig. 1). The mutants were named based on the mutated motif (described in Fig. 1A; Supplemental Fig. S1A). A single-copy plasmid expressing each mutant from the endogenous DHH1 promoter was transformed into the dhh1Δ yeast strain. Expression levels of all Dhh1 mutant proteins were similar to that of wild-type Dhh1 (Supplemental Fig. S1B). First, we examined the effect of Dhh1 mutations on cell viability by studying cell growth at 30°C and 36°C (Fig. 1B). Confirming previous results for other yeast genetic backgrounds (Cheng et al. 2005; Dutta et al. 2011), all mutants failed to complement the dhh1Δ thermo-sensitive phenotype, except mutant 1A, 3, and 6B, which are described not to affect Dhh1 remodeling activity (Cheng et al. 2005; Dutta et al. 2011). Importantly, a similar pattern was observed when we tested the effect of the Dhh1 mutants on BMV RNA2 translation (Fig. 1C). As steady-state BMV RNA2 levels were not affected, we conclude that the observed differences in 2a expression are due to translation defects. Together, these results indicate that similar Dhh1 features, including the ATPase activity, are required for both cell viability and BMV RNA2 translation.
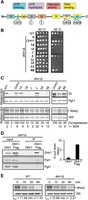
Effect of multiple Dhh1 mutations on cell growth and on viral RNA translation. (A) Motifs and functional domains of the DEAD-box RNA helicase Dhh1. Numbers 1A to 6B indicate the location of the point mutations. (B) Growth at 30°C and 36°C of WT and dhh1Δ expressing various Dhh1 mutant alleles. (C) Effect of Dhh1 mutants on BMV RNA2 translation. The dhh1Δ strain was transformed with a plasmid expressing RNA2 together with an empty plasmid or a plasmid expressing DHH1 or the different dhh1 mutant alleles. RNA2 and protein 2a were analyzed by Northern and Western blot, respectively. As a control for equal loading and sample quality, 18S rRNA and phosphoglycerate kinase protein 1 (Pgk1) were also analyzed. The average 2a expression value from at least three independent experiments is shown. The average value obtained for cells expressing DHH1 was set to 100. The SEM values are indicated below. (D) Dhh1 binds BMV RNA2. Western blot analysis of immunoprecipitation assays carried out in dhh1Δ cells expressing RNA2 and Dhh1 or Dhh1-Flag. Input corresponds to 100 µg of total protein present in lysates prior to precipitation and IP corresponds to the corresponding eluates from the anti-Flag matrix following precipitation. Diagram shows the relative amount (±SEM) of precipitated RNA2 detected by qPCR after immunoprecipitation; the input amount of RNA2 was set to 100. (E) The half-life of RNA2 is not significantly altered in dhh1Δ cells. RNA2 was expressed from a GAL1 promoter in WT and dhh1Δ cells. Transcription was stopped by adding glucose at time point t = 0 min. Samples were taken at different time points and RNA2 accumulation analyzed by Northern blot. Numbers below indicate the average half-life of RNA2 (±SEM) based on three independent experiments. T-test analysis shows that the half-life is not significantly altered in dhh1Δ cells.
A plausible explanation for these effects is that Dhh1 promotes translation of BMV RNA2 by remodeling its structure. If so, Dhh1 and RNA2 must interact. To test this possibility, we carried out RNA-co-immunoprecipitation experiments (RIP) using a Flag-tagged Dhh1 (Fig. 1D). Addition of the Flag-tag did not affect Dhh1 function in BMV RNA2 translation (Supplemental Fig. S1C). As a control, Pat1, a known Dhh1-interacting protein (Coller et al. 2001; Nissan et al. 2010), was co-immunoprecipitated (Fig. 1D). BMV RNA2, detected by quantitative PCR, was enriched approximately ninefold in Dhh1-Flag eluates compared to the untagged Dhh1 control, indicating that Dhh1 interacts with viral RNA2 (Fig. 1D). To test whether the detected interaction is direct or mediated by another protein, we used CRAC analysis (Bohnsack et al. 2009, 2012). This method allows for a rapid and accurate identification of protein binding sites on RNA. Dhh1 directly bound at three sites in the CDS and one in the 3′ UTR, namely within the tRNA-like structure (Supplemental Fig. S1D). Given that Dhh1 is a decapping activator and BMV RNA2 is 5′-capped, the detected binding might be related to decapping and not to the translation activation mechanism. To rule this out, we determined whether Dhh1 affects the stability of RNA2, as expected should decapping be operative. BMV RNA2 was expressed in WT and dhh1Δ strains from an inducible GAL promoter whose activity is repressed in the presence of glucose in the media. After adding glucose, RNA2 levels were followed over 60 min by Northern blot analysis (Fig. 1E). The half-life of RNA2 in dhh1Δ cells was not significantly affected when compared to that in WT cells, indicating that Dhh1 is not involved in BMV RNA2 decapping or decay. Altogether, the data suggest a direct role of Dhh1 and its ATPase activity in BMV RNA2 translation.
Depletion of Dhh1 shifts BMV RNA2 toward fractions containing single ribosomal subunits
To determine which step of BMV RNA2 translation is promoted by Dhh1, we carried out polysome profiling analyses in WT and dhh1Δ cells expressing BMV RNA2. Absorbance measurements indicated that the average monosome to polysome (M/P) ratio in WT and dhh1Δ cells was similar, showing that the absence of Dhh1 does not affect polysome profiles, as previously reported (Fig. 2A; Coller and Parker 2005). Northern blot of RNA2 along the polysome profile showed that depletion of Dhh1 shifted RNA2 toward monosomal, 60S, and 40S fractions (Fig. 2B; Supplemental Fig. S2).
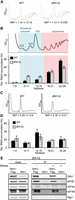
Depletion of Dhh1 shifts BMV RNA2 toward single ribosomal subunit fractions. (A) Global translation is unaffected in a strain expressing RNA2. UV absorbance profile at 254 nm of an extract from WT and dhh1Δ cells expressing RNA2 after sedimentation on a 10%–50% sucrose gradient. The monosome to polysome ratio (M/P ± SEM) is not significantly affected. (B) Sucrose density gradient analysis of BMV RNA2 in WT and dhh1Δ yeast. Below a representative UV absorbance profile is the distribution of normalized RNA2 levels in the specific fractions. Bars represent the average ±SEM from three independent experiments. Fractions were grouped into free (1–5), single ribosomal subunits (6–11), monosomes (12–15), light polysomes (16–21), and heavy polysomes (22–26). The total amount of RNA2 recovered over the gradient was set to 100%. (C) UV absorbance profile at 254 nm after 15-min glucose withdrawal of an extract from WT and dhh1Δ cells expressing RNA2. (D) Distribution of normalized RNA2 levels in the specific fractions after 15-min glucose withdrawal, as in B. (E) Dhh1 interacts with translation initiation factors. Western blot analysis of immunoprecipitation assays. Extracts were either treated (+) or not treated (−) with RNase A prior to the washing steps.
Puromycin, a drug that releases elongating ribosomes, is routinely used to confirm that mRNAs located in polysomal fractions are associated with ribosomes and not to merely heavy RNPs that do not contain ribosomes (Thermann and Hentze 2007). As puromycin and similar drugs do not work in yeast due to poor uptake (Melcher 1971; Schindler and Davies 1975), we inhibited global translation with 15 min of glucose withdrawal to test whether RNA2 is associated with ribosomes (Fig. 2C). Glucose deprivation inhibits translation initiation; thus, if RNA2 is associated with elongating ribosomes, a shift of RNA2 out of polysomes should be observed due to ribosome run-off and the inhibition of initiation. Glucose withdrawal led in WT and dhh1Δ cells to a comparable shift of RNA2 out of the polysomal fractions towards the free fractions and the monosomal fractions (Fig. 2D). Together, these results suggest that Dhh1 promotes translation initiation of RNA2. In agreement with this conclusion, immunoprecipitation analyses showed that Dhh1 binds to the translation initiation factors eIF4E, eIF4A, and eIF4G in an RNase-resistant manner (Fig. 2E).
A stem–loop within the CDS of RNA2 confers dependence on Dhh1 for translation
To identify which BMV RNA2 regions confer Dhh1-dependence for translation, we replaced different RNA2 segments by alternative sequences and quantified 2a and RNA2 levels in the presence and absence of Dhh1 (Fig. 3A). The 5′ and 3′ UTRs of BMV RNA2 are highly structured sequences with overlapping cis-acting signals essential for RNA2 translation and replication (Noueiry and Ahlquist 2003). The BMV 5′ UTR was replaced by that of the GAL1 transcript and the nonpolyadenylated 3′ UTR by the polyadenylated 3′ UTR of the ADH1 transcript. Translation of the natural RNA2 exhibited a 12-fold dependence on Dhh1. Replacing either the 5′ UTR or the 3′ UTR decreased RNA2 Dhh1-dependence to twofold (Fig. 3A). Similarly, the concurrent replacement of both UTRs decreased Dhh1-dependence to twofold. Interestingly, replacing the CDS by that of GFP also resulted in a twofold Dhh1-dependence (Fig. 3A). An RNA derivative lacking RNA2 sequences did not depend on Dhh1 for translation, strengthening the specificity of Dhh1 for the viral RNA. Thus, full dependence on Dhh1 for RNA2 translation requires the concerted action of the 5′ UTR, 3′ UTR, and CDS.
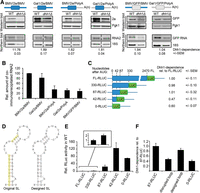
A stem–loop in the 2a CDS confers dependence on Dhh1 for translation. (A) Northern and Western blot analysis of WT and dhh1Δ yeast expressing different BMV and GFP mRNA constructs (schematic diagrams of the constructs depicted on top, in blue native BMV RNA2 sequences). Dhh1-dependence is calculated from the relative expression of 2a and GFP normalized to Pgk1 in WT and dhh1Δ cells. Dhh1-dependence ± SEM is given below. (B) Diagram shows the amount (±SEM) of co-immunoprecipitated RNA2-construct relative to that of WT RNA2 (BMV/2a/BMV) detected by qPCR. The amount of co-immunoprecipitated WT RNA2 was set to 100. (C) Schematic diagrams of RNA2-RLUC constructs containing complete or a part of the 2a CDS fused to RLUC. Translation was determined by measuring luciferase activity corrected by the amount of RNA determined by qPCR. (D) (Left) RNA-fold model of the secondary structure of nucleotides 42–85. Nucleotides marked in yellow have been replaced by complementary ones to disrupt the stem–loop. (Right) Designed structurally equivalent stem–loop. (E) The region between nucleotides 42–87 strongly inhibits RLUC activity. RLUC activity was measured and corrected by the amount of the RNA2 construct determined by qPCR and is represented relative to the activity in the presence of FL-RLUC, which was set to 1. (F) The structure and the position of the stem–loop is important for the dependence of RNA2 translation on Dhh1. WT and dhh1Δ yeast cells transformed with RNA2-RLUC constructs in which the stem–loop structure has been disrupted by point mutations (“disrupted loop”) or replaced by a designed stem–loop structure (“designed loop,” depicted in D). The relative Dhh1 dependence refers to the RLUC ratio between WT and dhh1Δ cells and was set to 1 for FL-RLUC to facilitate comparison. Mean values ± SEM were obtained from at least three independent experiments throughout the figure.
To investigate how replacements of the different RNA2 segments affect Dhh1 binding, we carried out RIP in dhh1Δ cells expressing the different RNA2 constructs plus Dhh1-Flag or Dhh1. In line with the CRAC results indicating crosslinking of Dhh1 to the CDS and the 3′ UTR of BMV RNA2, replacement of the CDS or the 3′ UTR region by the CDS of GFP or by the polyadenylated 3′ UTR of the ADH1 transcript reduced the amount of RNA2 co-immunoprecipitated, while replacement of the 5′ UTR region by that of the GAL1 transcript did not have any significant effect (Fig. 3B; Supplemental Fig. S3). Given that Dhh1 interacts with components of the cap-binding complex (Fig. 2E), it is likely that Dhh1 binds to both the 5′ UTR of BMV RNA2 and that of GAL1 mRNA through interactions with the cap-binding complex. However, such interaction would be only required for translation in the context of RNA2 sequences.
We next focused on the CDS because cis-acting sequences inside the CDS regulating translation have been rarely described. To investigate further which region of the CDS is responsible for Dhh1-dependence, we generated a construct in which the CDS of RNA2 was fused to that of Renilla luciferase (RLUC) and obtained derivatives with successive deletions in the RNA2 CDS. The reporter construct containing the complete CDS of RNA2 (FL-RLUC) exhibited a fivefold Dhh1-dependence for RLUC activity (Fig. 3C). Given the very low expression level of 2a protein in dhh1Δ cells, the difference with the 12-fold Dhh1-dependence observed for WT RNA2 is likely related to the higher sensitivity of luciferase measurements when compared to Western blot analysis. The 330-RLUC derivative shows a similar Dhh1-dependence to FL-RLUC, indicating that the cis-element conferring dependence on Dhh1 is located within these first 330 nt. Given that Dhh1 is a helicase, we explored whether there were structured elements within these 330 nt. Indeed, the Vienna RNA-fold package predicted the formation of a stem–loop structure at nt 42–85 after the initiation codon (ΔG = −11.1 kcal/mol) (Fig. 3D, left). To determine whether this stem–loop was responsible for Dhh1-dependence, we shortened the RNA2 CDS to 87 and 42 nt to generate constructs containing or lacking the stem–loop (Fig. 3C). While 87-RLUC maintained full Dhh1-dependence, this dependence was decreased to twofold in 42-RLUC (Fig. 3C). This twofold difference was also observed in a construct in which the complete RNA2 CDS was deleted (0-RLUC) and is mediated by the UTRs (Fig. 3C). The importance of nt 42 to 87 in translational regulation was also visualized when comparing RLUC activity of the different RNA2 derivatives in WT cells (Fig. 3E). Deletion of the 42–87 sequence led to a large increase of RLUC activity, indicating its repressing function. Nucleotides 87 to 330 also played an important role in translation; however, this effect was independent from Dhh1 activity (Fig. 3C). Collectively, these data indicate that nt 42 to 87 repress translation, a repression that is moderated by Dhh1. To determine whether the sequence or the predicted structure within nt 42–87 mediates Dhh1-dependence, we generated two RNA2 derivatives in which (1) the stem–loop was disrupted by replacing all bases on one side of the stem with complementary ones, and (2) the stem–loop was replaced by a structurally equivalent stem–loop with no sequence homology which was designed using RNAiFold (Fig. 3D, right; Garcia-Martin et al. 2013). Disruption of the stem–loop decreased Dhh1-dependence to that found in 0-RLUC (Fig. 3F). Importantly, Dhh1-dependence was recovered when the stem–loop was replaced by the designed one, as similar values were obtained with this and 87-RLUC RNA2, the derivative containing the minimal sequence conferring full Dhh1-dependence. These data indicate that the stem–loop structure within the RNA2 CDS strongly inhibits translation and mediates the dependence on Dhh1 for translational stimulation.
Dhh1 drives translation of a selected set of cellular mRNAs
Viruses are powerful tools to uncover cellular processes. In fact, most post-transcriptional processes were first described in viral studies and then confirmed in cellular mRNAs (Cullen 2009). To investigate whether Dhh1 can also drive translation of specific cellular mRNAs, we combined three high-throughput analyses in WT and dhh1Δ strains: RNA-seq, ribosome profiling, and CRAC (Fig. 4A). Ribosome profiling combined with RNA-seq provides a snapshot of the translational status of the genome on a transcriptome-wide level and is based on isolating and sequencing ribosome-protected fragments (Ingolia et al. 2012). We performed three independent ribosome profiling and RNA-seq experiments in dhh1Δ cells and were able to align sequence reads to 5424 genes of S. cerevisiae. Both ribosome profiling and RNA-seq results were highly reproducible between biological replicates for each strain (r ≈ 0.99). We compared these data to RNA-seq and ribosome profiling data from WT cells (GSE67387) (Nedialkova and Leidel 2015). Regarding the mRNA levels, in the absence of Dhh1 1467 genes did not exhibit significant changes, whereas 2177 have increased and 1780 decreased levels (Fig. 4B). Given the long-established function of Dhh1 on mRNA decay, an increase in mRNA levels is expected, but a decrease might seem paradoxical. However, it is important to note that Dhh1 also plays a direct role in transcription of some mRNAs (Haimovich et al. 2013). The ribosome protected fragment (RPF) analysis shows that 1841 genes did not exhibit significant changes, while 1775 have decreased and 1808 increased ribosome occupancy (Fig. 4B). To study translation effects, we focused on transcripts where RPF levels, but not mRNA levels, are changed or where changes in the RPF and mRNA levels go in opposite directions. With this, we ensure that the selected mRNAs are translationally regulated. Following these criteria, we identified 492 mRNAs with increased translation rates in dhh1Δ cells, indicating that Dhh1 represses their translation (Supplemental Table S1). The identification of these mRNAs was not surprising as Dhh1 has been widely studied as a repressor of translation. Excitingly, we identified 538 additional mRNAs with decreased translation rates in dhh1Δ cells, indicating that Dhh1 drives their translation in WT cells (Fig. 4B; Supplemental Table S1). Selected mRNAs from these two groups were validated to be translationally regulated by Dhh1 by Western blot and qPCR analysis (Supplemental Fig. S4A–C).
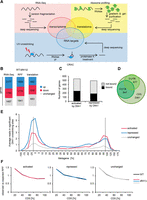
Dhh1 binds and regulates translation of distinct sets of cellular mRNAs. (A) Experimental strategy to identify cellular mRNAs translationally controlled by Dhh1. (B) Changes in mRNA, RPF, and translation comparing WT to dhh1Δ cells. Distribution of significant mRNA and RPF level changes is given for all genes and distribution of translation efficiency changes is given for genes with no changes at the mRNA level and for genes with opposite changes at the mRNA and RPF level. For RNA-seq data, “up” includes genes with a log2-fold change > 0.433 and an adjusted P-value < 0.1. “Down” includes genes with a log2-fold change < −0.433 and an adjusted P-value < 0.1. For RPF data, “up” and “down” includes genes with a log2-fold change > 0 and < 0, respectively, and an adjusted P-value < 0.1. (C) Bar graph showing the number of translationally activated and repressed genes crosslinked and not crosslinked by Dhh1. (D) Venn diagram depicting Dhh1 binding targets identified by CRAC in different transcript regions. (E) Metagene analysis as indicated by CRAC data. Y-axis shows average number of reads in significant Dhh1 crosslinking sites (peaks) in the corresponding region. Reads that were not part of a significant peak are not considered. Dotted lines mark start and stop codon. (F) Metagene analysis of ribosome density in WT and dhh1Δ cells for the different sets of mRNAs. Y-axis shows average of observed RPF reads related to expected ones.
Dhh1 may drive translation of the identified mRNAs by a direct or indirect mechanism. To select the mRNAs directly interacting with Dhh1, we performed two independent CRAC experiments that showed a high correlation (r = 0.90) (Supplemental Fig. S5). In total, 183 (37%) of the translationally repressed mRNAs and 245 (46%) of the translationally activated mRNAs were specifically crosslinked to Dhh1 (Fig. 4C; Supplemental Table S1). Most mRNAs were crosslinked in the CDS and additionally in the 5′ and/or 3′ UTR (Fig. 4D; Supplemental Table S2). To test whether the Dhh1 crosslinking position defines its function in translation regulation, we determined the specific crosslinking sites for all crosslinked genes in the different subsets by calculating the CRAC read distribution across a virtual CDS (Fig. 4E) or per nucleotide (Supplemental Fig. S6). The mRNAs not translationally regulated by Dhh1 exhibit a low and largely uniformly distributed binding pattern. In contrast, mRNAs regulated by Dhh1 exhibit higher Dhh1 crosslinking, particularly around the initiation codon and before the stop codon, with crosslinking around the initiation codon much higher in translationally repressed mRNAs. These different crosslinking patterns may reflect the versatile function of Dhh1 in translational control.
Ribosome profiling enables detection of defects in specific translation steps. Ribosome pausing increases the likelihood of capturing a footprint by sequencing, and hence, defects in translation elongation will result in a peak in ribosome density. In contrast, defects in translation initiation will result in a lower RPF count throughout the complete CDS with no peaks in ribosome densities. We monitored ribosome pausing in different mRNA subsets by calculating the observed versus expected RPF reads (Ingolia et al. 2009) across a virtual CDS and plotted its distribution for the different sets of genes in WT and dhh1Δ cells (Fig. 4F). Hereafter, “activated” only includes mRNAs translationally activated and crosslinked to Dhh1, “repressed,” only mRNAs translationally repressed and crosslinked to Dhh1, and “unchanged,” mRNAs with no changes at the mRNA and RPF level regardless of the crosslinking to Dhh1. In agreement with a role of Dhh1 on translation initiation, no significant differences were observed in WT and dhh1Δ cells for any of the different subsets. Similar results were obtained when focusing on the first 120 nt versus the last ones (Supplemental Fig. S7).
Cellular mRNAs translationally activated by Dhh1 contain long, highly structured CDSs
To further understand the underlying mechanism of Dhh1 function in translation regulation, we studied the physical properties of the specific mRNA subsets. First, we calculated the average length of the CDS and the 5′ and 3′ UTRs for mRNAs translationally activated, repressed, or not affected by Dhh1. Translationally activated mRNAs have, on average, a twofold longer CDS than repressed or not affected mRNAs (Fig. 5A). However, no significant length differences were detected between mRNA subsets for 5′ and 3′ UTRs. It was previously shown that longer CDSs present lower ribosome density (Arava et al. 2003). This decreased translation efficiency might result from the fact that the folding probability increases with the length of the CDS. To explore this possibility, we calculated the intrinsic tendency to form secondary structures using the published parallel analyses of RNA structure (PARS) (Kertesz et al. 2010). In this pioneering study, PARS scores were obtained by coupling deep sequencing with enzyme probing of paired and unpaired nucleotides of isolated yeast total mRNAs. We calculated the mean PARS score for the CDS and the UTRs of the different mRNA subsets and “all” genes. “All” includes all mRNAs for which the PARS score has been published. Importantly, translationally activated mRNAs present higher mean PARS values in the CDS (0.49) than all genes (0.37) and higher than those mRNAs translationally repressed (0.33) or not affected (0.27), with these differences being highly significant (P ≤ 0.0001) (Fig. 5B). Noteworthy, both repressed and not affected genes have a lower mean PARS score in the 5′ UTR (0.05 and 0.08, respectively) than all genes and translationally activated mRNAs (both 0.17). A plausible explanation for this observation would be that mRNAs not affected by Dhh1 do not require other RNA helicases, whereas the majority of all cellular mRNAs does require the action of RNA helicases. No significant differences were observed among PARS values of 3′ UTRs.
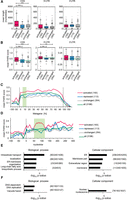
Cellular mRNAs translationally activated by Dhh1 contain highly structured CDSs. From the total number of mRNAs translationally activated, translationally repressed, and unchanged, only the given numbers were analyzed; as for the rest, the UTRs and CDSs are not annotated. (A) Genes translationally activated by Dhh1 have a significantly longer CDS (P < 0.0001 [***]). P-values were computed after permuting randomly 1000 times the labels of the genes in the two groups (detailed in Supplemental Methods). Distribution of the average length of the 5′ UTR, CDS, and 3′ UTR for genes translationally activated, repressed, and not affected by Dhh1 represented in a Tukey plot. Numbers in parentheses give the number of transcripts per subset. (B) Genes translationally activated by Dhh1 have significantly higher PARS scores in the CDS (P < 0.0001 [***]) and the 5′ UTR (P < 0.01 [**]). P-values as in A. Distribution of the average PARS score of the 5′ UTR, CDS, and 3′ UTR for genes translationally activated, repressed, and not affected by Dhh1 represented in a Tukey plot (band inside each box represents the median); cross indicates mean PARS score of each subset; green line marks mean PARS of all genes. Numbers in parentheses give the number of transcripts per subset. (C) Metagene PARS score analysis of the different sets of genes. Y-axis shows the average of smoothened PARS scores on the corresponding region. Smoothing is achieved by calculating the average PARS scores over a window of size 20 centered on the corresponding nucleotide. Dotted lines mark the start and stop codon; green box marks the 7.5%–15% region, one area with an especially high difference between the PARS scores. Numbers in the legend indicate the number of analyzed genes in each subset. (D) As in C, but for the 5′ UTR and the first 300 nt. Green box marks nucleotides 50–120. (E) GO term analysis for genes translationally activated and bound by Dhh1 regarding biological process and cellular component. Numbers in parentheses indicate (B/n/b). B = total number of genes associated with functional category (often comprising several GO terms grouped by REVIGO); n = number of genes in input list; b = number of genes in intersection. (F) As in E, but for genes translationally repressed and bound by Dhh1.
Next, we analyzed the PARS score distribution across a virtual gene in which values are averaged over percentage bins (25% in the UTRs and 5% in the CDS) for the three subsets of mRNAs and all mRNAs (Fig. 5C). Although mRNAs translationally activated by Dhh1 had significantly higher PARS values throughout the complete 5′ UTR and CDS, one of the biggest and more statistically significant differences between activated and repressed or not affected mRNAs was observed at the 7.5%–15% region of the metagene (Fig. 5C; Supplemental Table S3A). To identify the nucleotides involved, we plotted the PARS score versus the nucleotide position (Fig. 5D). One of the biggest and more statistically significant differences between the activated and the repressed/unchanged mRNAs was found between nucleotides 50–120 after the initiation codon (Supplemental Table S3B). Remarkably, this area overlaps with the location of the mapped stem–loop in BMV RNA2 (nucleotides 42–87).
Together, these results show that Dhh1 is required to drive translation of a specific subset of cellular mRNAs that, similar to the BMV RNA, harbors highly structured 5′ UTRs and long and highly structured CDSs.
Dhh1 drives translation of mRNAs coding primarily membrane and secreted proteins
Specific mRNA features might allow coregulation of functionally related proteins. To determine whether the mRNAs translationally regulated by Dhh1 are functionally linked, we performed Gene Ontology (GO) analysis (Fig. 5E,F). Genes translationally activated by Dhh1 were highly enriched for intracellular transport processes. Accordingly, GO terms under cellular components were enriched in ER and membranes (Fig. 5E). In contrast, translationally repressed genes were enriched for proteins involved in DNA-dependent DNA replication and vacuole fusion. Accordingly, the GO term enriched regarding the cellular component of this subset was the nuclear nucleosome (Fig. 5F).
The ER and the cytosol represent distinct biological environments for translation with different regulatory factors affecting protein expression. Secreted proteins are preferentially translated at the ER by mechanisms that are still under intense study (Ast and Schuldiner 2013; Cui and Palazzo 2014; Jan et al. 2014; Reid and Nicchitta 2015). The canonical route is based on the cotranslational recognition of a hydrophobic region in the mRNA by the signal recognition particle (SRP). This results in a repression of translation until the RNP reaches the ER. Less-understood SRP-independent routes include ribosome-mediated mRNA targeting, post-translational targeting, and RNA-based localization (Ast and Schuldiner 2013). Based on published predictions (Ast et al. 2013), from the identified Dhh1-dependent mRNAs, 45% utilize the SRP-dependent and 55% a SRP-independent pathway, indicating that Dhh1-mediated translational control functions alongside the SRP-dependent and -independent pathways.
A previous study described that mRNAs encoding secreted proteins display lower PARS scores in the 5′ UTR and the first 30 nt of the CDS (Kertesz et al. 2010). This seems to be contradictory to our results, as the subset of activated genes consists of ∼30% of secreted proteins and is characterized by a higher PARS score. When we analyzed the PARS score distribution per metagene and per nucleotide of the secreted genes in the activated gene set (Supplemental Fig. S8A,B), we observed that these mRNAs exhibit an even higher PARS score in the 5′ UTR and CDS, including the first 30 nt, than those from the complete subset of translationally activated mRNAs. Thus, this specific group of secreted proteins harbors unique features that might correlate with their dependence on Dhh1 for translation.
Dhh1 functions as a translational activator in humans
Dhh1 is highly conserved from yeast to humans. We have previously observed that DDX6, the Dhh1 human counterpart, drives translation of Hepatitis C virus RNA in human hepatoma cell lines (Scheller et al. 2009). To approach whether this function is extended to human mRNAs, we first studied the physical properties of the human homologs of the yeast mRNAs translationally activated by Dhh1. They contained, like their yeast counterparts, long CDSs. In contrast to yeast, human mRNAs have been described not to contain, on average, highly structured CDSs (Wan et al. 2014). Interestingly, when we calculated the mean PARS score distribution using the PARS data set of the child described in Wan et al. (2014), we identified in the human mRNA homologs of the yeast mRNAs translationally activated by Dhh1, but not in the translationally repressed ones, structured regions in the CDSs. Interestingly, one of them is located 60–100 nt after the start codon (Fig. 6A), a location that overlaps with the one identified for yeast and viral mRNAs. Together, this suggests that DDX6 might drive translation of human mRNAs by similar mechanisms. As a proof-of-principle, we focused on the PTCH1 mRNA, the human counterpart of the yeast NCR1 mRNA, because of its clinical importance, as its de-regulation is a hallmark of pancreatic cancer. The PTCH1 mRNA exhibits a strong peak in the PARS score distribution after the starting codon (Fig. 6B) and has a very long CDS, features we defined to be typical for mRNAs translationally activated by Dhh1. Indeed, PTCH1 mRNA depended on DDX6 for translation. DDX6 depletion by siRNA-mediated silencing resulted in a decrease in the PTCH1 protein level without affecting the PTCH1 mRNA level, indicating a positive role of DDX6 in translation of the PTCH1 mRNA (Fig. 6C).
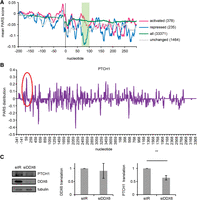
Dhh1-mediated translational control is seemingly conserved from yeast to humans. (A) PARS score distribution analysis of the human mRNA counterparts for the 5′ UTRs and the first 300 nt of the CDS. Axis and smoothing as in Figure 5C. Green box marks nucleotides 60–100. (B) PARS score of the 5′ UTR and the first 300 nt of PTCH1 mRNA. (C) DDX6 drives translation of PTCH1. Western blot, qPCR, and translation rates of PTCH1 after DDX6 silencing. Translation was determined by correcting protein levels by the amount of the corresponding RNA. As a control for equal sample size, tubulin protein levels and HPRT1 mRNA levels were examined. Experiments have been carried out at least three times independently. (**) P < 0.05, t-test.
Discussion
The impact of RNA secondary and tertiary structures within the CDS on gene expression is poorly understood. Here, we describe a novel translation control mechanism, conserved from yeast to humans and hijacked by viruses, that involves the DEAD-box helicase Dhh1 and RNA structures within the UTRs and coding regions. Our results, first observed in a viral RNA and then extended to cellular mRNAs enriched in secreted proteins, are based on four major lines of evidence. First, the mRNAs present highly structured 5′ UTRs and CDSs, including a structured region located around 70 nt after the translation initiation site (nucleotides 42–87 for BMV RNA, nucleotides 50–120 for yeast mRNAs, and nucleotides 60–100 for human mRNAs). This was observed with PARS analyses and validated with mutational assays. Second, polysome and ribosome profiling suggest that Dhh1 drives translation at the translation initiation step. Consistent with a role in translation initiation, Dhh1 interacts with translation initiation factors, as observed in immunoprecipitation assays. Third, in contrast to its established role as a translational repressor and decapping activator, Dhh1 does not affect the steady-state level of the identified mRNAs, indicating that the role of Dhh1 in translation is not linked to its role in translation repression and decapping. Fourth, Dhh1 binds to mRNAs that depend on Dhh1 for translation with a different specificity compared to those mRNAs that do not depend on Dhh1 for translation, as found with CRAC analyses, suggesting a link between binding and mode of action. Together, these results uncover a novel translational regulation mechanism driven by Dhh1 that involves RNA folding within CDSs.
Using the ability of BMV RNA to translate and replicate in yeast, we find that not only the CDS but also both UTRs confer Dhh1-dependence for translation. Full dependence was only achieved when the three regions were present. This suggests a scenario in which Dhh1 remodels tertiary contacts involving the three regions. Our CRAC data identified crosslinking of Dhh1 to sequences in the 3′ UTR and CDS but not to the identified stem–loop (Supplemental Fig. S1D). The low number of reads observed for the stem–loop sequence could be due to transient unwinding and therefore low steady-state interaction due to short residence of the helicase. Alternatively, Dhh1 might be required to remodel only some of the RNA helices involved in these interactions. In agreement with this model, a recent study shows that DEAD-box helicases can disrupt tertiary contacts by binding a secondary structure only after it spontaneously loses its tertiary contacts. After binding, they use ATP to unwind the helix (Pan et al. 2014). Interestingly, the requirement for spontaneous dynamics implies a preference of DEAD-box helicases for less stable RNA structures, which are likely to experience greater dynamic fluctuations (Pan et al. 2014). One would expect such low stable structures to exist in mRNA CDSs given that vastly fewer structures are identified by RNA probing in vivo than in vitro (Rouskin et al. 2014). Thus, a similar Dhh1 mode of action involving tertiary contacts might be operating the Dhh1-dependence of cellular mRNAs, given that they present high PARS values not only in the regions located around 70 nt after the initiation codon but also across the CDSs and UTRs. Moreover, as for BMV RNA, we did not detect by CRAC analyses a direct Dhh1 binding to this region but to other sequences in the mRNA. Besides CDS RNA remodeling, Dhh1 might exert alternative or additional functions in translation. Our interesting observations that Dhh1 interacts with members of the eIF4F complex (Fig. 2E) and that both UTRs are involved in Dhh1-dependence suggest a model in which Dhh1 would help in forming a 5′-3′ closed loop to favor translation. This might be of special importance for BMV RNA2 as it contains a tRNA-like structure at its 3′ end instead of a poly(A) tail, a major element that mediates circularization via PAB1 binding.
Given the high conservation of Dhh1 from yeast to mammals, it is plausible that its human counterpart DDX6 activates translation of certain human mRNAs by similar mechanisms. Indeed, we show that the human homologs of the yeast mRNAs translationally activated by Dhh1 share the highly structured region around nucleotide 70 of the CDS, and as a proof-of-principle, we demonstrated that DDX6 promotes translation of the PTCH1 mRNA. Given the role of DDX6 in PTCH1 mRNA translation, DDX6 overexpression would result in PTCH1 overexpression, a feature typical of pancreatic cancer. Interestingly, DDX6 is overexpressed in several cancers (Nakagawa et al. 1999; Hashimoto et al. 2001; Miyaji et al. 2003; Lin et al. 2008; Sen et al. 2015; Taniguchi et al. 2015), opening the possibility that translational regulation by DDX6 plays an important role in malignant transformations.
The cellular mRNAs translationally activated by Dhh1 encode mainly secreted and membrane proteins. Many of these mRNAs have in common that they are preferentially translated at the ER. Curiously, BMV RNA2 has been described to accumulate at the ER in the presence of the viral recruitment protein 1a, and Dhh1 assists in this recruitment process (Chen et al. 2001; Mas et al. 2006). Furthermore, deletion of a region in the RNA2 CDS containing the identified stem–loop decreases the recruitment rate (Chen et al. 2001). Similar to BMV, multiple positive-strand RNA viruses, including serious human pathogens such as HCV and the emerging Dengue virus and Chikungunya virus, replicate their RNA genome in ER-derived double membranes termed spherules (den Boon and Ahlquist 2010). The spherules function as organelle-like compartments that scaffold, protect, and coordinate multiple facets of genome replication, expression, and encapsidation. Given that most viral infection steps are associated with ER membranes, it will seem plausible that these viruses would ensure expression of viral proteins in the ER to facilitate their function. Besides the presence of transmembrane domains in some viral proteins, little is known about how viral mRNAs would be preferentially translated at the ER. Our results suggest that positive-strand RNA viruses hijack Dhh1 not only to help in the recruitment process to the ER but also to promote translation of viral messengers through RNA remodeling.
Translation at the ER is under intense study as neither the targeting nor the translation mechanism is completely understood (Ast and Schuldiner 2013; for review, see Cui and Palazzo 2014; Reid and Nicchitta 2015). In our analyses, we identified 65 mRNAs coding secretome proteins (Ast et al. 2013) whose translation is promoted by Dhh1. Moreover, proximity-specific ribosome profiling analyses demonstrate that all these mRNAs are cotranslationally targeted to and translated at the ER (Jan et al. 2014). The targeting pathways involve SRP-dependent and SRP-independent mechanisms, suggesting that Dhh1 can function across pathways. Notably, the highly structured AUG-proximal CDS sequence located between nucleotides 50 and 120 in cellular mRNAs translationally activated by Dhh1 partially overlaps with two cis-acting ER targeting signals. One is the hydrophobic core domain recognized by SRP to halt translation (Meyer and Dobberstein 1980; Walter and Blobel 1981a,b; Walter et al. 1981; Meyer et al. 1982), and the other is a nonoptimal codon cluster of 35–40 codons located downstream from the SRP-binding site that promotes nascent-chain recognition by slowing down translation (Pechmann et al. 2014). The location of these three features (SRP recognition site, nonoptimal codon cluster, and highly structured region) within the initial portion of the CDS highlights the complexity of the information stored in the mRNA sequence for translation. As secreted and membrane proteins often contain aggregation-prone hydrophobic domains, this complexity might be required to ensure appropriate local translation and to avoid accumulation of toxic aggregates in the cytosol. Interestingly, additional structural RNA cis-signals in the CDS might be guiding mRNA localization, as genome-wide structurome studies (Kertesz et al. 2010) identified an increased structure in the CDS of mRNAs encoding proteins that localize in specific subcellular compartments, such as cell wall, vacuole, and ER, or that function in distinct metabolic pathways, such as glycolysis, or organic acid and amine metabolic processes.
In our study, we also identified a group of mRNAs that are translationally repressed by Dhh1 and enriched in mRNAs coding proteins involved in nuclear processes. We were surprised by the relatively low number of translationally repressed mRNAs, as Dhh1 is well-known as a general translational repressor. However, of note is that in those studies Dhh1 was overexpressed or tethered to the 3′ UTR of an mRNA, or cells were stressed (Coller and Parker 2005; Carroll et al. 2011; Sweet et al. 2012), while in our study Dhh1 was depleted and cells were grown to log phase under normal growth conditions. Likewise, previous Dhh1 crosslinking and immunoprecipitation (CLIP) analyses, a UV crosslinking technique similar to CRAC, were carried out under stress conditions (Mitchell et al. 2013). Despite these differences, 58% of the identified Dhh1-bound mRNAs are common in both conditions.
In conclusion, our findings bring to light a novel layer of translational control that involves the DEAD-box RNA helicase Dhh1 and RNA folding within the CDS. Two other DEAD-box helicases, Ded1 and eIF4A, have recently been shown to jointly facilitate ribosome scanning through secondary structures at the 5′ UTR of mRNAs (Sen et al. 2015). Thus, a complex cooperation between distinct DEAD-box helicases seems to be required for translation to proceed, possibly allowing tight control over specific mRNA fates.
Methods
Yeast strains, molecular and cell biology techniques, a list of plasmids, high-throughput methods, and detailed computational analysis are described in Supplemental Methods. Unless indicated, all yeast growth and translation experiments were carried out under permissive conditions (30°C).
Polysome profiling
Polysome profiling was carried out as previously described (Noueiry et al. 2003) with slight modifications. Briefly, cells were grown from OD600 = 0.02 to mid-exponential phase (OD600 ∼ 0.4) at 30°C and treated for 1 min with 100 µg/mL cyclohexamide (CHX). Cells were harvested by vacuum filtration, frozen in liquid nitrogen, and pulverized under cryogenic conditions at 5 cps in a SPEX 6750 Freezer/Mill (SPEX SamplePrep) in 20 mM Tris-HCl (pH = 7.5), 100 mM NaCl, 10 mM MgCl2, 1% Triton X-100, 0.5 mM DTT, 100 µg/mL CHX. Extracts were purified by several centrifugation steps. Twelve units of OD260 from extracts were loaded on a linear 10%–50% sucrose gradient and spun for 3 h at 35,000 rpm in a Beckman SW41 rotor. Fractions were collected, and 30 ng of purified BMV RNA3 were added to each fraction before further processing to normalize for technical variations during the purification. RNA was purified and analyzed by Northern blot.
Ribosome profiling
Ribosome profiling was carried out as previously described (Ingolia et al. 2009, 2012; Nedialkova and Leidel 2015). Detailed information of the experimental procedure and details on ribosome profiling data analysis is available in the Supplemental Methods.
CRAC experiments and analysis
CRAC experiments were performed as previously described (Bohnsack et al. 2009, 2012) and analyzed using pyicoclip (http://regulatorygenomics.upf.edu/Software/Pyicoteo/pyicoclip.html). Detailed processing information is available in the Supplemental Methods.
RNA secondary structure prediction
All RNA secondary structure prediction and base-pairing probability calculations were carried out by running RNAfold and RNAfold –p from the Vienna package, version 2.1.7 (Lorenz et al. 2011). Design of the mutant RNA2-BMV stem–loop was carried out using RNAiFold (Garcia-Martin et al. 2013).
Data access
The ribosome profiling and RNA-seq data from dhh1Δ cells in this study have been submitted to the NCBI Gene Expression Omnibus (GEO; http://www.ncbi.nlm.nih.gov/geo/) under accession number GSE87892. The CRAC data from this study have been submitted to GEO under accession number GSE87888.
Acknowledgments
We thank P. Carvalho, R. Bock, R. Lill, Arlen Johnson, and P. Ahlquist for reagents. We thank K. Qu and H. Chang for the processed human PARS data. We also thank B. Blasco, F. Gebauer, R. Méndez, and A. Palazzo for stimulating discussions and comments on the manuscript and P. Hackert for help with the CRAC experiments. This work was supported by the Spanish Ministry of Economy and Competitiveness through grants BFU2013-44629-R, BFU2016-80039-R (AEI/MINEICO/FEDER, UE) and the “Maria de Maeztu” Programme for Units of Excellence in R&D (MDM-2014-0370). J.J. was supported by the grant 2012FI_B00574 from the Generalitat de Catalunya. This work was also supported by the Deutsche Forschungsgemeinschaft (SFB860 to M.T.B.), the Alexander von Humboldt foundation (to K.E.S. and M.T.B.), the Max Planck Society (to S.A.L.), the Spanish Ministerio de Economia y Competividad/ISCIII-FEDER (PI14/00125 to P.N.), and the Generalitat de Catalunya (2014/SGR/143 to P.N.).
Footnotes
-
[Supplemental material is available for this article.]
-
Article published online before print. Article, supplemental material, and publication date are at http://www.genome.org/cgi/doi/10.1101/gr.209015.116.
- Received April 26, 2016.
- Accepted November 3, 2016.
This article is distributed exclusively by Cold Spring Harbor Laboratory Press for the first six months after the full-issue publication date (see http://genome.cshlp.org/site/misc/terms.xhtml). After six months, it is available under a Creative Commons License (Attribution-NonCommercial 4.0 International), as described at http://creativecommons.org/licenses/by-nc/4.0/.


