
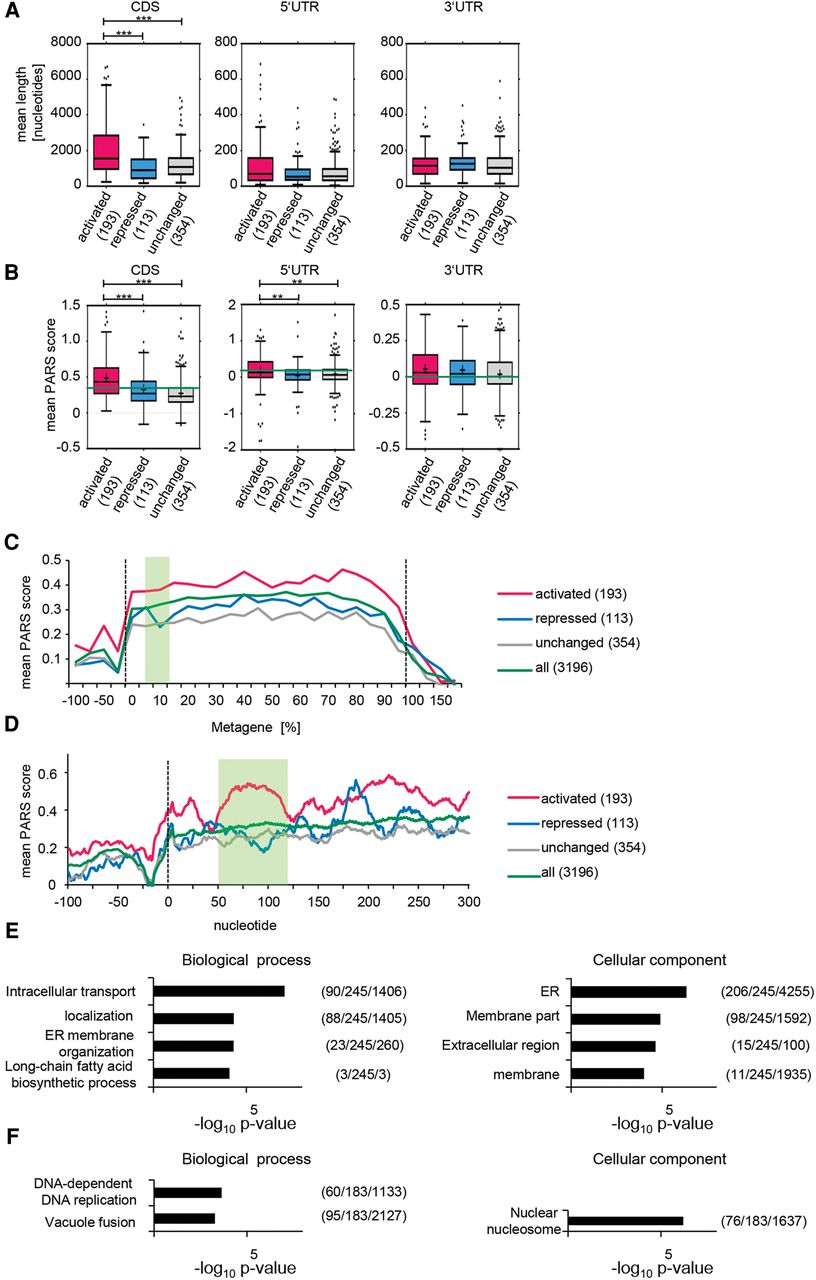
Cellular mRNAs translationally activated by Dhh1 contain highly structured CDSs. From the total number of mRNAs translationally activated, translationally repressed, and unchanged, only the given numbers were analyzed; as for the rest, the UTRs and CDSs are not annotated. (A) Genes translationally activated by Dhh1 have a significantly longer CDS (P < 0.0001 [***]). P-values were computed after permuting randomly 1000 times the labels of the genes in the two groups (detailed in Supplemental Methods). Distribution of the average length of the 5′ UTR, CDS, and 3′ UTR for genes translationally activated, repressed, and not affected by Dhh1 represented in a Tukey plot. Numbers in parentheses give the number of transcripts per subset. (B) Genes translationally activated by Dhh1 have significantly higher PARS scores in the CDS (P < 0.0001 [***]) and the 5′ UTR (P < 0.01 [**]). P-values as in A. Distribution of the average PARS score of the 5′ UTR, CDS, and 3′ UTR for genes translationally activated, repressed, and not affected by Dhh1 represented in a Tukey plot (band inside each box represents the median); cross indicates mean PARS score of each subset; green line marks mean PARS of all genes. Numbers in parentheses give the number of transcripts per subset. (C) Metagene PARS score analysis of the different sets of genes. Y-axis shows the average of smoothened PARS scores on the corresponding region. Smoothing is achieved by calculating the average PARS scores over a window of size 20 centered on the corresponding nucleotide. Dotted lines mark the start and stop codon; green box marks the 7.5%–15% region, one area with an especially high difference between the PARS scores. Numbers in the legend indicate the number of analyzed genes in each subset. (D) As in C, but for the 5′ UTR and the first 300 nt. Green box marks nucleotides 50–120. (E) GO term analysis for genes translationally activated and bound by Dhh1 regarding biological process and cellular component. Numbers in parentheses indicate (B/n/b). B = total number of genes associated with functional category (often comprising several GO terms grouped by REVIGO); n = number of genes in input list; b = number of genes in intersection. (F) As in E, but for genes translationally repressed and bound by Dhh1.


