
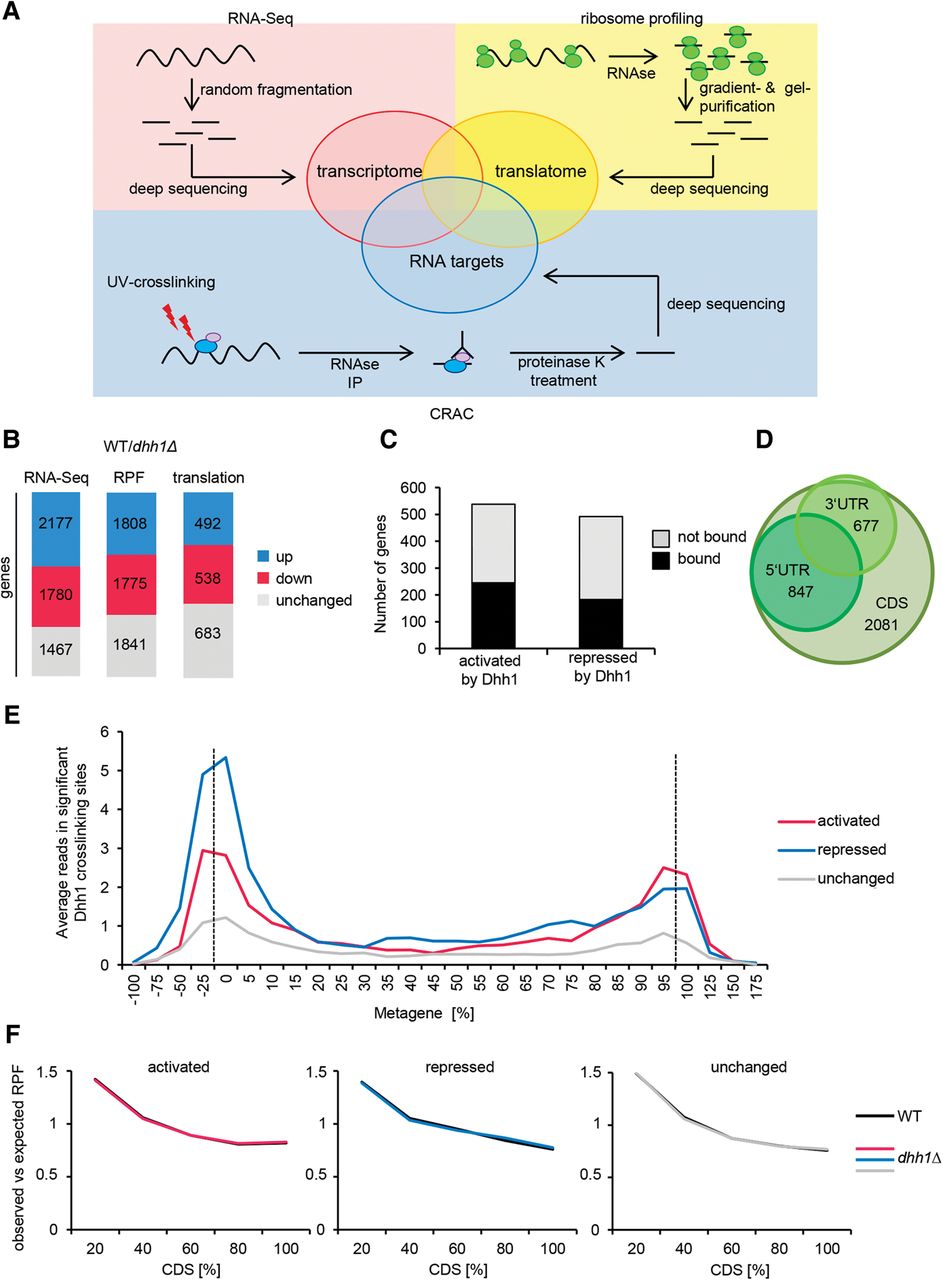
Dhh1 binds and regulates translation of distinct sets of cellular mRNAs. (A) Experimental strategy to identify cellular mRNAs translationally controlled by Dhh1. (B) Changes in mRNA, RPF, and translation comparing WT to dhh1Δ cells. Distribution of significant mRNA and RPF level changes is given for all genes and distribution of translation efficiency changes is given for genes with no changes at the mRNA level and for genes with opposite changes at the mRNA and RPF level. For RNA-seq data, “up” includes genes with a log2-fold change > 0.433 and an adjusted P-value < 0.1. “Down” includes genes with a log2-fold change < −0.433 and an adjusted P-value < 0.1. For RPF data, “up” and “down” includes genes with a log2-fold change > 0 and < 0, respectively, and an adjusted P-value < 0.1. (C) Bar graph showing the number of translationally activated and repressed genes crosslinked and not crosslinked by Dhh1. (D) Venn diagram depicting Dhh1 binding targets identified by CRAC in different transcript regions. (E) Metagene analysis as indicated by CRAC data. Y-axis shows average number of reads in significant Dhh1 crosslinking sites (peaks) in the corresponding region. Reads that were not part of a significant peak are not considered. Dotted lines mark start and stop codon. (F) Metagene analysis of ribosome density in WT and dhh1Δ cells for the different sets of mRNAs. Y-axis shows average of observed RPF reads related to expected ones.


