
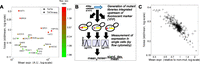
Noise–mean relationship in mutated promoters
- Gil Hornung1,
- Raz Bar-Ziv1,
- Dalia Rosin1,
- Nobuhiko Tokuriki2,
- Dan S. Tawfik2,
- Moshe Oren3 and
- Naama Barkai1,4
- 1Department of Molecular Genetics;
- 2Department of Biological Chemistry;
- 3Department of Molecular Cell Biology, Weizmann Institute of Science, Rehovot 76100, Israel
Abstract
Gene expression depends on the frequency of transcription events (burst frequency) and on the number of mRNA molecules made per event (burst size). Both processes are encoded in promoter sequence, yet their dependence on mutations is poorly understood. Theory suggests that burst size and frequency can be distinguished by monitoring the stochastic variation (noise) in gene expression: Increasing burst size will increase mean expression without changing noise, while increasing burst frequency will increase mean expression and decrease noise. To reveal principles by which promoter sequence regulates burst size and frequency, we randomly mutated 22 yeast promoters chosen to span a range of expression and noise levels, generating libraries of hundreds of sequence variants. In each library, mean expression (m) and noise (coefficient of variation, η) varied together, defining a scaling curve: η2 = b/m + ηext2. This relation is expected if sequence mutations modulate burst frequency primarily. The estimated burst size (b) differed between promoters, being higher in promoter containing a TATA box and lacking a nucleosome-free region. The rare variants that significantly decreased b were explained by mutations in TATA, or by an insertion of an out-of-frame translation start site. The decrease in burst size due to mutations in TATA was promoter-dependent, but independent of other mutations. These TATA box mutations also modulated the responsiveness of gene expression to changing conditions. Our results suggest that burst size is a promoter-specific property that is relatively robust to sequence mutations but is strongly dependent on the interaction between the TATA box and promoter nucleosomes.
Biological processes are often executed by a small number of molecules per individual cell, leading to significant cell-to-cell variability (“noise”) in gene expression (Paulsson 2004; Maheshri and O'Shea 2007; Raj and van Oudenaarden 2008; Tawfik 2010). When analyzing gene expression noise, it is convenient to distinguish between intrinsic variations, resulting from stochastic production, and extrinsic variations propagating from global (e.g., ribosomes, polymerases, metabolites, etc.) or pathway-specific factors (Elowitz et al. 2002). Intrinsic noise is of particular interest, as it reflects on the transcription process itself (Paulsson 2004, 2005; Raser and O'Shea 2004; Raj and van Oudenaarden 2008; Rinott et al. 2011; So et al. 2011).
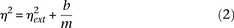
The prevailing model of gene expression noise assumes that genes transit stochastically between states that are permissive or nonpermissive to transcription (Paulsson 2004, 2005; Raser and O'Shea 2004; Friedman et al. 2006; Raj et al. 2006; Zenklusen et al. 2008; So et al. 2011). This two-state model predicts a scaling relationship between mean expression m and the coefficient of variation (noise, SD/mean) η: η2 = b/m + ηext2 where b is the typical number of protein molecules made during a single “on” state (“burst size”) and ηext denotes the extrinsic noise (Paulsson 2004, 2005; Raser and O'Shea 2004; Bar-Even et al. 2006; Raj et al. 2006; Pedraza and Paulsson 2008; Tan and van Oudenaarden 2010; Taniguchi et al. 2010). Note that burst size, b, accounts for all the transcription-translation processes following the main stochastic event (burst initiation), integrating the number of mRNA molecules produced per burst and the number of protein molecules made per each mRNA molecule. Upon a perturbation, the noise–mean relationship may change, depending on whether burst size or burst frequency were modulated (Pedraza and Paulsson 2008; Zenklusen et al. 2008; Tan and van Oudenaarden 2010).
Genome-wide analysis of the noise–mean relationship in yeast (Bar-Even et al. 2006; Newman et al. 2006) or Escherichia coli (Taniguchi et al. 2010; So et al. 2011) genes reported a general dependency that was well defined by the scaling relation η2 = b/m + ηext2, suggesting a similar burst size for many genes. The expression of genes deviating from the scaling curve, displaying higher-than-expected noise (Bar-Even et al. 2006; Newman et al. 2006), was more responsive to changing conditions and also diverged more between related species (Tirosh and Barkai 2008; Choi and Kim 2009; Lehner 2010). Notably, high noise, responsiveness, and divergence were all correlated with the organization of gene promoters: All three measures were low in promoters lacking a TATA box and containing a nucleosome free region (NFR) proximal to the transcription start site (referred to as DPN promoters—depleted proximal nucleosome), and were high in TATA-containing promoters that lack NFR (OPN, occupied proximal nucleosome) (Field et al. 2008; Tirosh and Barkai 2008; Choi and Kim 2009). TATA box was also shown to increase noise in Pho5 expression (Raser and O'Shea 2004) and in synthetic promoters (Blake et al. 2006; Murphy et al. 2010).
The observation that genes with a characteristic promoter structure had a high noise (relative to that expected given their mean expression) is consistent with the idea that promoter sequence influences not only burst frequency but also burst size. Still, the principles by which promoter sequences regulate those two processes are not understood, primarily because most studies analyzing the interplay between promoter sequence variations and gene expression consider mean expression only (e.g., Yun et al. 2012).
To distinguish between the effects of promoter sequence on burst size and burst frequency, we generated large libraries of sequence-mutated promoters. Specifically, we chose 22 yeast promoters that span a range of expression and noise levels. Using mutagenic PCR, we generated hundreds of sequence variants of each promoter. Each variant was fused to a fluorescent reporter, and the associated mean expression and noise (coefficient of variation) in a population of identical cells were measured. We found that sequence variants in each of the libraries defined a scaling curve η2 = b/m + ηext2, with a constant estimated burst size b, that was largely promoter-specific and was particularly large for OPN promoters containing a TATA box. A small fraction of sequence mutations leading to a large change in burst size was identified in the OPN-type promoters containing a TATA box. These changes were biased toward reducing burst size, and were almost fully explained by elimination of a TATA box or insertion of a new out-of-frame translation start site. Interestingly, mutations that deleted a TATA box in low-noise DPN-type promoters did not reduce burst size. Our results suggest that burst size is a promoter-specific property that is insensitive to most sequence mutations but is largely influenced by the interaction between TATA box and promoter nucleosomes.
Results
Noise in mutated promoters scales with mean abundance
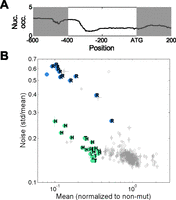
We chose 22 Saccharomyces cerevisiae promoters spanning a range of mid-to-high expression levels. Promoters chosen differed in their nucleosome organization and in the presence (or absence) of a TATA box (Fig. 1A; Supplemental Table S1). To randomly mutate promoter sequences, we performed mutagenic PCR amplification on a 400-bp region upstream of the ATG, containing the promoter region and the 5′ UTR. Amplified DNA was cloned into a bacterial plasmid and chromosomally integrated into the same (neutral) locus upstream of a YFP reporter. This way, we created for each promoter a library of ∼300 strains, each containing a different promoter variant (Fig. 1B).
Screen for mutations that affect noise. (A) Promoters used to generate the library. Shown is the noise of each nonmutated promoter as a function of its mean expression. The ratio of nucleosome occupancy close to the TSS and further upstream (Methods) is depicted in color code. Promoters with a low occupancy ratio are DPN type, whereas promoters with a high ratio are OPN. (Squares) Promoters with a conserved TATA box based on Basehoar et al. (2004). (B) Screen design: 400 bp upstream of the ATG of each yeast promoter were cloned, mutated using random PCR, and placed upstream of a yellow fluorescent protein. Expression and noise from single colonies were measured using flow cytometry. (C) Mean expression and noise for all variants in ERG6 promoter library. (Error bars) Standard error of three biological repeats.
We quantified the expression levels of each strain in the library using a flow cytometer (Fig. 1B; Methods) and summarized the distribution of single-cell fluorescence levels by its mean, m, and coefficient of variation (noise), η (raw results are provided as Supplemental Data). The noise levels of the nonmutated promoters varied, with OPN-type promoters containing a TATA box showing higher noise levels, as expected (Fig. 1A). Promoter mutations generally reduced mean expression, although we did observe some cases of increased expression.
As discussed above, sequence variants that change burst size are expected to change only the mean expression while leaving noise intact. In contrast, sequence variants that modulate burst frequency are expected to coordinately change noise and mean expression according to the relation η2 = b/m + ηext2 (Bar-Even et al. 2006; Friedman et al. 2006; Raj et al. 2006; Tan and van Oudenaarden 2010). Examining the noise–mean relation in all variants in our libraries, we found that mean expression and noise were strongly coupled (Figs. 1C, 2A–C; Supplemental Fig. S1): Mutations that increased mean expression reduced noise and vice versa. When plotted on a log-log plot, noise was roughly proportional to the (inverse) mean abundance (η2 ∼ b/m + ηext2) (Figs. 1C, 2A–C). Within this model burst size b is given by the intercept of the curve, while ηext is estimated by the asymptotic noise value at high mean. Only two promoters (HXT3 and PFY1) showed a better fit to an alternative power-law model η ∼ αmβ (Supplemental Table S3), based on an F-test for the sum of squared residuals (Jaqaman and Danuser 2006). HSC82 displayed a unique behavior, which will be discussed below (Fig. 5B, see below).
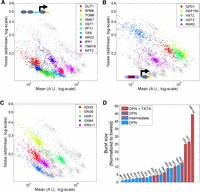
Scaling of noise with mean abundance. (A) Noise properties of NFR-containing, TATA-less promoters. Noise versus mean expression is shown for 11 promoters with a clear NFR and no TATA box. Different colors correspond to different promoters, as described. (B) Noise properties of TATA-containing promoters without NFR. Same as A for promoters that lack NFR and that contain a TATA box. (C) Noise properties of “intermediate” promoters. Same as A for promoters with intermediate nucleosome occupancy or occupied promoters with no TATA. In plots (A–C) the gray points in the background are pooled from all libraries. The values for mean and noise are provided as Supplemental Data. (D) Burst size for different promoters. The burst size was estimated by fitting the data to η2 = b/m + ηext2 (Methods), and normalized to the lowest burst size (RPT2). Promoters are ordered based on increase in burst size and colored based on nucleosome occupancy (OPN/DPN) and existence of TATA box.
For each promoter, we estimated the burst size b and extrinsic noise ηext, using linear regression (Methods; Supplemental Table S3). For most promoters, our estimates of ηext were distributed around values that were reported previously for yeast (ηext ∼ 0.13). The estimated burst size b largely varied, with each promoter defining a unique curve. Most of our DPN-type promoters traced a similar low-noise line, consistent with a low burst size (Fig. 2A,D). In contrast, each of the OPN-type TATA-containing promoters generated its own specific curve, consistent with a high burst size (Fig. 2B,D). Promoters with OPN architecture but without a TATA box, or promoters that had intermediate levels of nucleosome signal near the TSS, usually appeared on curves with intermediate noise levels (Fig. 2C). The difference in the estimated burst size of the OPN versus DPN groups was significant (P = 0.02; t-test) and resulted mostly from the high estimated burst size of the TATA-containing promoters.
Mutations that deviate from the noise–mean scaling eliminate a TATA box or introduce an out-of-frame ATG
We searched for mutations that decouple the change in noise from that of mean expression. Such mutations are of particular interest because they may allow selection for high or low noise. For each promoter we calculated its best-fit curve (which in the majority of cases corresponded to η2 = b/m + ηext2), and examined all variants that deviated from the curve beyond a stringent threshold (see Methods). Only a small fraction of such variants were identified (Table 1), and most of them tended to reduce noise to a greater extent than predicted given their mean, implying a reduction in burst size (35 deviated downward vs. 10 upward, Table 1; see Supplemental Fig. S2A for other thresholds). Thus, random point mutations resulting in a large change in the noise versus mean relation are rare, and typically act to reduce the relative burst size.
Mutants that deviated substantially from the scaling curve
Significant deviations from the scaling curve were found mostly in three promoters (HXT2 in Fig. 3A, GPD1 and HSP150 in Supplemental Fig. S3). These three promoters are of the OPN type, contain a TATA box, and have the highest estimated burst size (Figs. 1A, 2D; Supplemental Table S1). To identify the mutations leading to the shift in the noise–mean relationship, we sequenced all of these variants. Notably, we find that they typically contain one of two mutation types: elimination of the TATA box or addition of an out-of-frame ATG start codon (Table 1). In the latter case, the upstream ATG probably reduces burst size via nonproductive translation, although some YFP is generated from the original ATG due to “slippage” in translation initiation or reinitiation (Meijer and Thomas 2002; Sachs and Geballe 2006). The upstream ATG may also lower transcript levels (Yun et al. 2012). The two types of mutations, TATA and upstream ATGs, also appeared in deviating variants from other promoters (Table 1).
Mutations that deviate from the noise–mean scaling. (A) Noise versus mean expression of mutants of the HXT2 library. (Green) Mutants that deviate from the noise–mean scaling and were sequenced. Those that had a mutated TATA are denoted by T. (B) Mutations that eliminate the TATA box or introduce an unproductive ATG reduce burst size. Mutations were directed into the HXT2 promoter to eliminate the TATA box (squares: red, TATgAAAA; green, TATAgAAA; cyan, TATAAAcA; purple, TAcAAAAA) or to introduce an out-of-frame ATG in different positions (triangles: red, 13; blue, 34; green, 23). (Inset) Single-cell distributions of expression from two mutants of similar expression but different noise (marked by 1 and 2 in the figure). (C) TATA box mutations modify the scaling law. The three TATA mutants shown in B were subjected to further random mutagenesis and the resulting mutants are shown. Color code as in B. (Error bars) Standard error of three biological repeats. Similar analysis is presented for GPD1 and HSP150 in Supplemental Figure S3.
We observed a few variants that deviated from the scaling curve although their sequence did not identify a consistent mutation pattern (a pattern was not identified possibly due to their low numbers, Table 1). Importantly, the magnitude of their deviation was generally lower than in the TATA and upstream ATG mutants of the high-noise promoters (Supplemental Fig. S2B). We conclude that most mutations that strongly modify the noise–mean scaling in our data set eliminated a TATA box or produced an out-of-frame ATG.
The effect of the TATA box depends on promoter context
The observation that mutations in the TATA box reduce the estimated burst size (noise relative to mean expression) is consistent with previous studies (Raser and O'Shea 2004; Blake et al. 2006; Murphy et al. 2010). Yet, in addition to the three high-noise promoters where variants deviating from the noise–mean relationship were easily identifiable, our data set included additional promoters that contained a TATA sequence (a conserved TATA sequence in HXT3, RNR2, ERG11, and HSC82; unconserved TATA in ADH3 and DUT1). In neither of those promoters did we identify a mutation leading to a significant change in burst size. In order to detect more TATA mutations even if they do not have an effect on burst size, we sequenced >75 randomly selected colonies from 20 of our 22 libraries (details in Supplemental Table S2 and Supplemental Data; ERG11 was not sequenced and HSC82 is discussed in a separate section). Consistent with the above, for the three high-noise promoters HXT2, GPD1, and HSP150, nearly all TATA mutations significantly reduced burst size (9/10, P = 3 × 10⁻¹¹) (Table 2), with only one TATA box mutant retaining the scaling behavior (TATAAgAG in HSP150).
Behavior of TATA mutants and new ATG mutants discovered by extensive unbiased sequencing
Interestingly, for the other promoters, mutations that eliminated the TATA did not lead to a significant reduction in burst size (Table 2). Therefore, in those promoters the TATA box is not likely to influence burst size. We conclude that the effect of the TATA box on the estimated burst size depends on the promoter context. A compelling hypothesis is that the TATA box interacts with nucleosomes, as the three high-noise promoters (HXT2, GPD1, and HSP150) in which TATA had a distinctive effect on the estimated burst size are all characterized by a high OPN measure, defined by the ratio of nucleosome signal proximal to the TSS and further upstream (Fig. 1A; Supplemental Table S1).
We repeated this analysis for mutants with a new out-of-frame ATG, but due to low numbers it was difficult to reach significant conclusions (Table 2). However, we do expect this type of mutation to be context-dependent (Meijer and Thomas 2002; Sachs and Geballe 2006).
TATA mutations or out-of-frame ATGs are sufficient to reduce burst size in the high-noise promoters
To verify that the decrease in estimated burst size of the three high-noise promoters was due to the mutations in the TATA box and not to other mutations present in the same promoters, we mutated the TATA box consensus sequence at four different bases in the three high-noise promoters. We further generated out-of-frame ATG codons at different positions to verify the consequence of generating such out-of-frame translation start sites (Supplemental Table S4). As expected, all these mutants decreased expression. The noise levels of these mutants was lower than the curve formed by most other mutants, signifying a change in expression due to decreased burst size (HXT2 in Fig. 3B; GPD1 and HSP150 in Supplemental Fig. S3). We next subjected the TATA-mutated promoters to further PCR-dependent random mutagenesis, generating three libraries of hundreds of mutated variants each. Notably, those variants all fell on a new noise–mean scaling curve that was lower (reduced b) compared with the wild-type curve (HXT2 in Fig. 3C; GPD1 and HSP150 in Supplemental Fig. S3). These results suggest that the effect of TATA mutations in reducing burst size of the three high-noise promoters is independent of other mutations.
Unique effect of TATA box mutations on the response to environmental stress
Our results suggest that maintaining high expression noise requires an intact TATA box. The TATA box was also implicated in high responsiveness to environmental perturbations (Basehoar et al. 2004; Choi and Kim 2008, 2009; Tirosh and Barkai 2008; Lehner 2010). To examine whether eliminating the TATA box modulates the responsiveness to environmental changes, we measured the fold change in expression of different TATA mutant promoters following different environmental perturbations (Methods). As mutating the TATA box reduced the basal expression level, we selected, as control, mutants that changed expression to the same extent as the TATA mutations but were maintained on the scaling curve (thereby having a significantly higher noise level). The sequences of these promoter mutants are provided as Supplemental Data.
Figure 4 presents the fold response of GPD1 and HXT2 promoter mutants across different conditions (11 and two conditions, respectively). We observe a striking difference in the behavior of promoters with TATA box mutations versus those with control mutations. The fold response of TATA-mutated promoters was similar to that of the original promoter, regardless of the effect that the mutation had on basal expression level. In contrast, the response of the control mutants strongly increased with decreasing basal expression. We quantified the dependence between the (log−) fold response and the (log−) basal expression level through linear regression, and compared the resulting slopes of the TATA mutants and control mutants via ANCOVA (values for slopes are provided in Supplemental Table S5, and values for the fold response of each promoter are provided as Supplemental Data). We found a significant difference in the slopes between the TATA mutant group and the control, under most conditions. The combined P-values (Fisher's method) over all conditions for GPD1 was <10−16 and 0.036 for HXT2. Thus, in the tested promoters, the effect of TATA mutations on the responsiveness of expression is distinct from that of other mutations.
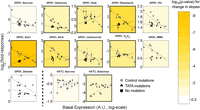
The responsiveness of promoter mutants to environmental perturbations. The fold change in expression of GPD1 and HXT2 promoter mutants to different conditions, plotted against the basal expression level. (Black triangles) TATA mutants; (gray circles) control mutations; (black square) the original promoter (see Supplemental Table S4 and other Supplemental Data for details on mutants). (Dotted lines) Linear regression curves. The background of each figure is a color-coded scale for the significance of the difference between the regressed slopes of the TATA mutants and control mutants (based on ANCOVA). The figure is outlined if the P-value is <0.05. The conditions for GPD1, from left to right: sucrose, galactose, heat shock, rapamycin, hydroxyurea, NaCl, Antimycin A, Clotrimazole, H2O2, MMS, and diamide. For HXT2: sucrose and galactose (see Supplemental Methods for details on conditions). Note that for HXT2 the observed response is a decrease in expression. Values for slopes are provided in Supplemental Table S5, and values for the fold response of each promoter are provided as Supplemental Data.
Interestingly, the dependence of the fold response of promoter mutants on basal expression level, and the deviation of the TATA mutants from this behavior, resemble the scaling behavior of noise versus mean expression. Indeed, the average fold change over all conditions is correlated to the noise levels (Supplemental Fig. S4). This result, although for two promoters only, highlights another aspect of the relationship between noise and responsiveness (Kaneko 2007; Tirosh and Barkai 2008; Choi and Kim 2009; Lehner 2010).
A previous study on synthetic promoters showed that the TATA contributes to a constant fold change in expression, regardless of cis-regulatory site identity and arrangement (Mogno et al. 2010). Because changes in environmental conditions are probably reflected in the binding of transcription factors to the promoter, our results, together with the previous study, support a unique role for TATA in defining gene expression level, independently of other interactions on the promoter.
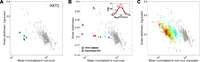
HSC82 promoter: Two branches in the noise–mean plane
The HSC82 promoter presents an interesting exception to the general scaling behavior we described. This promoter is unique as it has a TATA box, characteristic of high-noise promoters, although its nucleosome arrangement is of intermediate nature and closer to that of the DPN architecture that characterizes low-noise promoters (Fig. 5A; Erkine et al. 1995a,b, 1996). The combination of a DPN promoter with a conserved TATA box is rare, observed in only ∼30 yeast promoters (∼0.5%). The depletion of nucleosomes in the HSC82 promoter likely results from binding of Reb1, a nucleosome-evicting factor (Erkine et al. 1995a,b, 1996). Expression of the wild-type HSC82 promoter was high and of a rather low noise (Fig. 1A; Supplemental Table S1). Most HSC82 promoter variants had only a minor effect on the mean abundance or noise level. Yet, a small fraction of mutations strongly reduced expression, forming two branches on the mean–noise plane: one of low noise and one of high noise (Fig. 5B).
Unique behavior of the HSC82 promoter mutants. (A) Nucleosome occupancy profile of HSC82 promoter: note the pronounced NFR. (B) Noise versus mean expression of mutants of the HSC82 library. Mutants form two branches on the noise–mean plane. Mutants from the upper and lower branch were sequenced (blue and green, respectively). (R) Mutation in Reb1 binding; (T) mutation in the TATA box; (H) mutation in the HSF1 binding site. (Error bars) Standard error of three biological repeats.
Sequencing revealed that all mutations in the low-noise branch targeted either the TATA box or the binding site for HSF1, a transcription factor known to regulate HSC82. In contrast, all mutations in the high-noise branch targeted the Reb1 biding site. Thus, Reb1 binding to the HSC82 promoter contributes to expression levels but reduces expression noise.
Discussion
Gene expression is encoded in the gene promoter sequence. Understanding how promoter sequence mutations influence gene expression is therefore of obvious interest. Most studies, however, characterize promoter mutations by measuring mean expression only (e.g., Yun et al. 2012), and therefore do not distinguish between mutations affecting burst frequency versus those that modulate burst size. In this study, we relied on the theoretical idea of using gene expression noise to distinguish between those two processes in order to examine the sensitivity of burst size and burst frequency to mutations in promoter sequence. Our main finding is that each promoter has a characteristic burst size that is largely insensitive to most promoter mutations. This burst size is small in DPN-type promoters and high in OPN-type, TATA-containing promoters. In the latter promoter class, but not in the former, high burst size was strongly dependent on a functional TATA box.
Our results were consistent amongst 21 of the 22 yeast promoters tested. Those promoters were chosen to span a wide range of expression values and noise levels. Their promoter sequences also differed in terms of both nucleosome organizations (DPN vs. OPN types) and the presence of a TATA box. The associated gene functions were diverse, with no significant enrichment to any particular functional category. Therefore, the scaling behavior we observe is likely to be a general property of yeast promoters.
Interestingly, all mutations causing large changes in burst size were mapped to just two types of mutations: elimination of a TATA box or out-of-frame ATG sequences. Hence, the presence or absence of a TATA box plays a major role in defining burst size, consistent with previous reports (Raser and O'Shea 2004; Blake et al. 2006; Murphy et al. 2010). Yet, having a TATA box is not necessary and sufficient for high burst size, because high burst size promoters can be TATA-less, and TATA-containing promoters can still have low burst size (see also ERG6 and ERG11 in our data set). Further, mutations in the TATA box did not reduce burst size in promoters of the DPN architecture. Together, we consider that burst size is determined by the interaction between TATA box and other properties such as the pattern of nucleosome occupancy.
Our study focused on mutations in promoter sequence. Such cis-mutations play an important role in the evolution of gene expression between related species. Still, they represent only one class of all possible mutations. It would therefore be interesting to extend the analysis to trans-mutations (Raser and O'Shea 2004; Rinott et al. 2011), as well as consider other mutational mechanisms such as recombination.
Despite this limitation, it is tempting to speculate on the implications of our study for the evolution of gene expression noise. It is widely assumed that noise in gene expression is the result of purifying evolutionary (Batada and Hurst 2007; Lehner 2008; Wang and Zhang 2011) or positive selection (Kussell and Leibler 2005; Blake et al. 2006; Acar et al. 2008; Çağatay et al. 2009; Zhang et al. 2009). In our data set that included a large number of mutations, we observed a clear bias: Very few mutations increased burst size (higher noise beyond the expected dependency on the mean), compared with mutations that decreased it. This may suggest that low burst size promoters are stable against random cis-mutations and that selection is required to protect high burst size promoters (specifically TATA-containing promoters) from becoming low burst size ones. That selection indeed acts to maintain the TATA box in promoters is best indicated by the conservation of TATA box between species (Basehoar et al. 2004).
Clearly, such selection may not act directly on noise, but could be a byproduct of selection for other features (Kaneko 2007; Lehner 2010; Tawfik 2010). For example, as suggested by our results, the TATA box may have a role in increasing expression level while maintaining the fold response to perturbations. Furthermore, selection might act to remove alternative ATGs because they reduce translational efficiency and produce undesirable polypeptides. Nevertheless, it remains an intriguing possibility that, at least under certain circumstances, selection for high noise may act directly to shape the structure of gene promoters.
Methods
Generation of mutant libraries
Promoter fragments (400 bp from ATG) were cloned from the yeast genome and subjected to random mutagenesis using the GeneMorph II Random Mutagenesis kit (Stratagene). PCR fragments were cloned into a specifically designed plasmid. The plasmid contained a selection marker and sequences that are homologous to genomic regions in a yeast strain with an integrated YFP. Plasmid was linearized and transformed into the yeast. Single colonies were collected and kept for further analysis. Details of plasmids, yeast strains, PCR, and cloning procedure are found in the Supplemental Material.
Measurements of expression and noise using flow cytometry
Full details of measurement procedure are given in the Supplemental Material. Briefly, yeast libraries were replicated into 150 μL YPD in U-bottom 96-well plates and grown overnight at 30°C. Saturated cultures were resuspended and diluted ∼1:150 into prewarmed 96-well plates with 130–150 μL SC-HIS media. Diluted cells were grown for ∼5.5–7 h, at 30°C with vigorous shaking, and fluorescence was measured by flow cytometery on the BD LSRII system (BD Biosciences) with a High Throughput Sampler extension (HTS). Excitation wavelength was 488 nm and emission was collected via 525/50 filter.
Expression and noise were calculated based on the measured fluorescence distributions. To minimize effects of cell size and cell cycle on the measured noise, we used two procedures: First we took for our analysis only a subpopulation of cells which had low forward and side scatter values, and is enriched in G1 cells. Second, we used linear regression to correct the variation in fluorescence for effects of cell size. Exact details of analysis procedures and other normalization procedures are provided in the Supplemental Material. Raw results are provided as Supplemental Data.
Fitting a curve to the noise–mean data and defining deviating mutants
We fitted the following three models to the noise versus mean curves of our promoters:

The fitting was performed using iteratively reweighted least squares with a bisquare weighting function, implemented in Matlab's
robustfit function with default parameters. In order to avoid fitting artifacts from points that do not change expression
level, values of mean expression with  were averaged into 200 equally spaced bins.
The results of the fit are presented in Supplemental Table S3 and Supplemental Figure S1. Models number 2 and 3 outperformed the simple model 1. In two cases, HXT3 and PFY1, model 3 was better than model 2 (P-value < 0.01 based on F-test for the sum of squared residuals; Jaqaman and Danuser 2006).
To define the colonies that deviate from the curve we used the best-fit curve (model 2 or 3) and calculated the log ratio of the predicted noise based on the curve and the measured noise. Table 1 presents colonies that deviated from an abs(log-ratio) of 0.263, corresponding to a statistically significant deviation with a P-value of 0.05 after a Bonferroni correction. Different thresholds are presented in Supplemental Figure S2.
Testing high-noise variants using colony isolation
We ascertained that yeast colonies which display higher-than-expected noise levels are not in fact composed of a mixture of two colonies. Such yeast colonies were streaked and single colonies were collected. The fluorescence of the single colonies was measured together with the original colony, to see if there are changes in the expression level and/or decrease in noise.
Conditions used to perturb gene expression
The conditions used to perturb gene expression were rapamycin, sodium chloride, hydrogen peroxide, antimycin A, MMS, diamide, hydroxy-urea, clotrimazole, 37°C heat shock, and two carbon sources: galactose or sucrose. Exact concentrations and procedures are given in the Supplemental Material.
Nucleosome occupancy ratio
The nucleosome occupancy ratio is the nucleosome signal proximal to the transcription start site relative to signal further upstream. Values shown here are mean from two studies (Tirosh and Barkai 2008; Tsui et al. 2011) that were based on different nucleosome occupancy data and slightly different definitions for proximity. Each data set was normalized to have mean 0 and standard deviation 1 before averaging.
Acknowledgments
We thank Einat Dayan for technical assistance. We thank the lab of Eran Segal for yeast strain and protocols. Furthermore, we thank Itay Tirosh, Ilya Soifer, and all of our lab members for helpful discussions. G.H would like to express his gratitude to N. Broudo-Hornung for support and understanding. This work was supported by the NIH (P50GM068763), the ERC, and the Hellen and Martin Kimmel Award for Innovative Investigations.
Footnotes
-
↵4 Corresponding author
E-mail Naama.barkai{at}weizmann.ac.il
-
[Supplemental material is available for this article.]
-
Article published online before print. Article, supplemental material, and publication date are at http://www.genome.org/cgi/doi/10.1101/gr.139378.112.
Freely available online through the Genome Research Open Access option.
- Received February 19, 2012.
- Accepted July 5, 2012.
This article is distributed exclusively by Cold Spring Harbor Laboratory Press for the first six months after the full-issue publication date (see http://genome.cshlp.org/site/misc/terms.xhtml). After six months, it is available under a Creative Commons License (Attribution-NonCommercial 3.0 Unported License), as described at http://creativecommons.org/licenses/by-nc/3.0/.


