
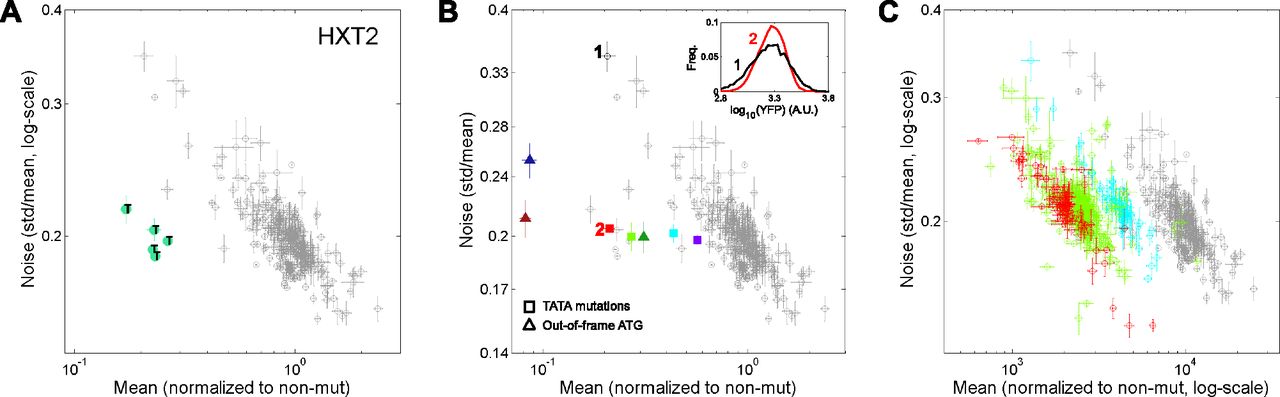
Mutations that deviate from the noise–mean scaling. (A) Noise versus mean expression of mutants of the HXT2 library. (Green) Mutants that deviate from the noise–mean scaling and were sequenced. Those that had a mutated TATA are denoted by T. (B) Mutations that eliminate the TATA box or introduce an unproductive ATG reduce burst size. Mutations were directed into the HXT2 promoter to eliminate the TATA box (squares: red, TATgAAAA; green, TATAgAAA; cyan, TATAAAcA; purple, TAcAAAAA) or to introduce an out-of-frame ATG in different positions (triangles: red, 13; blue, 34; green, 23). (Inset) Single-cell distributions of expression from two mutants of similar expression but different noise (marked by 1 and 2 in the figure). (C) TATA box mutations modify the scaling law. The three TATA mutants shown in B were subjected to further random mutagenesis and the resulting mutants are shown. Color code as in B. (Error bars) Standard error of three biological repeats. Similar analysis is presented for GPD1 and HSP150 in Supplemental Figure S3.


