
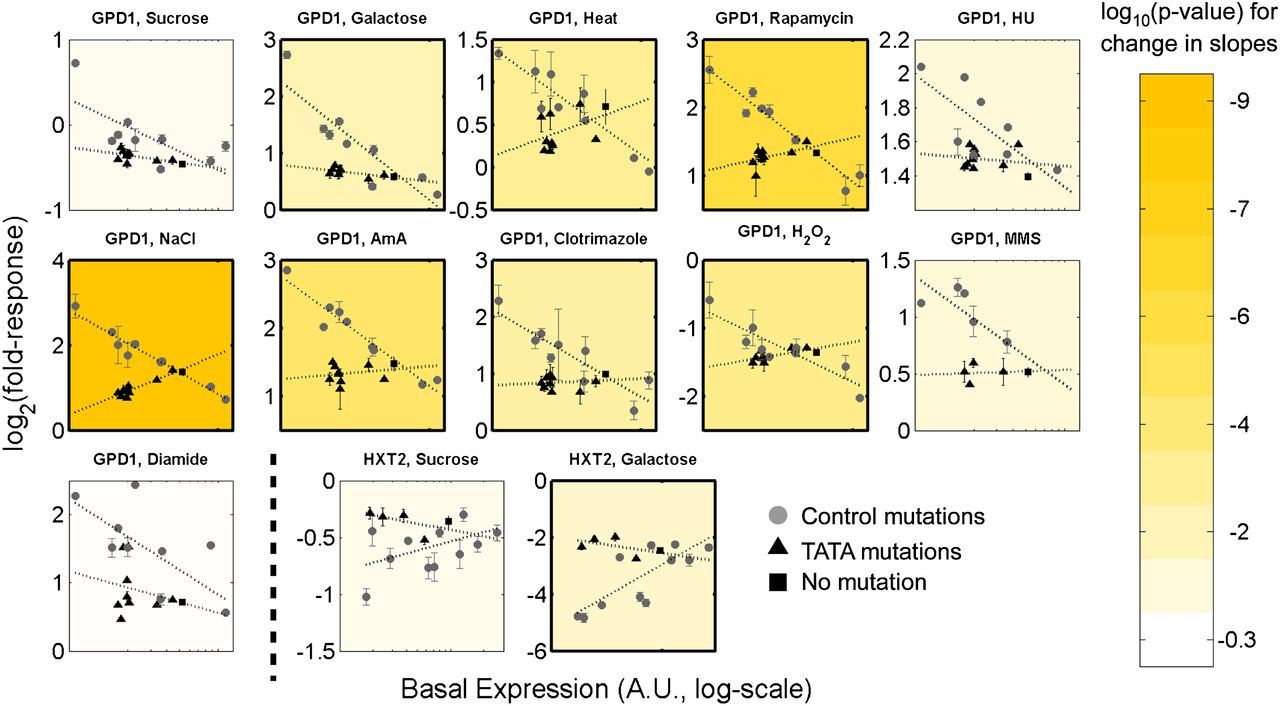
The responsiveness of promoter mutants to environmental perturbations. The fold change in expression of GPD1 and HXT2 promoter mutants to different conditions, plotted against the basal expression level. (Black triangles) TATA mutants; (gray circles) control mutations; (black square) the original promoter (see Supplemental Table S4 and other Supplemental Data for details on mutants). (Dotted lines) Linear regression curves. The background of each figure is a color-coded scale for the significance of the difference between the regressed slopes of the TATA mutants and control mutants (based on ANCOVA). The figure is outlined if the P-value is <0.05. The conditions for GPD1, from left to right: sucrose, galactose, heat shock, rapamycin, hydroxyurea, NaCl, Antimycin A, Clotrimazole, H2O2, MMS, and diamide. For HXT2: sucrose and galactose (see Supplemental Methods for details on conditions). Note that for HXT2 the observed response is a decrease in expression. Values for slopes are provided in Supplemental Table S5, and values for the fold response of each promoter are provided as Supplemental Data.


