
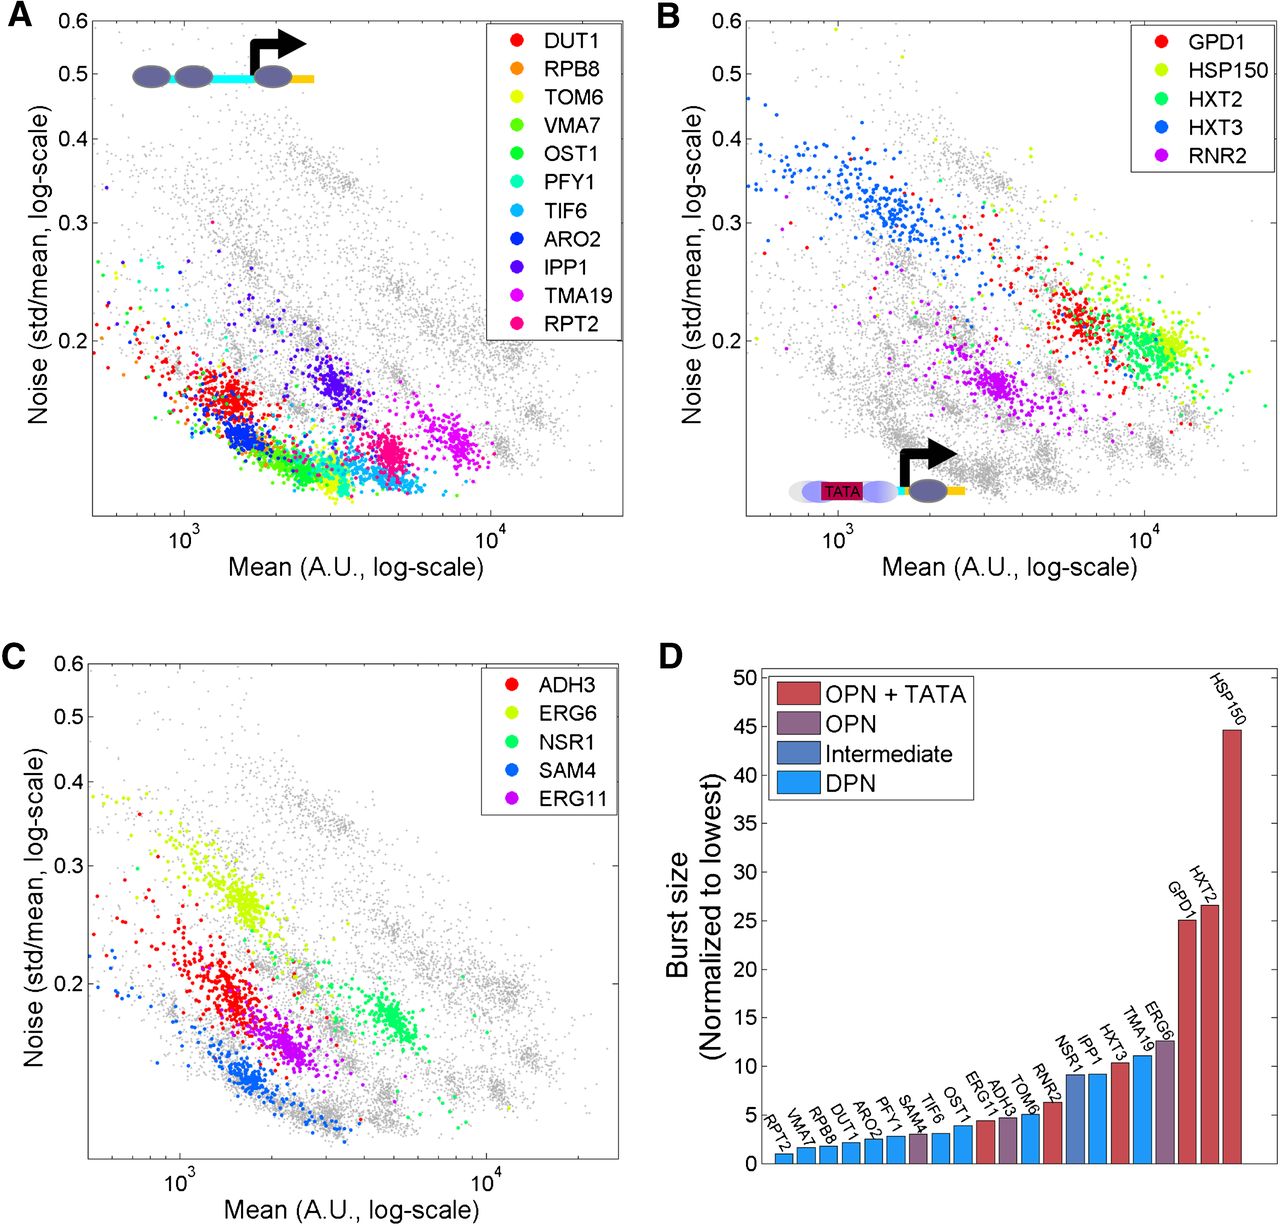
Scaling of noise with mean abundance. (A) Noise properties of NFR-containing, TATA-less promoters. Noise versus mean expression is shown for 11 promoters with a clear NFR and no TATA box. Different colors correspond to different promoters, as described. (B) Noise properties of TATA-containing promoters without NFR. Same as A for promoters that lack NFR and that contain a TATA box. (C) Noise properties of “intermediate” promoters. Same as A for promoters with intermediate nucleosome occupancy or occupied promoters with no TATA. In plots (A–C) the gray points in the background are pooled from all libraries. The values for mean and noise are provided as Supplemental Data. (D) Burst size for different promoters. The burst size was estimated by fitting the data to η2 = b/m + ηext2 (Methods), and normalized to the lowest burst size (RPT2). Promoters are ordered based on increase in burst size and colored based on nucleosome occupancy (OPN/DPN) and existence of TATA box.


