
A heterozygous IDH1R132H/WT mutation induces genome-wide alterations in DNA methylation
- Christopher G. Duncan1,6,
- Benjamin G. Barwick2,6,
- Genglin Jin1,
- Carlo Rago3,
- Priya Kapoor-Vazirani4,
- Doris R. Powell4,
- Jen-Tsan Chi5,
- Darell D. Bigner1,
- Paula M. Vertino4,7 and
- Hai Yan1,7
- 1The Preston Robert Tisch Brain Tumor Center, The Pediatric Brain Tumor Foundation Institute, The Department of Pathology, Duke University Medical Center, Durham, North Carolina 27710, USA;
- 2Graduate Program in Genetics and Molecular Biology, Emory University, Atlanta, Georgia 30322, USA;
- 3The Ludwig Center for Cancer Genetics and Therapeutics and Howard Hughes Medical Institute, Johns Hopkins Kimmel Cancer Center, Baltimore, Maryland 21231, USA;
- 4Department of Radiation Oncology and The Winship Cancer Institute, Emory University, Atlanta, Georgia 30322, USA;
- 5Duke Institute for Genome Sciences and Policy and Department of Molecular Genetics and Microbiology, Duke University Medical Center, Durham, North Carolina 27708, USA
-
↵6 These authors contributed equally to this work.
Abstract
Monoallelic point mutations of the NADP+-dependent isocitrate dehydrogenases IDH1 and IDH2 occur frequently in gliomas, acute myeloid leukemias, and chondromas, and display robust association with specific DNA hypermethylation signatures. Here we show that heterozygous expression of the IDH1R132H allele is sufficient to induce the genome-wide alterations in DNA methylation characteristic of these tumors. Using a gene-targeting approach, we knocked-in a single copy of the most frequently observed IDH1 mutation, R132H, into a human cancer cell line and profiled changes in DNA methylation at over 27,000 CpG dinucleotides relative to wild-type parental cells. We find that IDH1R132H/WT mutation induces widespread alterations in DNA methylation, including hypermethylation of 2010 and hypomethylation of 842 CpG loci. We demonstrate that many of these alterations are consistent with those observed in IDH1-mutant and G-CIMP+ primary gliomas and can segregate IDH wild-type and mutated tumors as well as those exhibiting the G-CIMP phenotype in unsupervised analysis of two primary glioma cohorts. Further, we show that the direction of IDH1R132H/WT-mediated DNA methylation change is largely dependent upon preexisting DNA methylation levels, resulting in depletion of moderately methylated loci. Additionally, whereas the levels of multiple histone H3 and H4 methylation modifications were globally increased, consistent with broad inhibition of histone demethylation, hypermethylation at H3K9 in particular accompanied locus-specific DNA hypermethylation at several genes down-regulated in IDH1R132H/WT knock-in cells. These data provide insight on epigenetic alterations induced by IDH1 mutations and support a causal role for IDH1R132H/WT mutants in driving epigenetic instability in human cancer cells.
Mutations of the NADP+-dependent isocitrate dehydrogenase (IDH) genes IDH1 and IDH2 occur in >70% of Grade II–III gliomas and secondary glioblastomas (sGBM) (Balss et al. 2008; Parsons et al. 2008; Bleeker et al. 2009; Hartmann et al. 2009; Yan et al. 2009a,b; Gravendeel et al. 2010), 15%–30% of acute myeloid leukemias (AMLs) (Mardis et al. 2009; Marcucci et al. 2010; Paschka et al. 2010; Wagner et al. 2010; Ward et al. 2010), 56% of chondrosarcomas (Amary et al. 2011), 87% of enchondromas, 70% of spindle cell hemangiomas (Pansuriya et al. 2011), 22%–28% of cholangiocarcinomas of intrahepatic origin (Borger et al. 2012; Kipp et al. 2012), and at lower frequencies in other malignancies, including colorectal cancer (Sjoblom et al. 2006), prostate carcinoma, and B-acute lymphoblastic leukemia (B-ALL) (Kang et al. 2009). IDH mutations occur early in tumor development and may either cause or predispose cells to become malignant (Ichimura et al. 2009; Watanabe et al. 2009). In human tumors, IDH mutations give rise to single amino acid substitutions at specific conserved residues, arginine 132 (R132) of IDH1 and arginine 140 (R140) or arginine 172 (R172) of IDH2. These IDH point mutations primarily occur as somatically acquired heterozygous events, with tumor cells showing one mutant allele and retention of the second wild-type allele, suggesting that the ratio of mutant to wild-type enzyme may be critical to its oncogenic activity. The IDH mutation leads to an attenuation of the normal catalytic activity, the oxidative decarboxylation of isocitrate to alpha-ketoglutarate (α-KG) (Yan et al. 2009b; Zhao et al. 2009), while concurrently imparting a gain of novel enzymatic function wherein α-KG is reduced, leading to the aberrant accumulation of the onco-metabolite D-2-hydroxyglutarate (D-2-HG) (Dang et al. 2009). Both reduction of cellular α-KG levels and accumulation of D-2-HG have the potential to contribute to altered cellular phenotypes through the inhibition of multiple Fe(II)/2-oxoglutarate-dependent dioxygenases (W Xu et al. 2011), a superfamily of enzymes involved in a wide range of biological functions, including DNA repair and chromatin modification, such as the AlkB family of oxidative demethylases, the Jumonji-C domain family of histone demethylases (JHDMs), and the TET family of methylcytosine hydroxylases (Loenarz and Schofield 2008; Tahiliani et al. 2009; Figueroa et al. 2010a; Chowdhury et al. 2011).
Recent large-scale studies of DNA methylation distribution in primary tumors have identified biologically distinct subgroups of glioblastomas (GBMs) and AMLs associated with aberrant DNA methylation (Figueroa et al. 2010b; Noushmehr et al. 2010). A subset of primary GBMs exhibit the “CpG island methylator phenotype” (CIMP) and show concordant hypermethylation of a large number of CpG islands (Toyota and Issa 1999; Toyota et al. 1999; Noushmehr et al. 2010). Interestingly, in gliomas, the CIMP phenotype (termed G-CIMP) has a striking association with IDH1 mutation (Noushmehr et al. 2010; Christensen et al. 2011; Laffaire et al. 2011; Turcan et al. 2012). Similarly, IDH1 and IDH2 mutations robustly associate with specific global DNA hypermethylation phenotypes in AMLs (Figueroa et al. 2010a), enchondromas (Pansuriya et al. 2011), and low-grade gliomas (LGGs) (Turcan et al. 2012). The evidence linking IDH1 and IDH2 mutations with distinct DNA methylation phenotypes in primary human tumors raises the question of whether these mutations can drive oncogenesis through epigenetic reprogramming of cancer cells. Such epigenetic changes, including DNA hypermethylation and hypomethylation, can play fundamental roles in the initiation and progression of human cancer through regulation of gene expression (Jones and Baylin 2002, 2007). In addition to epigenetic classifications, gene expression-based molecular classification systems have been developed in GBM to distinguish clinically relevant molecular subclasses (Phillips et al. 2006; Li et al. 2009; Verhaak et al. 2010). GBMs with IDH1 mutations were shown to primarily exhibit a proneural gene expression signature (Verhaak et al. 2010), although specific gene-expression alterations resulting from mutant IDH1 proteins have not been elucidated.
Despite the apparent correlation between IDH mutations and CpG island hypermethylation, the contribution of heterozygous expression of IDH1 point mutations to this phenotype has not been addressed. One limitation of the field has been the lack of model systems that recapitulate naturally occurring monoallelic point mutations observed in human tumors. Previous studies have relied on ectopic overexpression in human and mouse cell lines to study the effects of mutant IDH proteins (Dang et al. 2009; Yan et al. 2009b; Figueroa et al. 2010a; Ward et al. 2010; G Jin et al. 2011; Reitman et al. 2011; Lu et al. 2012; Turcan et al. 2012). To address this issue, and to faithfully recapitulate the naturally occurring genetic alterations, we utilized gene targeting to introduce heterozygous IDH1R132H/WT substitutions in the human colorectal cancer cell line, HCT116. We determined the impact of this mutation on the genome-wide distribution of CpG methylation in the isogenic IDH1R132H/WT cells and identified differentially methylated CpGs induced by the IDH1R132H/WT mutation, which include both hyper- and hypomethylation events. Our data indicate that IDH1R132H/WT mutations play a causal role in the widespread alteration of DNA and histone methylation observed in human cancers and can impact gene expression.
Results
Targeted knock-in of IDH1R132H/WT hotspot mutation in a human cancer cell line
To analyze the epigenetic effects of heterozygous IDH1R132H/WT point mutations, we established isogenic cell lines in which one wild-type allele of this gene was replaced with the IDH1R132H allele. HCT116 was selected for IDH1R132H/WT knock-in because the cell line is diploid at the IDH1 locus and is susceptible to gene targeting through homologous recombination (Shirasawa et al. 1993; Waldman et al. 1995). Additionally, HCT116 cells have the intact machinery to exhibit physiologically relevant methylation patterns and have been utilized to examine DNA methylation phenotypes resulting from genetic ablation of DNA methyltransferases (DNMTs) (Rhee et al. 2000, 2002). We utilized gene targeting by homologous recombination with recombinant adeno-associated virus (rAAV) constructs (Kohli et al. 2004; Topaloglu et al. 2005; Rago et al. 2007) to replace one IDH1 allele with an IDH1R132H allele in the HCT116 cell line (Fig. 1A). Clones that underwent homologous recombination at the IDH1 locus were verified using a PCR-based approach (Supplemental Fig. 1A). Cre-mediated excision of the selection cassette was confirmed by both PCR-based and functional assays (Supplemental Fig. 1B). Two independent clones were obtained for further detailed analysis, IDH1R132H/WT knock-in 1 (KI-1) and IDH1R132H/WT knock-in 2 (KI-2). Resulting clones were sequenced to confirm the presence of the heterozygous G>A IDH1 mutation (Fig. 1B). We also sequenced the cDNA from each knock-in clone to confirm equal expression of the wild-type (R132) and mutant (H132) alleles (Fig. 1B). Quantification of intracellular D-2-HG showed that the levels of D-2-HG were more than 100-fold higher in clarified cell lysates from the knock-in clones KI-1 (P = 0.023) and KI-2 (P = 0.020) as compared with parental cells, confirming neomorphic IDH1R132H enzymatic activity (Fig. 1C). Additionally, IDH1R132H/WT knock-in cells readily excrete D-2-HG to their surrounding environment, as concentrations of D-2-HG in the cell culture media from both KI-1 (P < 0.01) and KI-2 (P < 0.01) were more than 100-fold higher than that in culture media from parental cells (Fig. 1D).
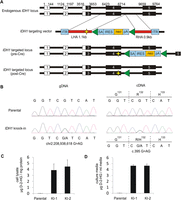
Targeted knock-in of IDH1R132H/WT hotspot mutation in a human cancer cell line. (A) To faithfully recapitulate expression of heterozygous IDH1R132H/WT mutations as observed in human tumors, a targeting vector was designed to introduce the IDH1R132H mutation in one endogenous allele of IDH1 in HCT116. Relative genomic positions of exons are indicated, including 5′ UTR (white boxes) and coding sequences (black boxes). Homology arms (HAs) were cloned from HCT116 parental cells and are shown in red. The left HA (LHA) was altered by site-directed mutagenesis to create the IDH1R132H mutation (indicated by yellow star). The homology arms flank a synthetic exon promoter trap (SEPT) cassette. The promoterless SEPT element contains a splice acceptor (SA), internal ribosomal entry sequence (IRES), neomycin selectable marker (neo), and polyadenylation site (pA), which are flanked by loxP sites (green triangles). Inverted terminal repeats (ITR) of the adeno-associated virus (AAV) vector flank the homology arms. Correctly targeted alleles result in incorporation of the SEPT cassette along with the R132H mutation. Targeted clones were infected with Cre adenovirus to excise the selectable element, generating a clone that differs from the parental cell line by the single base pair mutation in exon 4 and 34-bp loxP scar in the adjacent intron. (B) Sequencing validation of IDH1R132H/WT knock-in clones. Representative sequencing chromatograms for IDH1 codons 131–133 in genomic DNA (left) and cDNA (right) of HCT116 parental cells (top) and IDH1 knock-in cells (bottom). Knock-in clones contain a heterozygous G>AG mutation at chr2:208,938,618 and are heterozygous for wild-type allele (CGT) and mutant allele (CAT) coding for an arginine (R) to histidine (H) change at amino acid 132. Measurement of D-2-hydroxyglutarate (D-2-HG) in (C) clarified cell lysate and (D) cell culture medium over cells, collected after 48 h incubation. Shown is the mean ±SD of triplicate measurements.
IDH1R132H/WT induces alterations in DNA methylation
We next examined the effects of IDH1R132H/WT on DNA methylation patterns using Infinium Methylation27 profiling (Illumina, Inc.). This platform uses a single nucleotide extension approach on bisulfite modified DNA to interrogate the methylation status of 27,578 CpG sites spanning 14,475 genes. The relative methylation levels are returned as a “β-value” (0 to 1) calculated from the ratio of signal intensity from the methylated probe to the total signal from both unmethylated and methylated probes for each CpG site, approximating the percent methylation. Two replicate samples of two clonal variants derived from each of the two independent knock-in clones, KI-1 and KI-2, were analyzed as compared with four wild-type IDH1 parental cell line replicates. Comparison of the relative methylation (β) distribution of all assayed CpG sites in KI-1, KI-2, and parental cells revealed a significant shift in the relative DNA methylation (β) density distribution upon IDH1R132H/WT knock-in (Fig. 2A). Most notably, IDH1R132H/WT knock-in cells showed an increased frequency of CpG sites with high levels of methylation (β ∼0.8–1.0). Unsupervised hierarchical cluster analysis showed that the wild-type and IDH1R132H/WT knock-in cells separate by genotype based on their overall methylation patterns (Supplemental Fig. 2A). Differential methylation analyses were performed comparing each of the two independent knock-in clones with the wild-type parental cells. These analyses yielded concordant results wherein the majority of differentially methylated loci associated with IDH1R132H/WT in either clone was common to the other, demonstrating a largely similar effect on methylation resulting from two independent recombination events (Supplemental Fig. 2B,C). We combined the data from all replicates of both knock-in clones and wild-type parental cells in a cumulative analysis and identified 2852 loci that were significantly differentially methylated between knock-in and wild-type cells (Fig. 2B). Of these, 2010 and 842 loci were significantly hyper- or hypomethylated, respectively, in the knock-in clones relative to wild-type cells (FDR < 0.01; Supplemental Fig. 2D; Supplemental Table 1). Gene ontology analysis of unique genes represented by the 2010 hypermethylated CpG sites showed enrichment of functional categories surrounding intracellular signaling and response to extracellular stimuli (Supplemental Table 2). Similar ontologies were also found to be significantly enriched among CpG loci previously published as hypermethylated in G-CIMP positive (G-CIMP+) GBMs (Noushmehr et al. 2010) and LGGs (Turcan et al. 2012). Conversely, hypomethylated loci showed over-representation of nucleotide metabolism and differentiation (Supplemental Table 3). Interestingly, an examination of the relative methylation distribution of the 2010 hypermethylated and 842 hypomethylated loci showed a depletion of moderately methylated loci (i.e., probes with β ∼0.2–0.7 in wild-type cells) and a corresponding shift toward greater or lesser methylation levels in the knock-in cells (Fig. 2C). Indeed, loci that became hypermethylated in the IDH1R132H/WT knock-ins generally arose from those CpG sites harboring a considerable degree of preexisting methylation in the wild-type parental cells. These hypermethylated loci had, on average, a greater starting methylation level in the parental HCT116 cells than those that became hypomethylated, which tended to arise from CpG sites with lower starting methylation levels (Fig. 2D). Together, these data support that endogenous heterozygous expression of the IDH1R132H/WT mutation systematically impacts global DNA methylation levels and, furthermore, that the direction of change is dependent upon the initial methylation levels in the parental cells.
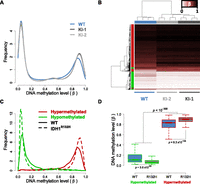
IDH1R132H/WT-induced DNA methylation alterations in HCT116 cells. HCT116-IDH1R132H/WT knock-in clones and parental cells were analyzed using the Illumina HumanMethylation27 assay. (A) Relative DNA methylation (β) distribution for IDH1WT HCT116 parental cells (blue) and IDH1R132H/WT knock-in clones (light- and dark-gray). Frequency (y-axis) is plotted by β such that the total probability (area under the curve) is equal to one. Both knock-in clones show an increase in methylated loci as compared with the wild-type parental cells. (B) Hierarchical clustering of HCT116 samples using IDH1R132H/WT differential loci. Samples are represented by columns and differential CpG loci by rows. Samples are annotated by IDH1 genotype where the wild-type parental cells are in blue and the IDH1R132H/WT knock-ins (KI-1, KI-2) are in light- and dark-gray. CpG loci are annotated by their differential methylation, where red is hypermethylated (FDR < 0.01, n = 2010) and green is hypomethylated (n = 842) in IDH1R132H/WT knock-ins as compared with the wild-type parental line. The color of the heat map represents β, where unmethylated is white (β = 0), partially methylated is burgundy (β = 0.5), and fully methylated is black (β = 1). Clustering is performed with an average clustering algorithm and Euclidean distance dissimilarity metric. (C) Relative DNA methylation distribution for HCT116 IDH1R132H/WT differentially methylated loci. Frequency of the differentially methylated loci are plotted relative to β for hypomethylated (green) and hypermethylated loci (red) in wild-type parental cells (WT: solid line) and IDH1R132H/WT knock-in cells (IDH1R132H: dashed line), such that the total probability (area under any given curve) is equal to one. (D) Box-and-whisker plot of DNA methylation levels for hypomethylated and hypermethylated loci in wild-type (WT) and IDH1R132H/WT knock-in cells (R132H). Loci that were hypermethylated have a higher methylation level in parental cells than loci that were hypomethylated (P < 10−300; Mann-Whitney U-test).
Methylation alterations observed in HCT116 IDH1R132H/WT knock-in cell lines are similarly affected in a brain tumor cell line overexpressing IDH1R132H
To determine the general applicability of the above results, we also assayed genome-wide DNA methylation in a human oligodendroglioma (HOG) cell line stably overexpressing IDH1R132H (Reitman et al. 2011). Comparison of the relative methylation (β) distribution of all assayed CpG sites revealed a shift in DNA methylation upon IDH1R132H expression, as compared with HOG cells expressing empty vector, resembling the shift in overall methylation observed in the HCT116 IDH1R132H/WT cells and resulting in increased frequency of CpG sites with high levels of methylation (β ∼0.8–1.0) (Supplemental Fig. 3A). To determine whether the expression of IDH1R132H in HOG cells had a similar effect on DNA methylation at specific loci, we examined the influence of IDH1R132H overexpression on methylation at loci shown to be differentially methylated in the HCT116 knock-in cells. There was a largely concordant influence of IDH mutation on the behavior of the individual CpG loci in both models (Supplemental Fig. 3B). Considering the different cell backgrounds, it was not surprising that loci that undergo hypermethylation in HCT116 IDH1R132H/WT knock-in clones, which started with relatively high methylation levels in parental HCT116 cells, showed a broader methylation distribution in HOG cells, as did the loci that became hypomethylated in HCT116 IDH1R132H/WT knock-in clones (cf. Fig. 2C and Supplemental Fig. 3C). Nevertheless, there was a similar influence of the IDH1 mutation on methylation distribution in both sets, in that there was a general depletion of sites with intermediate methylation levels (β ∼0.3–0.7) and an accumulation of sites with methylation levels at the extremes (β > 0.8 or <0.2; Supplemental Fig. 3C). Moreover, loci that were significantly hypermethylated in HCT116 IDH1R132H/WT cells showed an overall increase in methylation in the HOG cells overexpressing the IDH1R132H mutant (P ≤ 0.0098), and loci that were significantly hypomethylated in the HCT116 IDH1R132H/WT cells showed an overall decrease in methylation levels in the HOG cell line expressing the IDH1R132H mutant (P ≤ 0.084; Supplemental Fig. 3D). Like the HCT116 cell line, those loci that became hypermethylated in the IDH1R132H-expressing HOG cells had a higher initial DNA methylation level in HOG parental cells than those that became hypomethylated (Supplemental Fig. 3D). Taken together, these data suggest that loci differentially methylated in the HCT116 IDH1R132H/WT knock-in model are similarly affected by overexpression of mutant IDH1 in oligodendroglioma cells.
Methylation alterations observed in HCT116 IDH1R132H/WT knock-in cell lines are similarly associated with IDH1 mutation in IDH1-mutant and G-CIMP+ primary gliomas
Previously, the Cancer Genome Atlas (TCGA) consortium identified a subset of GBMs exhibiting a high degree of concordant hypermethylation events, dubbed the glioma-specific “CpG island methylator phenotype” (G-CIMP), and further showed that this phenotype was significantly associated with IDH1 mutation in primary tumors (Noushmehr et al. 2010). A more recent study also characterized a cohort of primarily G-CIMP+ LGGs using DNA methylation and expression platforms (Turcan et al. 2012). We selected 61 primary GBMs characterized as part of the TCGA project for which definitive IDH1 mutational status and Illumina HumanMethylation27 data were available (Noushmehr et al. 2010), as well as 81 LGGs for which G-CIMP status and Illumina HumanMethylation450 data were available (Turcan et al. 2012) for further analysis. Although the overall relative methylation (β) distribution for the two cohorts differed somewhat due to the use of the two different DNA methylation platforms, there was an overall shift toward higher methylation levels in tumors with IDH1 mutations and/or G-CIMP+ classification, particularly in the frequency of CpG sites with a high level of methylation (β > 0.7) and a reduced frequency of loci with low levels of methylation (β < 0.2) (Fig. 3A,B).
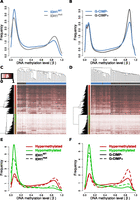
IDH1 mutant and G-CIMP+ gliomas recapitulate the DNA methylation alterations observed in cell line models. (A) Relative DNA methylation (β) distribution for 61 TCGA GBMs with definitive IDH1 mutational status and HumanMethylation27 data available (Noushmehr et al. 2010). Tumors that have wild-type (IDH1WT: blue) and mutated (IDH1mut: gray) IDH1 are drawn separately. (B) Relative β distribution for 81 LGGs from Turcan et al. (2012) classified as G-CIMP negative (G-CIMP-: blue) or positive (G-CIMP+: gray) profiled on the HumanMethylation450 array. Hierarchical clustering of the (C) TCGA GBM and (D) Turcan et al. (2012) LGG cohorts using the 2852 HCT116 IDH1R132H/WT differentially methylated loci separates IDH1WT from IDH1mut and G-CIMP+ from G-CIMP− tumors (P < 0.001). Samples are represented by columns and CpG loci by rows. Samples are annotated by IDH1 genotype for wild-type (blue) and mutated (gray) tumors. CpG loci are annotated by their differential methylation status, where red is hypermethylated and green is hypomethylated in HCT116 IDH1R132H/WT. The color of the heat map represents β, where unmethylated is white (β = 0), partially methylated is burgundy (β = 0.5), and fully methylated is black (β = 1). Clustering was performed with an average clustering agglomerative algorithm and Euclidean distance dissimilarity metric. Relative β distribution of HCT116 IDH1R132H/WT differentially methylated loci in the (E) TCGA GBM and (F) Turcan et al. (2012) LGG cohorts. Frequency of the differentially methylated loci are plotted relative to β for hypomethylated (green) and hypermethylated loci (red) in IDH wild-type or G-CIMP− tumors (solid line) and IDH mutant or G-CIMP+ tumors (dashed line).
To determine whether the alterations in DNA methylation induced by IDH1R132H/WT are reflective of IDH1 mutation-associated methylation changes observed in primary tumors, we performed hierarchical clustering on the 61 TCGA GBMs and the 81 LGGs using the subset of CpG sites altered in the HCT116 IDH1R132H/WT model (Supplemental Table 1). We found that the methylation status of the HCT116 IDH1R132H/WT differentially methylated loci segregated wild-type from IDH1-mutated GBMs (Fig. 3C) as well as G-CIMP+ from G-CIMP negative (G-CIMP−) LGGs (Fig. 3D). Permutation analyses confirmed that the segregation achieved for the 2852 HCT116 differential CpG loci was significantly greater than that achieved using the same number of randomly selected probes (P < 0.001). Although HCT116 cells have different underlying methylation patterns than those of the brain, the loci hypermethylated in HCT116 IDH1R132H/WT cells show the same trend toward hypermethylation in the IDH1-mutant and G-CIMP+ gliomas relative to IDH1 wild-type or G-CIMP− tumors (P ≤ 0.018) (Fig. 3E,F; Supplemental Fig. 4A,C). A further comparison of the genes hypermethylated in HCT116 IDH1R132H/WT knock-in cells with those reported to be hypermethylated in the G-CIMP+ versus G-CIMP−proneural GBMs (Noushmehr et al. 2010), and those reported to be differentially methylated in G-CIMP+ versus G-CIMP− LGGs (Turcan et al. 2012), revealed a significant overlap (Supplemental Fig. 4B,D; P ≤ 1.8 × 10⁻²², Fisher's exact). Approximately 17% of the sites that became hypermethylated in HCT116 IDH1R132H/WT were also hypermethylated in IDH1 mutated GBMs and >40% were also hypermethylated in G-CIMP+ LGGs. Interestingly, analysis of data from primary human astrocytes overexpressing IDH1R132H (Turcan et al. 2012) showed that there was not only a similar frequency of IDH mutation-induced differential methylation events, and fraction of hyper- versus hypomethylation, as detected in the HCT116 IDH1R132H/WT knock-in lines (in both cases 9% of CpG sites interrogated were differentially methylated overall, 70% of which were hypermethylated), but also a similar degree of concordance between hypermethylation induced in these two models and that associated with the G-CIMP+ phenotype in primary LGGs (e.g., 40% of HCT116 IDH1R132H/WT versus 36% of IDH1R132H astrocyte hypermethylated sites were concordantly hypermethylated in G-CIMP+ LGGs; P ≤ 7.9 × 10−41, Fisher's exact; Supplemental Fig. 4D). Together, these analyses show that loci hypermethylated in HCT116 IDH1R132H/WT knock-in lines are also subject to hypermethylation in IDH1-mutant or G-CIMP+ primary gliomas, and further, that the impact of IDH1 mutation on the methylome is similar regardless of the cell type of origin or starting methylation level. However, unlike the cell culture models, the HCT116 IDH1R132H/WT hypomethylated loci did not show evidence of reduced methylation in mutant versus wild-type IDH1 GBMs or G-CIMP+ versus G-CIMP− LGGs (Fig. 3E,F; Supplemental Fig. 4A,C). Nevertheless, CpG sites that became hypomethylated in response to IDH1R132H/WT in HCT116 cells generally exhibited lower methylation levels in the gliomas than those prone to hypermethylation (Fig. 3E,F). An examination of the loci identified by Turcan et al. (2012) as differentially methylated in G-CIMP+ versus G-CIMP− LGGs revealed a similar relationship to methylation level in that the hypomethylated loci tended to exhibit a lower average β across all tumors (mean β = 0.32) than those that showed G-CIMP-associated hypermethylation (Supplemental Fig. 4E,F). Thus, the same relative depletion of moderately methylated loci observed in the HCT116 knock-in model was also observed in G-CIMP+ and IDH-mutant primary gliomas.
Effects of IDH1R132H/WT on gene expression
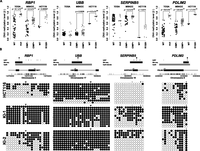
In addition to IDH1-mutant GBMs being classified almost exclusively as G-CIMP positive, they also robustly associate with distinct gene-expression signatures, in particular, the proneural GBM subclassification (Verhaak et al. 2010). We took advantage of our isogenic system and sought to examine the contribution of a 1-bp allelic substitution at IDH1 on gene-expression patterns. Genome-wide expression data were generated for the HCT116 parent and IDH1R132H/WT knock-in clones using Affymetrix Human Genome U133A 2.0 Arrays. Analysis of parental versus KI-1 and KI-2 IDH1R132H/WT knock-in clones yielded 21 differentially expressed probes from 19 unique genes, 18 of which were down-regulated in the IDH1R132H/WT clones (FDR < 0.05; fold-change > 1.5) (Fig. 4A; Supplemental Table 4). Gene Set Enrichment Analysis (GSEA) identified gene sets involved in protein degradation and Wnt signaling as enriched among the genes down-regulated in IDH1R132H/WT cells (Supplemental Table 5). Interestingly, 6 of 18 and 7 of 18 down-regulated genes overlapped with those reported to be down-regulated in the G-CIMP+ as compared with G-CIMP− proneural GBMs and LGGs, respectively (Noushmehr et al. 2010; Turcan et al. 2012), which is significantly more than would be expected by chance (P ≤ 0.023, Fisher's exact test) (Fig. 4A). We selected four of the 18 genes to verify their expression level in the cell lines. Direct analysis of the expression of these IDH1R132H/WT-mediated down-regulated genes by quantitative reverse transcriptase PCR validated the microarray findings and showed that the mRNA expression was significantly reduced for all four genes in the IDH1R132H/WT knock-in clones relative to parental HCT116 cells (Fig. 4B). Furthermore, a comparison of the expression levels of the same genes in 117 GBMs from the TCGA project (Verhaak et al. 2010) and 52 LGGs from the Turcan et al. (2012) cohort, for which gene expression data and IDH1 mutational status or G-CIMP classification were available, showed a corresponding down-regulation of these same genes in IDH1-mutant and G-CIMP+ gliomas relative to IDH1 wild-type and G-CIMP tumors (Fig. 4C).
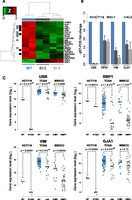
Gene expression profiling of HCT116 IDH1R132H/WT cell lines. HCT116 IDH1R132H/WT knock-in clones and parental cells were analyzed using Affymetrix Human Genome 2.0 Arrays. (A) Hierarchical clustering of probes differentially expressed in HCT116 parent versus knock-in cells. Samples are represented by columns and differential probes by rows. Samples are annotated by IDH1 genotype for wild-type HCT116 (blue) and IDH1R132H/WT knock-in cells (gray). Each probe is normalized (Z-score), and the color of the heat map represents the relative expression of each sample (red: overexpressed; green: underexpressed). Probes are annotated for overlap with genes found differentially expressed in TCGA GBMs (black) (Noushmehr et al. 2010) and LGGs (gray) (Turcan et al. 2012). Clustering is performed using an average clustering algorithm and a Euclidean distance dissimilarity metric of the normalized expression. (B) Quantitative real-time PCR (Q-PCR) validation of candidate genes UBB, RBP1, VIM, and GJA1 for IDH1R132H/WT–mediated transcriptional repression. Gene expression fold-changes were quantified for each candidate gene by using three independent mRNA samples from each clone and calculated relative to parental cell line. Shown is the mean ±SD of the triplicate determinations relative to HCT116 cells. (C) Stripcharts of gene expression values for validated genes in HCT116 parental (WT: blue) and IDH1R132H/WT (R132H: gray) cells as well as the same probes from 117 TCGA primary GBMs that are IDH1 wild-type (WT: blue, n = 98) or mutated (mut: gray, n = 19) and 52 LGGs that have gene expression data and G-CIMP negative (CIMP−: blue; n = 16) or positive (CIMP+: gray; n = 36) classification. (Lines) Median values for each group. P-values were calculated using Welch's two-sided t-test.
Relationship between IDH1 mutation-induced alterations in DNA methylation and gene expression
We next examined the relationship between DNA methylation and gene expression changes induced by IDH1R132H/WT mutation in the HCT116 knock-ins. Analysis of all genes interrogated on both the DNA methylation and gene-expression platforms indicated a subtle yet significant negative correlation between the average change in gene expression and average change in DNA methylation for a given gene (Spearman's ρ = −0.021, P = 0.027; Supplemental Fig. 5). To further explore the relationship between changes in gene expression and DNA methylation, we analyzed the distribution of IDH1R132H/WT hyper- and hypomethylated loci relative to the canonical transcription start site (TSS) of the closest gene or CpG island. Interestingly, hypomethylated loci were depleted around the canonical TSSs and tended to occur toward the edges of the CpG island, whereas hypermethylated loci were more broadly distributed, with most occurring within CpG islands or CpG island “shores,” but many without (Supplemental Fig. 6), consistent with these loci having significant average preexisting methylation. Analysis of chromatin immunoprecipitation and massively parallel sequencing (ChIP-seq) data from wild-type HCT116 cells (Birney et al. 2007) showed that CpG sites that became hypermethylated in the HCT116 IDH1R132H/WT cells are depleted of RNA polymerase II (Pol II) binding and histone H3 lysine 4 trimethylation (H3K4me3) relative to sites that become hypomethylated or remain unchanged (Supplemental Fig. 7A–E). These data suggest that sites that undergo hypermethylation in response to heterozygous expression of IDH1R132H/WT reside in domains that are less transcriptionally active and/or permissive in the parental HCT116 cells prior to IDH1R132H/WT knock-in. Although relatively enriched in Pol II, there was a decisive dip in Pol II binding surrounding the hypomethylated loci (Supplemental Fig. 7B). The finding that many sites that become hypermethylated may already be less active in the parental HCT116 cells may at least in part explain the apparent lack of correlation between DNA methylation changes and altered gene expression overall.
Global and gene-specific histone lysine methylation modifications correlate with DNA methylation and gene expression alterations in IDH1R132H/WT cells
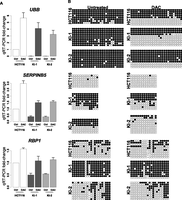
To validate and further examine the relationship between epigenetic alterations and gene expression changes induced by IDH1 mutations, we analyzed in more detail three hypermethylated loci that exhibited a significant reduction in gene expression in HCT116 IDH1R132H/WT knock-in cells (UBB, RBP1, and SERPINB5) and one that did not (PDLIM2) using bisulfite sequencing analysis (Fig. 5). Primers were designed to amplify a region of several hundred base pairs and covered 1–3 of the CpG probes interrogated on the Illumina methylation array in each case. The methylation density, as estimated from the total number of methylated CpG sites among the total CpGs and alleles analyzed, showed a high correspondence with the methylation levels of underlying probes as assessed on the Illumina platform (Fig. 5, cf. A and B) and confirmed the increase in methylation observed in the IDH1R132H/WT knock-in clones relative to the parental HCT116 cell line (Fig. 5B). In contrast, there was no significant accumulation of DNA methylation in three clonal control lines that were subject to the same infection and selection protocol as the IDH1R132H/WT clones, but did not exhibit homologous recombination at the IDH1 locus (Supplemental Fig. 8), excluding the possibility that the hypermethylation was the result of a nontargeted effect or clonal selection. Comparison of the patterns of methylation across individual alleles in a population of parental and IDH1 knock-in cells suggested that hypermethylation resulted both from new methylation arising on relatively unmethylated alleles and from an increase in the density across alleles, suggesting a filling-in or spreading of preexisting methylation, depending on the gene analyzed (Fig. 5B).
Bisulfite sequence analysis of candidate CpG loci validates IDH1R132H/WT-induced DNA methylation changes. (A) Stripcharts of DNA methylation values (β) in HCT116 parental (WT: black) and IDH1R132H/WT (R132H: gray) cells are shown next to data for the same loci in TCGA GBMs that are IDH1 wild-type (WT: black) or mutated (mut: gray) and LGGs that are G-CIMP negative (CIMP−: black) or positive (CIMP+: gray). P-values are from Welch's two-sided t-test. (B) Bisulfite sequence analysis of the loci shown in A. (Top) The interrogated region is depicted with a schematic of the gene with CpG dinucleotides represented by vertical tick marks on the x-axis. Browser tracks denote CpG islands, the region analyzed by bisulfite sequencing (Bis seq) and CpG loci interrogated by the HumanMethylation27 platform (Inf27). The CpG locus plotted in A is denoted by a black arrowhead above the Inf27 track. (Bottom) Bisulfite sequencing results for the regions denoted in the schematic above. Each row represents a sequenced allele and each dot represents a CpG. (Black dots) Methylated CpGs; (white dots) unmethylated CpGs. The CpG shown in A is denoted with a black arrowhead, and other CpGs interrogated by the assay are shown in gray.
Next, we examined levels of histone lysine methylation in IDH1R132H/WT knock-in and parental cells. Western blot analysis showed that the global levels of H3K4me3, H3K9me3, H3K27me3, and H4K20me3 were increased in KI-1 and KI-2 clones as compared with parental cells (Fig. 6A). These results are consistent with previous models overexpressing IDH mutants (W Xu et al. 2011; Lu et al. 2012; Turcan et al. 2012). Chromatin immunoprecipitation (ChIP) followed by quantitative PCR was used to examine the levels of these histone marks at the promoters of the same four hypermethyalted candidate loci. All four loci showed an accumulation of H3K9me3 that accompanied the hypermethylation of DNA (cf. Fig. 5B and Fig. 6B). H3K27me3 was much less abundant at these loci in the parental HCT116 cells and showed modest accumulation only at the SERPINB5 locus in the knock-in cells. Taken together, these data suggest that both global and gene-specific alterations in histone methylation occur in conjunction with DNA methylation in response to heterozygous mutation of IDH1R132H/WT and that the two can work together to reshape the epigenome.
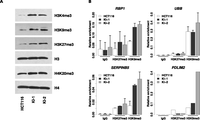
Global and gene-specific histone lysine methylation coincides with IDH1R132H/WT-induced DNA methylation. (A) Western blots for total H3K4me3, H3K9me3, H3K27me3, and H4K20me3 histone modifications for parental (HCT116) and IDH1R132H/WT knock-in (KI-1, KI-2) cell lines. Also shown are total H3 and H4 controls. (B) ChIP was performed using antibodies against H3K9me3, H3K27me3, pan-H3, or IgG and immunoprecipitated DNA quantified by Q-PCR using primers specific to the promoter regions of the indicated genes. (Bar graphs) The mean enrichment of the specific histone mark relative to that of total histone H3 for the same genomic region. (Error bars) Standard deviation of two independent experiments except for PDLIM2.
Gene silencing at specific IDH1R132H/WT-targeted loci is reversed using a DNA hypomethylating agent
The relationship between DNA methylation and gene silencing at specific loci affected by the IDH1R132H/WT mutation and the potential reversibility of these alterations was examined by determining the effects of exposure to a DNA methyltransferase inhibitor on DNA methylation and gene expression at the RBP1, UBB, and SERPINB5 genes. Parental HCT116 cells and knock-in clones were treated with 5-aza-2′-deoxycytidine (decitabine, Dacogen, DAC) or control, and gene expression levels were determined by RT-PCR (Fig. 7A), while corresponding DNA methylation levels were determined by bisulfite sequencing (Fig. 7B). The UBB promoter, which was partially methylated (∼80%–89%) and exhibited low levels of gene expression in the parental line, approached complete methylation (90%–98%) (Figs. 5B, 7B) commensurate with a complete loss of UBB mRNA expression in the knock-in clones (Fig. 7A; see also Fig. 4B). Upon DAC treatment, DNA was hypomethylated, and a robust restoration of UBB gene expression was observed in both the parental and knock-in clones (Fig. 7A,B). Similarly, the promoter regions of SERPINB5 and RBP1, which were virtually unmethylated or partially methylated (28%–35%), respectively, and expressed in the parental HCT116 cell line, underwent an increase in methylation in the HCT116 knock-in clones (from 30% to 71% and 35% to 89%, respectively) (Figs. 5B, 7B) and showed a corresponding approximately twofold decrease in gene expression (Fig. 7A; see also Fig. 4B). DAC treatment resulted in hypomethylation of DNA and a restoration of RBP1 and SERPINB5 gene expression to control levels and induced a similar relative increase in both parental and knock-in clones (Fig. 7A,B). Taken together, our data support a model in which heterozygous IDH1 mutations can promote widespread alterations in DNA methylation, at least some of which contribute to altered gene expression patterns and can be reversed by treatment with a DNA hypomethylating agent.
Inhibition of DNA methylation results in restoration of gene expression for IDH1R132H/WT-repressed loci. (A) Candidate gene expression reactivation in 5-aza-2′-deoxycytidine-treated IDH1-mutant cell lines. Parental or IDH1R132H/WT knock-in (KI-1, KI-2) cells were treated with 5 μM of 5-aza-2′-deoxycytidine (DAC) or control (PBS) for 48 h. Following treatment, relative mRNA levels of UBB, RBP1, and SERPINB5 were measured by Q-PCR. (Bar graph) Expression fold-change relative to untreated parental cell line. (Error bars) Standard deviation of three independent experiments. (B) Bisulfite sequencing analysis of candidate genes in A for untreated and DAC-treated cell lines. Each row represents a sequenced allele and each dot represents a CpG. (Black dots) Methylated CpGs; (white dots) unmethylated CpGs.
Discussion
Heterozygous IDH1 mutations occur frequently in human tumors and display robust association with specific DNA methylation signatures. Using a somatic knock-in cell line system, we induced physiologic expression of the most frequently observed IDH1 mutation, IDH1R132H/WT, in a human cancer cell line. In this report we establish that genome-wide alterations in DNA methylation result from induction of the IDH1R132H/WT genotype. We found that the expression of the single IDH1R132H allele was sufficient to induce widespread alterations in DNA methylation, including both hypermethylation and hypomethylation events. Notably, the IDH1R132H/WT-mediated direction of methylation change was associated with the initial methylation state of the parental cells. Hypermethylation events tended to arise at CpG sites that were already moderately methylated (average 78%), whereas hypomethylation events occurred at CpG sites that were methylated to a lesser degree (average 17%), resulting in an accentuation of the bimodal distribution of CpG methylation. We further demonstrate that these alterations are similarly associated with IDH1 mutation and G-CIMP+ classification in gliomas and that the methylation signature identified can distinguish tumors with these features in two independent primary tumor cohorts. Together, these data provide evidence that heterozygous IDH1R132H/WT mutations drive epigenetic instability and initiate the methylation phenotypes observed in patients. Comparison of our data to that recently published by Turcan et al. (2012) showed a remarkably similar influence of the IDH1R132H mutation on the methylome, independent of the cell type of origin (HCT116 colon cancer cells vs. primary astrocytes) or method of introduction, with an estimated 9% of CpG sites significantly affected overall, 70% of which underwent hypermethylation in both studies. Interestingly, whereas there was considerable concordance between sites that undergo IDH1 mutation-driven hypermethylation in these cell culture models and sites preferentially hypermethylated in CIMP+ gliomas, there was little relationship between hypomethylated sites in the different models and primary tumors, suggesting that the mechanisms driving IDH1 mutation-associated hypermethylation may differ from those driving hypomethylation.
Tumor-associated IDH mutations are overwhelmingly observed to occur in the heterozygous state in primary tumors, and current theories have speculated that both the wild-type and mutant alleles are necessary for oncogenic function. IDH1 functions as a dimer, and previous studies have shown that the presence of wild-type IDH1 can stimulate the reductive enzymatic activity of mutant IDH1, potentially through formation of a highly active IDH1R132H-IDH1WT heterodimer (Bralten et al. 2011). Therefore, gene dosage of mutant and wild-type alleles has the potential to influence IDH1 enzyme activity and D-2-HG production, the relative ratios of α-KG depletion and D-2-HG accumulation, and ultimately the inhibition of Fe(II)/2-oxoglutarate-dependent dioxygenases. As D-2-HG is a weak antagonist of α-KG, competitive inhibition of α-KG-dependent dioxygenases requires a large fold excess of D-2-HG (W Xu et al. 2011). Therefore, a relatively small change in α-KG production resulting from replacement of one IDH1 allele can potentially have a large impact on α-KG-dependent enzymatic reactions or alternatively may poise the cell for D-2-HG-mediated effects.
Several nonexclusive hypotheses have been proposed as potential mechanistic links between IDH mutants, reduction of cellular α-KG levels and/or accumulation of D-2-HG, and epigenetic alterations in cancer cells. One potential mechanism involves inhibition of TET proteins on the flux between 5-methylcytosine (5-mC), 5-hydroxymethylcytosine (5-hmC), and cytosine. The TET family proteins catalyze the conversion of 5-mC to 5-hmC (Tahiliani et al. 2009; Ito et al. 2010) and higher oxidation states, including 5-formylcytosine (5-fC) and 5-carboxylcytosine (5-caC) (He et al. 2011; Ito et al. 2011). These modified methylcytosine bases are likely intermediates in active DNA demethylation arising from removal by the base excision repair machinery and replacement with cytosine (Wu and Zhang 2010; Cortellino et al. 2011; Guo et al. 2011; He et al. 2011). Recent advances have provided insight into the roles of TET enzymes on the regulation of 5-hmC, the cellular context and genomic distribution of 5-hmC, and the importance of 5-hmC in regulation of transcription and cellular differentiation (Ito et al. 2010; Ficz et al. 2011; Jin et al. 2011b; Kinney et al. 2011; Koh et al. 2011; Pastor et al. 2011; Ruzov et al. 2011; Stroud et al. 2011; Szulwach et al. 2011; Williams et al. 2011; Wossidlo et al. 2011; Wu et al. 2011a,b; Y Xu et al. 2011; Nestor et al. 2012). Bisulfite-based technologies, including the Illumina methylation platform used here, do not distinguish between 5-mC and 5-hmC (Nestor et al. 2010). Thus, the methylation values reported at any one CpG site represents the sum of the two, and there may be some CpG sites that are predominately one or the other. This could be one explanation for the hyper- and/or hypomethylation observed in response to IDH mutation in ours and other (Turcan et al. 2012) studies. Hypermethylation events could occur through inhibition of TET proteins and accumulation of 5-mC that would ensue due to the decreased conversion of 5mC to 5-hmC and decreased DNA demethylation (Wu and Zhang 2010; Cortellino et al. 2011; Dahl et al. 2011; Guo et al. 2011). Apparent hypomethylation could result from the conversion of all preexisting 5-hmC to cytosine by base excision repair (e.g., thymidine glycosylase or MBD4) and/or the inability to maintain this mark during replication (Valinluck and Sowers 2007; Hashimoto et al. 2012). In the absence of TET function, the inability to generate new 5-hmC would lead to a depletion of 5-hmC and an increase in unmodified cytosine. Consistent with this, whereas IDH mutations in gliomas (Noushmehr et al. 2010) and in AMLs (Figueroa et al. 2010a) are associated with a CpG island hypermethylation phenotype, TET2 loss-of-function in myeloid tumors has been associated with both the CIMP phenotype (Figueroa et al. 2010a) as well as global hypomethylation (Ko et al. 2010). The potential contribution of TET inhibition to the IDH-mutation driven epigenetic alterations is further confounded by the findings that whereas 5-hmC is depleted in a number of cancers and is reduced upon overexpression of IDH1R132H in astrocytes (Turcan et al. 2012), total 5-hmC levels do not appear to correlate with IDH mutations in primary gliomas (Jin et al. 2011a). Any influence that IDH mutations and/or TET mutations might have on the site-specific patterns of 5-hmC across the genome in cancer cells remains to be determined.
Another mechanism involves effects on histone methylation patterns. Of particular interest are members of the Jumonji-C domain family of histone demethylases (JHDMs), which demethylate histone lysine residues in an α-KG-dependent manner. D-2-HG competitively inhibits JHDM activity in vitro (Chowdhury et al. 2011; W Xu et al. 2011). Overexpression of mutant IDH leads to alterations in histone methylation levels in cell lines (W Xu et al. 2011; Lu et al. 2012; Turcan et al. 2012), and IDH mutations are associated with increased histone methylation in primary human tumors (W Xu et al. 2011; Lu et al. 2012). Our data indicate that heterozygous expression of IDH1R132H/WT results in both global and site-specific alterations in histone lysine methylation patterns. We find that whereas the global levels of multiple histone H3 and H4 methylation modifications were increased, consistent with a broad inhibition of histone demethylation, hypermethylation at H3K9 in particular accompanied site-specific hypermethylation of DNA at several genes that were down-regulated in IDH1R132H/WT knock-in cells. This is consistent with recent work by Turcan et al. (2012) who similarly showed a concomitant accumulation of H3K9me3 and DNA methylation at several genes that undergo epigenetic silencing in response to ectopic expression of mutant IDH1 in human astrocytes. Although it is currently unknown whether DNA methylation or H3K9me3 is the primary mediator of gene silencing in these cases, a recent study by Lu et al. (2012) showed that increased H3K9me3 could occur independently of DNA methylation changes at the Cebpa and Adipoq loci in IDH2R172K-expressing mouse fibroblasts and, further, that the global accumulation of H3K9me3 preceded that of DNA methylation in human astrocytes ectopically expressing IDH1R132H. Although the extent to which mutant IDH-driven alterations in DNA methylation are dependent upon changes in H3K9me3 (or vice versa) remains to be determined, these data suggest that altered H3K9me3, through the D-2-HG-mediated inhibition of an H3K9 demethylase, may underlie DNA hypermethylation-associated gene silencing at least at some loci. Close mechanistic ties are thought to exist between these two modifications, particularly in the maintenance of constitutive heterochromatin and the silencing of repetitive elements (Lehnertz et al. 2003; Cedar and Bergman 2009; Hashimoto et al. 2010). Targeted deposition of H3K9me2/3 can direct de novo DNA methylation in an integrated transgene system (Schultz et al. 2002) and precedes de novo methylation of stem cell genes during lineage specification of embryonic stem cells (Cedar and Bergman 2009). At present, the extent to which D-2-HG-mediated inhibition of one or more α-KG-dependent enzymes is responsible for the pathogenesis of IDH mutation-associated tumors remains to be determined. Future studies aimed at the integrated analyses of histone methylation and DNA (hydroxy)methylation at a genome-wide scale will be necessary to resolve the relative contribution to IDH mutation-associated cancers.
We examined gene-expression alterations resulting from induction of IDH1R132H/WT in HCT116 and revealed a subset of 19 genes that demonstrated significant changes in gene expression. Nearly all of the dysregulated genes (18 of 19) were down-regulated and exhibited concomitant hypermethylation. In contrast, there was no significant association between hypomethylation and gene expression in our model. This is perhaps not surprising considering that most of the mutant IDH-driven hypomethylation events affected sites that had only low levels of methylation to begin with (average β = 0.17) and occurred more frequently at sites away from the canonical TSSs and toward the edges of CpG islands. Whereas the inverse correlation between the methylation status of CpG sites within CpG island-containing promoters and gene expression is well-described, recent genome-wide studies indicate that gene body methylation is positively correlated with gene expression in normal cells (Lister et al. 2009; Rauch et al. 2009; Maunakea et al. 2010) and, furthermore, that loss of methylation in such regions in cancer cells correlates with gene repression (Hon et al. 2012). Even in DNMT triple knock-out mouse embryonic stem cells (DNMT TKO) (Karimi et al. 2011), where there is a dramatic demethylation of the genome, surprisingly few genes (n = 239) are significantly up-regulated.
Somewhat surprisingly, despite the widespread hypermethylation events observed, the number of significantly down-regulated genes was relatively small. Nevertheless, our findings are consistent with previous reports showing that only a small fraction (17%) of loci hypermethylated in G-CIMP+ primary GBMs were associated with a concomitant decrease in gene expression (Noushmehr et al. 2010). A growing number of studies indicate a low correlation between DNA hypermethylation and gene expression at a global level in cancer cells (Hahn et al. 2008; Pike et al. 2008; Takeshima et al. 2009). This appears to be in part because many of the genes that undergo DNA hypermethylation in cancer cells are already marked by repressive chromatin and exist in a relatively low expression state in the parental cells (Sproul et al. 2011). Consistent with this idea, CpG sites that became hypermethylated in response to IDH1R132H/WT were already, on average, partially methylated and depleted of marks of active transcription (H3K4me3) and Pol II occupancy in the parental HCT116 cells relative to sites that became hypomethylated or were unaffected. The finding that a significant proportion of CpG sites prone to hypermethylation in the HCT116 IDH1R132H/WT knock-in cells are similarly hypermethylated in IDH mutant and/or G-CIMP+ gliomas and IDH1R132H-overexpressing cells suggests that the metabolic disturbance imposed by IDH mutations may impact upon a common set of vulnerable genomic sites. One common feature may be preexisting marking by repressive chromatin. In particular, genes that are targets of the Polycomb repressor complex 2 (PRC2) and marked by H3K27me3 in embryonic or adult stem cells are highly prone to CpG island hypermethylation across tumor types (Ohm et al. 2007; Schlesinger et al. 2007; Widschwendter et al. 2007; Gal-Yam et al. 2008; Easwaran et al. 2012), including those hypermethylation events associated with the CIMP phenotype (Fang et al. 2011; Easwaran et al. 2012; Turcan et al. 2012). Indeed, sites that underwent IDH-driven hypermethylation in our HCT116 IDH1R132H/WT knock-in cells are enriched in Polycomb target genes, and there was even greater enrichment among those commonly hypermethylated between the HCT116 IDH1R132H/WT knock-in cells and astrocytes overexpressing the IDH1R132H mutant or G-CIMP+ LGGs (Turcan et al. 2012) (Supplemental Table 6), suggesting that this may be an common underlying feature. In stem cells, marking by the Polycomb complex is thought to keep key developmental regulators in a low but poised transcriptional state to prevent lineage commitment and differentiation and to maintain self-renewal capacity. It has been proposed that the replacement or superimposition of such reversible chromatin-mediated repression by the more stable silencing associated with promoter DNA methylation may contribute to tumor progression by reducing the epigenetic plasticity that would normally allow stem/progenitor cells to activate differentiation programs or respond to cellular stress (Gal-Yam et al. 2008; Easwaran et al. 2012). Consistent with this idea, we found that the IDH-driven hypermethylated sites seen here were enriched in genes that play a role in the cellular response to extracellular stimuli and cell-type-specific differentiation functions (Supplemental Table 2).
Although small in number, we identified several candidate genes that are targets of mutant IDH1-mediated de novo epigenetic silencing, including RBP1, UBB, and SERPINB5. Interestingly, over 33% of the genes down-regulated in HCT116 IDH1R132H/WT cells overlapped with those reported to be down-regulated in the G-CIMP+ as compared with G-CIMP− proneural GBMs and LGGs (Noushmehr et al. 2010; Turcan et al. 2012). RBP1 has been demonstrated to be one of the genes most frequently subject to epigenetic silencing in G-CIMP+ primary GBMs (Noushmehr et al. 2010; Laffaire et al. 2011) and was also among the most strikingly subject to concordant hypermethylation and down-regulation in our model. In addition to gliomas, RBP1 is also silenced in conjunction with promoter hypermethylation in several cancer types, including lymphomas, esophageal squamous cell carcinomas, and gastric carcinomas (Esteller et al. 2002; Mizuiri et al. 2005; Shutoh et al. 2005; Chu et al. 2006). Involved in the transport of retinol, RBP1 regulates intracellular retinoic acid (RA) homeostasis. RA influences many important and diverse functions, including cell proliferation and differentiation, and retinoid signaling is often compromised in early carcinogenesis (Tang and Gudas 2011). RBP1 down-regulation in cancer promotes loss of cellular differentiation and tumor progression through inhibition of retinoic acid receptor (RAR) activity and derepression of PI3K/Akt signaling (Farias et al. 2005a,b). Further, RBP1 has been proposed as a tumor suppressor in bladder cancer, as its silencing contributes to cell proliferation and migration (Toki et al. 2010). Additionally, markers for RA signaling, including RBP1 mRNA, have been shown to be significantly decreased in long-term GBM survivors (associated with IDH1 mutation) and may be one potential area to target therapeutically (Barbus et al. 2011). We also identified UBB, coding for a highly conserved polyubiquitin precursor, as a target of IDH1R132H/WT-driven epigenetic silencing. Ubiquitin-mediated protein degradation plays important roles in the control of numerous cellular processes, including signal transduction, cell-cycle progression and transcriptional regulation, and abnormalities in ubiquitin-mediated processes are involved in several pathological conditions, including malignant transformation (Hershko and Ciechanover 1998). At the UBB locus, a seemingly small increase in methylation led to drastic down-regulation of the gene. Although we cannot completely explain this observation, it may be that the expression observed in the parental cells derives from a relatively few (<10%) unmethylated alleles. Nevertheless, treatment with DAC led to an up-regulation of gene expression that was proportional to the decrease in DNA methylation. Even in the parental line, which is already substantially methylated, treatment with DAC results in demethylation and a sixfold up-regulation of the gene. These data are consistent with the idea that many of the sites that become hypermethylated in response to IDH1 mutation are already partially methylated and repressed in the parental cell line.
While the high frequency, specificity, and early timing of IDH1 mutations provide strong evidence for their importance in tumorigenesis, the precise oncogenic consequences of these mutations remain unclear. Together, the presented data support that IDH1R132H/WT mutations induce widespread alterations of DNA methylation and contribute to the global DNA methylation phenotypes observed in patients. Future studies of mutant IDH1 and the cellular mechanisms and signaling pathways that it targets will be critical to understand the malignant properties of these deadly cancers.
Methods
Cell culture and drug treatment
HCT116 cell lines were cultured in McCoy's 5A medium supplemented with 10% FBS. HCT116 parental cells were a generous gift from Dr. Bert Vogelstein (The Johns Hopkins University). Human oligodendroglioma (HOG) cell lines expressing mutant IDH1 or empty vector were generated as described previously (Reitman et al. 2011). All cells were maintained in 5% CO2 at 37°C. For reactivation studies, parental or IDH1R132H/WT knock-in cells (1 × 10⁶) were plated in a 25-cm2 flask 24 h before treatment with 5 μM 5-aza-2′-deoxycytidine (DAC) (Sigma) or control (equal volume PBS). Medium containing fresh DAC was applied every 24 h for a total of 48 h. Following treatment, cells were harvested, and RNA and genomic DNA were isolated for analysis.
Gene targeting of the human IDH1 locus
The approach for generating genetic knock-ins in human somatic cells was performed as previously described (Rago et al. 2007). Targeting constructs were designed to introduce the IDH1R132H allele in HCT116 utilizing the pSEPT rAAV shuttle vector (Topaloglu et al. 2005). Homology arms for the targeting vector were PCR-amplified from HCT116 genomic DNA using Platinum Taq HiFi polymerase (Invitrogen). The R132H hotspot mutation was introduced in the targeting construct by using the Quickchange II site-directed mutagenesis kit (Stratagene). An infectious rAAV stock harboring the targeting sequence was generated and applied to the parental cell line as previously described (Kohli et al. 2004), and clones were selected in 0.5 mg/mL Geneticin (Invitrogen). Next, excision of the selectable element was induced with Cre recombinase (Vector Biolabs). Targeted homologous recombination and Cre-mediated excision were verified using PCR-based assays. Genomic DNA and total RNA were isolated from cells with a QIAmp DNA Blood Kit and RNeasy Kit (Qiagen). First-strand cDNA was synthesized by using an iScript cDNA Synthesis Kit (BioRad). Genotypes of identified clones were validated and determined to have equal expression of mutant and wild-type IDH1 by PCR and direct sequencing of genomic DNA and cDNA.
D-2-HG analysis
Quantification of D-2-HG in cell lysates and culture media was performed by LC-negative electrospray ionization-MS/MS at the Duke University Cancer Center Clinical Pharmacology Lab as described previously (Struys et al. 2004; G Jin et al. 2011). Intracellular D-2-HG levels were normalized to total protein levels. Media above cells was collected 48 h after plating for analysis of D-2-HG concentration.
Genome-wide CpG methylation profiling
Genomic DNA was extracted using a DNeasy Blood & Tissue Kit (Qiagen) and DNA was bisulfite converted using the EZ DNA Methylation Kit (Zymo). DNA methylation was profiled using the Illumina HumanMethylation27 BeadChip platform, which interrogates 27,578 CpG sites from 14,475 protein-coding genes and 110 microRNAs. This platform measures the methylation status of single CpG sites after bisulfite modification of DNA. For each interrogated CpG there are two bead (oligonucleotide) types: one corresponding to the methylated (C) sequence and the other to the unmethylated (T) state. Annealing of the bisulfite-converted sample DNA is followed by single-base primer extension using DNP- and Biotin-labeled ddNTPs, followed by staining and scanning. Methylation levels are returned as a beta (β) value that ranges from 0 to 1 (where 1 approximates 100% methylation) and is calculated as the ratio of the fluorescence signal for the methylated (M) probe to the total signal for both probes (U + M) at each CpG site. Two independent clonal variants from each of two unique recombinant knock-in clones were assayed in duplicate in addition to four biological replicates of the parental cells. Methylation arrays were processed at the Duke University Center for Human Genetics according to the manufacturer's instructions and scanned on an Illumina iScan. Data were interpreted in the Methylation Module of GenomeStudio (v2010.3) software. Only those probes with a detection P-value of <0.01 in all samples were considered in subsequent analyses.
Statistical analysis of DNA methylation
All differential and statistical analyses were performed in R/Bioconductor (http://www.r-project.org/). Differential analyses were conducted with fixed-effects linear models implemented by the function “lm” of the “stats” package. Clonal analysis used a defined variable for clone to explain differences in DNA methylation level (βi) for each CpG locus i and clone j where clonej ε (HCT116 parent, IDH1R132H/WT knock-in 1, IDH1R132H/WT knock-in 2), such that βi ∼ clonej. This produced a t-statistic and P-value for each CpG locus i and each knock-in compared with the wild-type HCT116 parent. P-values were corrected for multiple hypothesis testing by using the Benjamini-Hochberg False Discovery Rate (FDR) implemented by the “p.adjust” function also of the “stats” package in R where an FDR < 0.01 was considered significant. IDH1R132H/WT differential analysis used the same methodology as the clonal analysis, except instead of a variable to define clone, a variable that defined IDH1R132H/WT genotype was used to explain the methylation level (βi) for each CpG locus i, thus combining the clones. Similarly, this produced a t-statistic and a P-value (Pi) for the effect of the IDH1R132H mutation on DNA methylation level for each locus i. Benjamini-Hochberg FDR was used for multiple hypothesis testing correction. The Q-Q plot was generated using the function “qqnorm” of the “stats” package. Hierarchical clustering for DNA methylation data was performed using the “heatmap.2” function of the “gplots” package, where clustering was performed using an average agglomerative algorithm and a Euclidean distance dissimilarity metric. Data were not normalized for DNA methylation hierarchical clustering or display. The significance of the 2852 identified HCT116 differentially methylated loci in discriminating IDH1 mutant and wild-type TCGA GBM samples was tested by permutation analysis. The average Euclidean distance of β between the IDH1 wild-type and mutant (or G-CIMP+ and G-CIMP−) samples was calculated for the 2852 HCT116 differential loci and then compared with that achieved using 2852 randomly chosen loci. This process was repeated 1000 times. In no permutation was the distance between the two groups greater than the distance achieved using the actual differential loci, suggesting that the HCT116 differential loci have a greater ability to segregate IDH1 wild-type and mutant TCGA GBMs (Noushmehr et al. 2010) than a set of arbitrary loci. This same methodology was applied to the LGG set from Turcan et al. (2012), except that the G-CIMP positive and negative groups were compared only at those HCT116 differential loci common to both platforms (n = 2722). Relative DNA methylation distribution plots were generated using the “density” function of the “stats” package, which computes the probability density function of the β distribution (i.e., describing the relative likelihood of β to occur at a given value such that the area under the curve is equal to 1). Box-and-whisker plots were created using the “boxplot” function of the “stats” package using the default settings. Boxes represent the first to third quartiles of the data distribution and whiskers were drawn to the maximum data value no more than 1.5 times the interquartile distance (i.e., difference between the first and third quartiles). P-values for the box-and-whisker plots were calculated using the Mann-Whitney U-test implemented by the “wilcox.test” of the “stats” package and are two-sided when comparing the methylation level of HCT116 IDH1R132H/WT hypermethylated and hypomethylated loci and one-sided when comparing either the hypermethylated or hypomethylated loci with the relevant IDH1 genotype comparison (e.g., IDH1WT or IDH1mut). Stripcharts were created with the “stripchart” function of the “graphics” package, and the horizontal solid black lines represent the median of each comparison. P-values were calculated by using Welch's two-sided t-test. The spatial distribution of methylation probes relative to TSS and CpG island were calculated by mapping the location of each probe relative to the closest TSS (hg18 UCSC RefSeq genes; http://hgdownload.cse.ucsc.edu/goldenPath/hg18/database/RefFlat.txt.gz) or CpG island (hg18 Takai-Jones criteria) (Takai and Jones 2002). Distribution was then plotted using the “density” function in R. Gene ontology analysis of the HCT116 hypermethylated and hypomethylated loci was conducted using the GOstats package (Falcon and Gentleman 2007), where over-represented biological processes were determined using a significance threshold of P < 0.01.
Genome-wide expression profiling
To profile gene expression levels, we utilized Affymetrix Human Genome U133A 2.0 Arrays. For expression analyses, 2 × 10⁶ cells were plated to a 25-cm2 flask and harvested after 48 h for RNA isolation by using the RNeasy Kit (Qiagen), with array measurements performed on biological duplicates. The RNA samples were labeled using the Ambion MessageAmp Premier Package and interrogated with the U133A 2.0 Array at the Duke Microarray Facility.
Statistical analysis of gene expression
Data were loaded in Expression Console, RMA normalized, and exported for analysis in R/Bioconductor (http://www.r-project.org/). Data were filtered to remove nonexpressed probes (i.e., probes where no sample had a MAS5 detection P-value <0.01). In total, of the 22,215 probes on the Affymetrix platform, 10,796 were detected in one or more samples, and this set was used for further analysis. Differential analysis of the gene expression data used the same strategy and similar methods as used for the DNA methylation analysis. Here, IDH1R132H/WT genotype was used to explain the gene expression level (GXi) for each probe i, such that GXi ∼ IDH1R132H/WT genotype. This resulted in a t-statistic and P-value for each probe i being differentially expressed in HCT116 parental and IDH1R132H/WT knock-in clones. Additionally, a fold-change criterion was imposed on the differential analysis, where P-values for probes with a fold-change >1.5 were corrected for multiple hypothesis testing using Benjamini-Hochberg FDR. This resulted in 21 probes from 18 genes significantly altered by IDH1R132H/WT knock-in (FDR < 0.05, fold-change > 1.5). Hierarchical clustering was done used the “heatmap.2” function of the “gplots” package, where data were normalized by probe and an average clustering algorithm was used with a Euclidean distance dissimilarity metric applied to the normalized data. Correlation of gene expression with DNA methylation data was evaluated using the average fold-change between IDH1WT and IDH1R132H/WT knock-in expression compared with the average change in DNA methylation (β) for the same gene. For this analysis, those genes with multiple gene expression or DNA methylation probes were summarized to one value by averaging the multiple probes and then computing the fold-change or DNA methylation difference between IDH1WT and IDH1R132H/WT knock-in groups. Correlation was computed using Spearman's rank correlation (ρ), and significance of the correlation was assessed using permutation testing where the DNA methylation changes and gene expression fold-changes were randomly permuted 1000 times and Spearman's rank correlation was calculated for each permutation. The P-value shown in Supplemental Figure 5 reflects the number of times the permuted correlation (ρ) was larger than the actual correlation. Gene set enrichment analysis (GSEA) was performed with GSEA software (v2.0) and the Molecular Signatures Database (MsigDB v3.0) (Subramanian et al. 2005). The HCT116 gene expression data was analyzed with a signal-to-noise ratio and 1000 gene set permutations against the curated MsigDB.
Genomic bisulfite sequencing analysis
To validate genome-wide methylation data, we used bisulfite sequencing techniques to analyze CpG-rich regions of gene promoter DNA. Primers for sequencing bisulfite-modified DNA were designed to avoid CpG residues using MethPrimer software such that unmethylated and methylated sequences are equally amplified (Li and Dahiya 2002). PCR products were TA cloned (Invitrogen) and transformed into chemically competent Escherichia coli, and plasmid DNA isolated from seven to 10 individual colonies was sequenced. Primer sequences are listed in Supplemental Table 7.
Histone extraction and Western analysis
Histones were acid-extracted as outlined in the Abcam histone extraction protocol. Briefly, HCT116, KI-1, or KI-2 cells were harvested, washed twice with cold PBS, resuspended in cold Triton Extraction Buffer (TEB: 0.5% Triton X-100, 2 mM PMSF, 0.02% NaN3 in PBS), and lysed on ice for 10 min. Nuclei were pelleted by centrifugation at 6500g for 10 min at 4°C, washed once in 0.5 vol of TEB, and incubated overnight in 0.2 N HCl at 4°C to extract histones. Samples were centrifuged at 6500g, and protein concentration in the supernatant determined using the Bradford assay. For Western blot analysis, 5 μg of the histone lysates were electrophoresed on 15% SDS-PAGE gel, transferred to a 0.2-mm nitrocellulose membrane, and incubated with antibodies against histone H3 (Abcam; 1791), histone H4 (Millipore; 05-858), H3K27me3 (Cell Signaling; C36B11), H3K4me3 (Millipore; 07-473), H3K9me3 (Active Motif; 39161), and H4K20me3 (Abcam; 9053), followed by HRP-conjugated secondary and chemiluminescence detection.
Chromatin immunoprecipitation
ChIP with antibodies against histone H3 and H3 modifications were carried out essentially as described in the acetyl-histone H3 immunoprecipitation assay kit from Millipore (17-229) and as previously described (Kapoor-Vazirani et al. 2008), with the exception that 20 μg of sonicated chromatin in Lysis Buffer (1% SDS, 10 mM EDTA, 50 mM Tris at pH 8, 1× Protease inhibitor) was diluted 10-fold in ChIP dilution buffer (0.01% SDS, 1.0% Triton X-100, 2 mM EDTA, 20 mM Tris at pH 8.1, 150 mM NaCl, 1× Protease inhibitor) prior to preclearing and immunoprecipitation. A portion of each sonicated chromatin sample was retained and processed as input DNA and to determine sonication efficiency. Immunoprecipitated DNA was analyzed by real-time PCR using primers specific to the RBP1, UBB, SERPINB5, and PDLIM2 loci (see Supplemental Table 7) as previously described (Kapoor-Vazirani et al. 2008). Starting quantities of immunoprecipitated and input DNA were determined relative to a standard curve generated with MCF7 genomic DNA. Antibodies used were: pan-H3 (Abcam, ab1791), H3K9me3 (Abcam, ab8898), H3K27me3 (Cell Signaling, 9733s), and IgG (Santa Cruz, sc-2027).
Quantitative real-time reverse transcriptase PCR
The mRNA expression levels for genes of interest were determined by quantitative real-time polymerase chain reaction (Q-PCR). For mRNA expression measurement, cDNA content was normalized to that of GAPDH as an internal standard, and fold change was calculated relative to unmodified parental cell controls. Primer sequences are listed in Supplemental Table 7.
Analysis of primary glioblastomas and low-grade gliomas
TCGA genome-wide level 2 DNA methylation data as well as tumor G-CIMP classification were downloaded from the TCGA Data Portal (http://tcga-data.nci.nih.gov/tcga/). Affymetrix gene expression data were downloaded from the TCGA publications site (http://tcga-data.nci.nih.gov/docs/publications/gbm_exp/ [see Broad202.txt file]) (Verhaak et al. 2010). Gene expression values from the TCGA study were log2 transformed to make them comparable to other data. IDH1 status and gene expression subtype were obtained from Supplemental Table S7 of Verhaak et al. (2010) and were further supplemented with data available from the TCGA website. Analyses of changes in gene expression and DNA methylation for specific genes in IDH1WT and IDH1mut tumors utilized only those samples where a definitive IDH1 genotype was available in the TCGA data (n = 61 for Infinium DNA methylation data; n = 117 for Affymetrix gene expression). Data for LGGs were obtained from Turcan et al. (2012). Gene expression (Affymetrix HG 133 2) and DNA methylation (Illumina HumanMethylation450) data were downloaded from gene expression omnibus (GEO: GSE30339). These data sets include DNA methylation for 81 glioma samples (49 G-CIMP+ and 32 G-CIMP−) and gene expression for a subset of 52 glioma samples (36 G-CIMP+ and 16 G-CIMP−).
Analysis of HCT116 ChIP-seq data
ChIP-seq data for histone 3 lysine 4 trimethylation (H3K4me3) and RNA polymerase II (Pol II) in wild-type HCT116 cells were downloaded from the UCSC ENCODE Project website (http://genome.ucsc.edu/ENCODE/downloads.html). Specifically, the H3K4me3 data was generated by the University of Washington, and the RNA Pol II data was generated by Yale University. Reads were mapped to hg18 using Bowtie (v0.12.7) (Langmead et al. 2009) with the following settings: -t -p 6 -m 1. This resulted in 11,346,686 of 18,222,198 (62.2%) of the Pol II and 21,340,297 of 25,929,878 (82.3%) of the H3K4me3 reads uniquely mapping to the hg18 genome. Data was analyzed for enrichment around the Infinium HumanMethylation27 CpG interrogated loci using Hypergeometric Optimization of Motif Enrichment (HOMER v3.10; http://biowhat.ucsd.edu/homer/index.html) (Heinz et al. 2010). Data were displayed using the “image” function in R.
Data access
The microarray data from this study have been submitted to the NCBI Gene Expression Omnibus (GEO) (http://www.ncbi.nlm.nih.gov/geo) under accession no. GSE31134.
Acknowledgments
We thank members of the Yan and Vertino Labs for technical help and helpful discussions. We thank I. Spasojevic, P. Fan, and the DUCC Clinical Pharmacology Lab for quantitative analysis of D-2-HG; K. Abramson and the Duke CHG Molecular Genetics Core for their assistance with the Methylation Array Studies; and the Duke Microarray Core Facility for their assistance with the microarray studies. This project was supported by American Cancer Society Research Scholar Award RSG-10-126-01-CCE, The Pediatric Brain Tumor Foundation Institute Grant, The Southeastern Brain Tumor Foundation Grant, and NCI Grant 5R01-CA140316 (to H.Y.), NCI Grants 2R01-CA077337 and 5R01-CA132065 (to P.M.V.), as well as by the following NIH grants: NINDS Grant 5P50 NS20023 (to D.D.B.), NCI SPORE Grant 5P50 CA108786 (to D.D.B.), and NCI Merit Award R37 CA 011898 (to D.D.B.). H.Y. received a research grant and consulting fee from Sanofi-aventis.
Footnotes
-
↵7 Corresponding authors
E-mail hai.yan{at}dm.duke.edu
E-mail pvertin{at}emory.edu
-
[Supplemental material is available for this article.]
-
Article published online before print. Article, supplemental material, and publication date are at http://www.genome.org/cgi/doi/10.1101/gr.132738.111.
- Received September 28, 2011.
- Accepted August 15, 2012.
This article is distributed exclusively by Cold Spring Harbor Laboratory Press for the first six months after the full-issue publication date (see http://genome.cshlp.org/site/misc/terms.xhtml). After six months, it is available under a Creative Commons License (Attribution-NonCommercial 3.0 Unported License), as described at http://creativecommons.org/licenses/by-nc/3.0/.


