
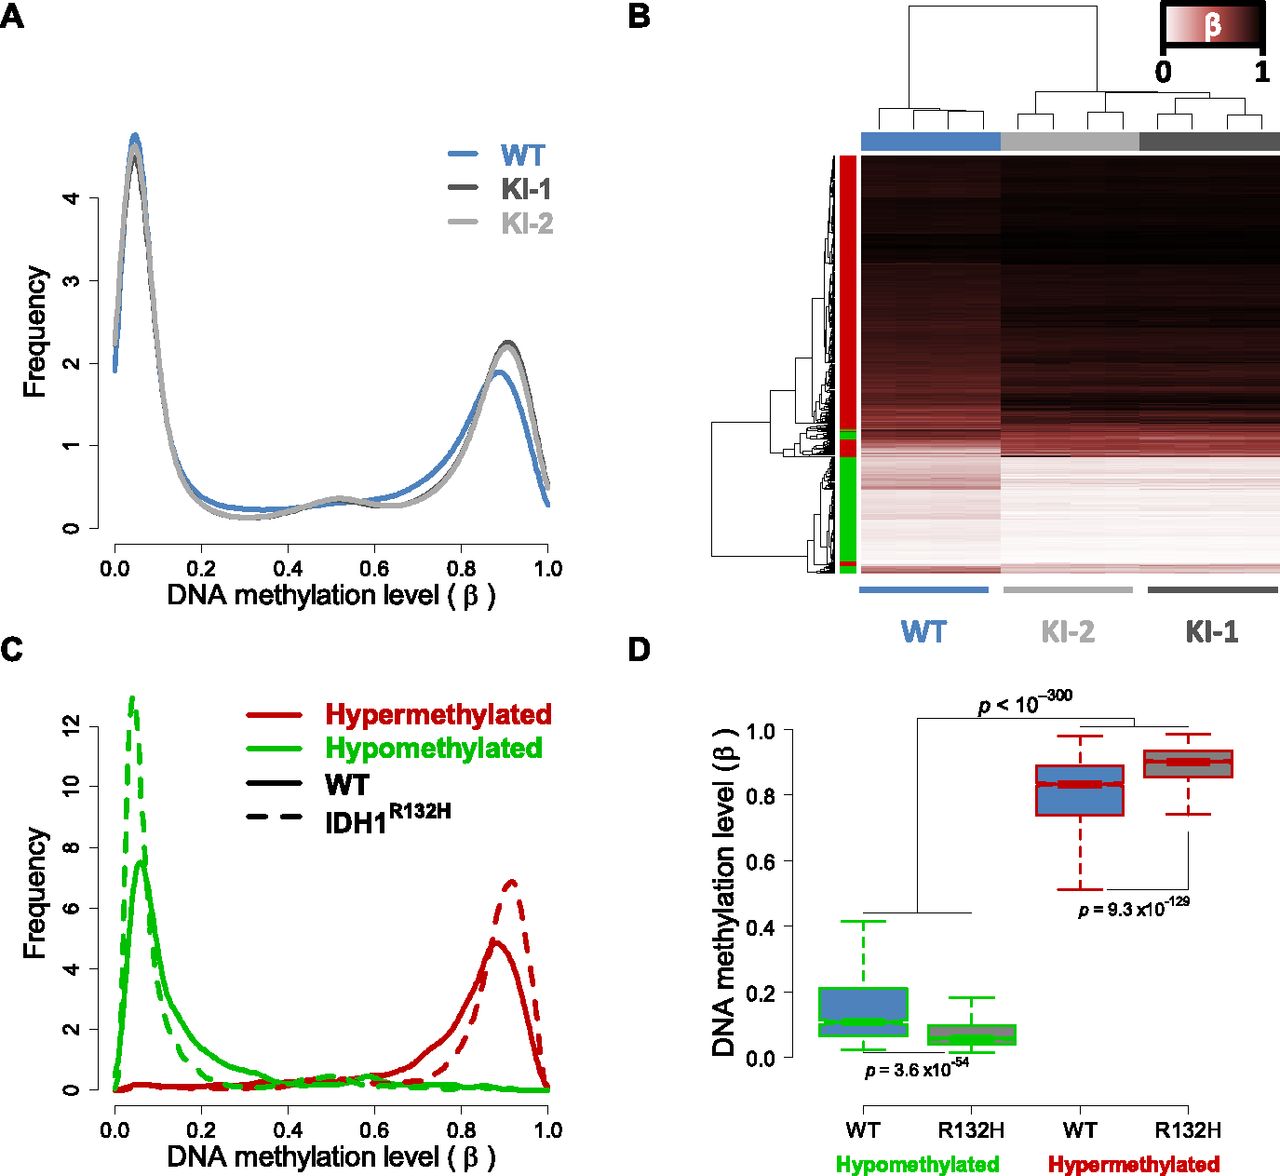
IDH1R132H/WT-induced DNA methylation alterations in HCT116 cells. HCT116-IDH1R132H/WT knock-in clones and parental cells were analyzed using the Illumina HumanMethylation27 assay. (A) Relative DNA methylation (β) distribution for IDH1WT HCT116 parental cells (blue) and IDH1R132H/WT knock-in clones (light- and dark-gray). Frequency (y-axis) is plotted by β such that the total probability (area under the curve) is equal to one. Both knock-in clones show an increase in methylated loci as compared with the wild-type parental cells. (B) Hierarchical clustering of HCT116 samples using IDH1R132H/WT differential loci. Samples are represented by columns and differential CpG loci by rows. Samples are annotated by IDH1 genotype where the wild-type parental cells are in blue and the IDH1R132H/WT knock-ins (KI-1, KI-2) are in light- and dark-gray. CpG loci are annotated by their differential methylation, where red is hypermethylated (FDR < 0.01, n = 2010) and green is hypomethylated (n = 842) in IDH1R132H/WT knock-ins as compared with the wild-type parental line. The color of the heat map represents β, where unmethylated is white (β = 0), partially methylated is burgundy (β = 0.5), and fully methylated is black (β = 1). Clustering is performed with an average clustering algorithm and Euclidean distance dissimilarity metric. (C) Relative DNA methylation distribution for HCT116 IDH1R132H/WT differentially methylated loci. Frequency of the differentially methylated loci are plotted relative to β for hypomethylated (green) and hypermethylated loci (red) in wild-type parental cells (WT: solid line) and IDH1R132H/WT knock-in cells (IDH1R132H: dashed line), such that the total probability (area under any given curve) is equal to one. (D) Box-and-whisker plot of DNA methylation levels for hypomethylated and hypermethylated loci in wild-type (WT) and IDH1R132H/WT knock-in cells (R132H). Loci that were hypermethylated have a higher methylation level in parental cells than loci that were hypomethylated (P < 10−300; Mann-Whitney U-test).


