
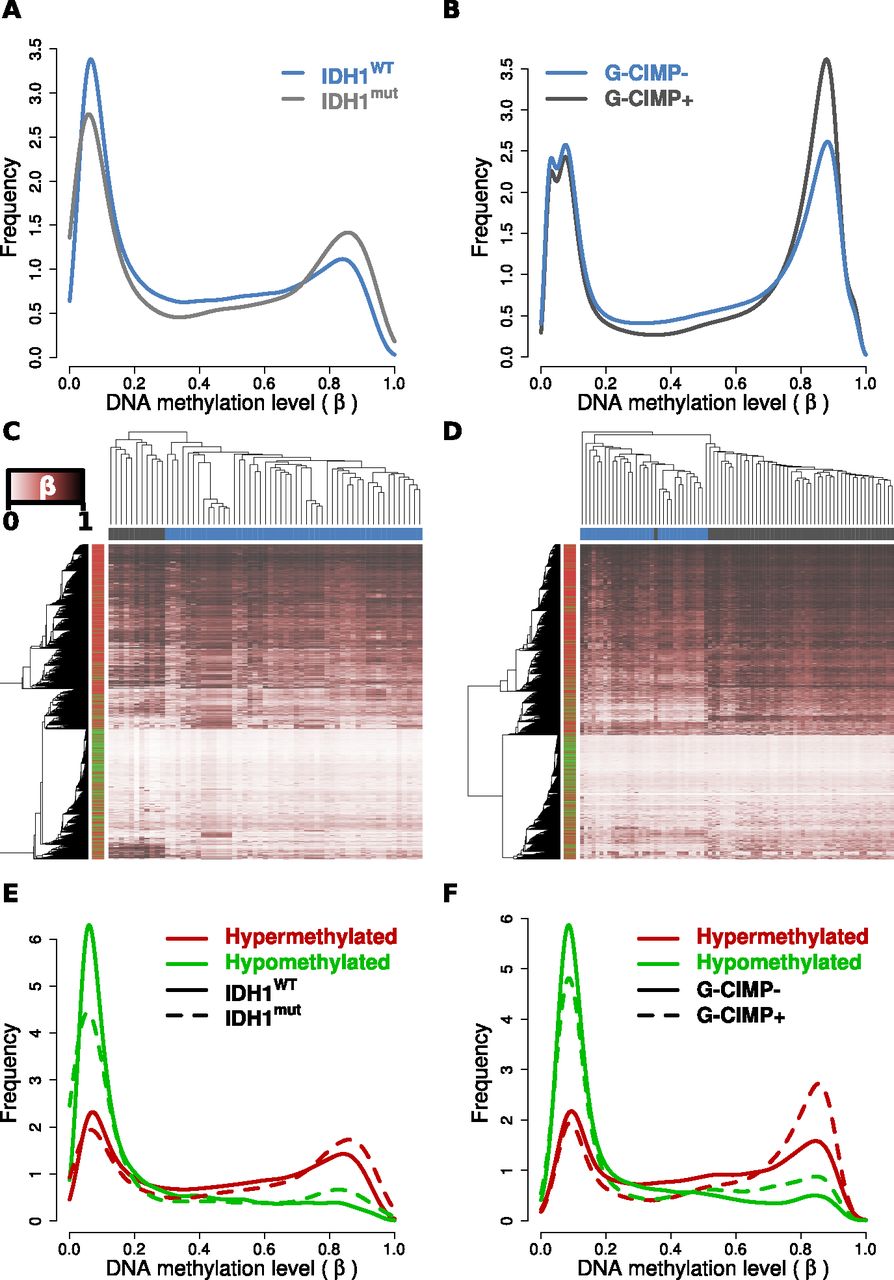
IDH1 mutant and G-CIMP+ gliomas recapitulate the DNA methylation alterations observed in cell line models. (A) Relative DNA methylation (β) distribution for 61 TCGA GBMs with definitive IDH1 mutational status and HumanMethylation27 data available (Noushmehr et al. 2010). Tumors that have wild-type (IDH1WT: blue) and mutated (IDH1mut: gray) IDH1 are drawn separately. (B) Relative β distribution for 81 LGGs from Turcan et al. (2012) classified as G-CIMP negative (G-CIMP-: blue) or positive (G-CIMP+: gray) profiled on the HumanMethylation450 array. Hierarchical clustering of the (C) TCGA GBM and (D) Turcan et al. (2012) LGG cohorts using the 2852 HCT116 IDH1R132H/WT differentially methylated loci separates IDH1WT from IDH1mut and G-CIMP+ from G-CIMP− tumors (P < 0.001). Samples are represented by columns and CpG loci by rows. Samples are annotated by IDH1 genotype for wild-type (blue) and mutated (gray) tumors. CpG loci are annotated by their differential methylation status, where red is hypermethylated and green is hypomethylated in HCT116 IDH1R132H/WT. The color of the heat map represents β, where unmethylated is white (β = 0), partially methylated is burgundy (β = 0.5), and fully methylated is black (β = 1). Clustering was performed with an average clustering agglomerative algorithm and Euclidean distance dissimilarity metric. Relative β distribution of HCT116 IDH1R132H/WT differentially methylated loci in the (E) TCGA GBM and (F) Turcan et al. (2012) LGG cohorts. Frequency of the differentially methylated loci are plotted relative to β for hypomethylated (green) and hypermethylated loci (red) in IDH wild-type or G-CIMP− tumors (solid line) and IDH mutant or G-CIMP+ tumors (dashed line).


