
Coexpression network based on natural variation in human gene expression reveals gene interactions and functions
- 1 Medical Scientist Training Program, University of Pennsylvania, Philadelphia, Pennsylvania 19104, USA;
- 2 Department of Computer and Information Science, University of Pennsylvania, Philadelphia, Pennsylvania 19104, USA;
- 3 Department of Genetics, University of Pennsylvania, Philadelphia, Pennsylvania 19104, USA;
- 4 Department of Pediatrics, University of Pennsylvania, Philadelphia, Pennsylvania 19104, USA;
- 5 Howard Hughes Medical Institute, University of Pennsylvania, Philadelphia, Pennsylvania 19104, USA
Abstract
Genes interact in networks to orchestrate cellular processes. Analysis of these networks provides insights into gene interactions and functions. Here, we took advantage of normal variation in human gene expression to infer gene networks, which we constructed using correlations in expression levels of more than 8.5 million gene pairs in immortalized B cells from three independent samples. The resulting networks allowed us to identify biological processes and gene functions. Among the biological pathways, we found processes such as translation and glycolysis that co-occur in the same subnetworks. We predicted the functions of poorly characterized genes, including CHCHD2 and TMEM111, and provided experimental evidence that TMEM111 is part of the endoplasmic reticulum-associated secretory pathway. We also found that IFIH1, a susceptibility gene of type 1 diabetes, interacts with YES1, which plays a role in glucose transport. Furthermore, genes that predispose to the same diseases are clustered nonrandomly in the coexpression network, suggesting that networks can provide candidate genes that influence disease susceptibility. Therefore, our analysis of gene coexpression networks offers information on the role of human genes in normal and disease processes.
The functions of many human genes are unknown. It is not unusual that when one searches the literature on a gene, one fails to find any papers that provide information on its biological roles. Identifying gene function is difficult, especially if no hints, such as homologies to known genes, are available to direct the search. However, since genes work by interacting with other genes, we may learn about their functions through their neighboring genes (Stuart et al. 2003; Ayroles et al. 2009). Identifying gene function is increasingly important; in the last several years, genome-wide association studies (GWAS) have identified DNA variants that are associated with common complex diseases. But for many of these studies, the functional links between the susceptibility genes and the diseases are unknown.
In this study, we used correlations in expression levels of more than 8.5 million human gene pairs in immortalized B cells from three data sets to infer gene coexpression networks. The resulting gene networks were based on correlations between genes that were found reproducibly in the three data sets. This provided us with gene networks in which we had high confidence in the gene correlations. We then used the networks to identify key biological processes and interactions among those processes in our cells. Then, we identified the functions of 36 human genes with no known functions and four genes that have been implicated in GWAS as susceptibility genes for common human diseases, including IFIH1, which was recently found to be associated with type 1 diabetes.
Results
Gene coexpression network
In order to construct coexpression networks, we took advantage of normal variation in gene expression (Cheung et al. 2003) among unrelated individuals. We measured expression levels of genes using microarrays. We focused on 4238 genes in immortalized B cells of 295 normal individuals in the Center d'Étude du Polymorphisme Humain (CEPH) (Dausset et al. 1990) and the International HapMap collections (The International HapMap Consortium 2005). These cells have been used for various gene mapping and functional studies (Aggarwal et al. 1985; Morley et al. 2004; Stranger et al. 2007). Our samples include 148 unrelated grandparents in the CEPH-Utah pedigrees, 43 Han Chinese in Beijing (CHB), 44 Japanese in Tokyo (JPT), and 60 Yoruba in Ibadan, Nigeria (YRI) from the International HapMap Project. Since the expression levels of most genes are similar between the CHB and JPT samples (Spielman et al. 2007), we combined the samples as “ASN” for this analysis, as was also done by the International HapMap Project (The International HapMap Consortium 2005). First, we analyzed gene expression data from each population separately, and computed three population-specific correlations for each of the 8,978,203 pairs of genes (4238 choose 2). Then for each gene pair, we compared the three population-specific correlations using Fisher's test of homogeneity (Fig. 1; Sokal and Rohlf 1995) and identified gene pairs that were similarly correlated in the three data sets. The results showed that <1% of gene pairs differed significantly (Pc < 0.05) in correlation among the three populations (Supplemental Table 1); most gene pairs (>99%) were similarly correlated in gene expression among populations. For gene pairs whose correlations did not differ significantly among populations, we summarized the extent of their correlations by calculating the weighted average correlation, weighted by the number of individuals in each population (Fig. 1). Among the correlated genes are ones that are known to interact functionally. For example, BTK encodes Bruton agammaglobulinemia tyrosine kinase (Vetrie et al. 1993) that inhibits FAS (Vassilev et al. 1999), a pro-apoptotic gene. BTK and FAS are negatively correlated in expression in all three populations (rCEPH-Utah = −0.52; rASN = −0.47; rYRI = −0.52; test of homogeneity, P = 0.87); the weighted average correlation is −0.51 (Fig. 1A). Similarly, UMPS and CTPS encode the enzymes UMP synthase (Suttle et al. 1988) and CTP synthase (Yamauchi et al. 1990), which are essential for the production of CTP nucleotides used in the synthesis of DNA. These two genes are positively correlated in the three populations (rCEPH-Utah = 0.69; rASN = 0.64; rYRI = 0.68; test of homogeneity, P = 0.80), and the weighted average correlation is 0.67 (Fig. 1B). Next, we used the weighted average correlations of our gene pairs to construct gene coexpression networks by placing connections between genes with an average correlation exceeding different thresholds (Table 1). A network formed by gene pairs correlated at |r| > 0.50 consisting of 44,872 gene pairs and encompassing 3056 genes is shown in Figure 2A.
Properties of networks using different correlation thresholds
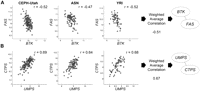
Examples of gene pairs that are significantly and reproducibly correlated. (A) BTK and FAS are negatively correlated in expression across unrelated individuals from three different populations. The weighted average correlation between BTK and FAS is −0.51. (B) Similarly, UMPS and CTPS are positively correlated in expression and are connected in the coexpression network. Expression levels for these genes are provided on the axes and given in log2-transformed intensity units. The population-specific correlation coefficient is given in the upper-right-hand corner of each plot.
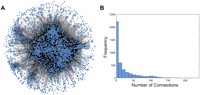
Coexpression network where connections are placed between genes that are correlated at |r| > 0.50. (A) The coexpression network includes 44,872 connections among 3056 genes. This network consists mainly of a giant connected component. (B) A histogram showing the distribution of connections in the coexpression network.
Properties of human gene coexpression networks in B cells
We examined the topologies of the resulting human gene coexpression networks (Table 1). Although we present properties of coexpression networks constructed using various thresholds in Table 1, in this study we focused on the coexpression network where connections were placed between genes that were correlated at |r| > 0.50 in order to facilitate discussion of a representative subset of the data (Fig. 2A). At this threshold, we expect very few false-positive correlations between genes; the chance that genes are correlated at |r| > 0.50 in our three samples is very small (P < 10−10). We found that this network shares properties of other biological networks (Table 1). The scale-free topology criterion (Zhang and Horvath 2005) is 0.84, which suggests that the network is comprised of many genes with few connections, but a few genes have many connections. In addition, the clustering coefficient (Watts and Strogatz 1998) and another network parameter, gamma (Barabasi and Albert 1999), are within the ranges expected for biological networks (Table 1; Jordan et al. 2004; Zhang and Horvath 2005).
As indicated by the scale-free topology criterion, our network consists of many genes with relatively few connections (mean = 29, median = 14), but a few genes have many more than the expected number of connections (>200). This is illustrated by the distribution of connections in the network (Fig. 2B). Eighty percent (35,912/44,872) of the connections in the network had at least one end point incident on 19% (588/3056) of genes. Since these genes are highly connected to other genes in the network, they can influence the expression of many other genes.
In addition to calculating various network parameters, we assessed if our networks reflect known biological interactions by examining the functions of neighboring genes. We found that gene pairs that are correlated at |r| > 0.50 shared Gene Ontology (GO) (Ashburner et al. 2000) annotations significantly (P < 10−16) more than expected by chance. Among the 44,872 gene pairs correlated at |r| > 0.50, 4936 (11%) have the same GO annotations compared to a sampling of 10,000 randomly chosen gene pairs where only 504 (5%) gene pairs shared the same GO annotations. This analysis requires gene pairs to have identical GO annotations. Genes in the same functional pathways do not always share the same GO annotations. But despite this stringent criterion, a significant result was obtained. This suggests that neighboring genes in the networks are often related functionally.
We also examined chromosomal locations of gene pairs correlated |r| > 0.50. We found 126 gene pairs (Supplemental Table 2) correlated at |r| > 0.50 were located within 500 kb of each other, and this is significantly (P = 1.8 × 10⁻⁹) more than the 47 ± 7 pairs in the randomly paired gene sets. These findings suggest that genes that are located close to each other on a chromosome tend to be significantly correlated in gene expression.
Biological processes in B cells
To examine the subnetworks among the larger network, we parsed the network into 3056 “local subnetworks.” Each subnetwork consists of a “central gene” and genes that connect directly to the central gene based on correlation threshold (i.e., “neighbors” of the central gene). We then examined the functions of genes in each of the subnetworks using GO. Of the 3056 subnetworks, 2087 (68%) subnetworks showed significant enrichment for one or more functional categories (Table 2). These categories include basic cellular processes, such as RNA processing and protein folding, as well as cell-type-specific processes, such as antigen processing/presentation and response to DNA damage, which reflect the functions of B cells. Other studies have also found that DNA damage repair is part of the normal developmental process of lymphocytes (Bredemeyer et al. 2008), and processes such as protein folding are enriched in B cells (Dixon et al. 2007).
Biological processes active in B cells
Some functional groupings are found together in many subnetworks. For example, a subnetwork may include genes that play a role in RNA processing and those that participate in protein folding. We identified six pairs of functional groupings that are found more often than expected by chance within the same subnetworks (Table 3). Among the 2087 subnetworks, 102 subnetworks include genes that play a role in glycolysis and translation, compared to only 37 such subnetworks in a random network (P = 4.0 × 10⁻⁸). These findings suggest that processes such as glycolysis and translation are functionally related or coordinately regulated in B cells.
Biological processes that frequently co-occur within subnetworks
Predicting gene functions using coexpression networks
Next, we used the networks to determine gene functions. For each subnetwork, we used the functions of the neighboring genes to predict the functions of the central gene. First, we examined central genes with known functions and asked whether our analysis recapitulates those recognized roles. Among the 2087 subnetworks that showed enrichment of one or more functional categories, 1824 central genes were annotated by GO. The functions of 368 (20%) of these genes were the same between GO and our prediction. By comparison, in a random network (see Methods), the overlap between GO and our prediction is only 8% (143/1789) (P < 10−16). An example is RPL35, which is part of the large ribosomal subunit that is involved in protein translation (Uechi et al. 2001). In our network, 69 of its 114 neighbors are also involved in translation (Pc = 10−73). Another example is TOP2A, a topoisomerase that alters topological states of DNA during replication (Tsai-Pflugfelder et al. 1988); 32 of its 66 neighbors are involved in mitosis (Pc = 10−41). In both cases, if we did not know the functions of RPL35 and TOP2A, we would have been able to assign their functions correctly based on the function of their neighbors.
We extended these analyses from GO to BIND protein–protein interactions (Bader et al. 2001) and KEGG pathways (Kanehisa and Goto 2000) databases. While fewer central genes (135 in BIND, 167 in KEGG) could be analyzed in these databases compared to GO (1824 genes), they allowed us to examine interactions and pathways. The interactions of 46% (62/135) of genes were the same between BIND and our prediction, whereas for a random network, only 24% (25/105) of genes were the same (P = 4.1 × 10⁻⁴). The pathways for 61% (102/167) of genes were the same between KEGG and our prediction, compared to only 20% (24/120) in a random network (P = 4.6 × 10⁻¹²). For example, NDUFA3 encodes an NADH dehydrogenase subcomplex. When examining the direct neighbors of NDUFA3, we observe an overrepresentation of genes that participate in the “oxidative phosphorylation” pathway (Pc = 0.002). These results suggest that the coexpression network can reveal gene interactions and functions.
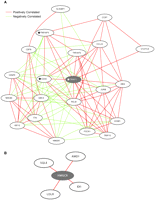
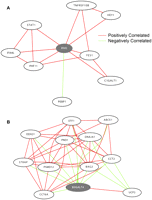
These results encouraged us to use this approach to predict the functions of poorly characterized genes in our coexpression network. We defined poorly characterized genes as genes with no PubMed articles and no Entrez Gene description. There are 66 such poorly characterized genes in our network. Among these 66 genes, we were able to predict the functions of 36 genes (55%); their identity and predicted functions are listed in Table 4. For the remaining genes, we did not observe evidence of functional enrichment. CHCHD2 is a gene that we were able to characterize. CHCHD2 is connected to 83 genes in the coexpression network that are enriched for genes that are involved in glycolysis (Pc = 0.003) and translation (Pc < 10−70) (Fig. 3) by GO annotation and also by KEGG pathway analysis (“glycolysis/gluconeogenesis” [P = 0.04] and “ribosome” [P = 2.1 × 10−67]). Examination of the protein domains of CHCHD2 reveals that it has a coiled-coil–helix–coiled-coil–helix domain that is structurally homologous to a yeast protein, MRP10 (Marchler-Bauer et al. 2007). MRP10 is essential for translation of mitochondrial genes in yeast (Jin et al. 1997). Together, these findings suggest that CHCHD2 plays a role in translation in human cells. Another example is TMEM111, which is connected to 17 genes in the coexpression network. These genes are enriched for several GO biological processes including endoplasmic reticulum (ER) to Golgi vesicle-mediated transport (Pc = 0.05), secretory pathway (Pc = 0.03), and macromolecule localization (Pc = 0.03) (Fig. 4A). Furthermore, by KEGG pathway analysis, the TMEM111 coexpression network showed enrichment for genes in “N-glycan biosythesis” (P = 0.04), further suggesting that TMEM111 plays a role in the secretory pathway in the endoplasmic reticulum. To validate this prediction, we treated immortalized B cells from 10 unrelated individuals with tunicamycin, an ER stress-inducing agent, and measured the expression level of TMEM111. We found a significant (P < 10−5) increase in the expression level of TMEM111 in response to tunicamycin-induced ER stress (Fig. 4B). The expression levels of five ER-associated neighbors of TMEM111 (COPB2, TMED10, SSR2, DNAJB9, RPN2) were also significantly increased (P < 10−5) in response to ER stress. These results support our prediction that TMEM111 plays a role in ER-mediated secretory pathways.
Predicted functions of poorly characterized genes based on the functions of their neighboring genes
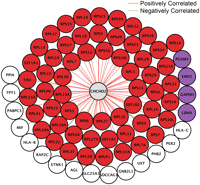
CHCHD2 subnetwork. This subnetwork consists of CHCHD2 (center) and its 83 direct neighbors. Genes colored in red are known to play a role in translation. Genes colored in purple are involved in glycolysis.
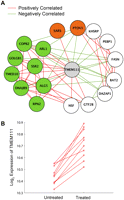
TMEM111 subnetwork. (A) This subnetwork consists of TMEM111 (center, gray) and its 17 direct neighbors. Genes colored in green are known to function in the secretory pathway or the endoplasmic reticulum. Genes colored in orange are involved in tRNA aminoacylation. (B) Log2 expression of TMEM111 in 10 unrelated individuals before and after treatment with tunicamycin.
Predicting the functions of genes implicated in genome-wide association studies (GWAS)
Of the 4238 genes in our network, 201 have been associated with phenotypes in GWAS (Hindorff et al. 2009a). Of these, 140 genes were connected to at least one other gene in our coexpression network (Supplemental Fig. 1; http://www.geneticsofgeneexpression.org/network/—select the tab labeled “GWAS”).
We first examined genes whose roles in disease susceptibility are fairly well understood. We found that the networks confirm the known disease mechanisms and include other susceptibility genes for those diseases. For example, TRAF1 was identified as a susceptibility gene for rheumatoid arthritis (Plenge et al. 2007). TRAF1 mediates TNF-stimulated signal transduction and plays a role in apoptosis (Tsitsikov et al. 2001). In our coexpression network, TRAF1 is connected to other apoptotic genes such as CTNNAL1, HDAC1, CDC2, STAT5A, TNFRSF8, NFKBIA, BUB1B, TOP2A, IFI16, CD40, and TNFAIP3 (Pc = 4.7 × 10⁻⁴) (Fig. 5A). In the TRAF1 subnetwork, two other genes, TNFAIP3 and CD40, have also been implicated in rheumatoid arthritis (Raychaudhuri et al. 2008). These three genes, TNFAIP3, CD40, and TRAF1, modulate the transcription factor activity of NFKB, a critical player in the immune response (Perkins 2007). Another example is HMGCR, which encodes HMG-CoA reductase, a target of statin drugs (Endo et al. 1977). The HMGCR subnetwork is enriched for genes that participate in sterol metabolic processes (Pc = 6.6 × 10⁻⁵) (Fig. 5B). LDLR is in the HMGCR subnetwork; genetic variants in LDLR are associated with susceptibility to high cholesterol levels (Kathiresan et al. 2008). These results imply that the coexpression network provides candidate susceptibility genes for complex diseases.
TRAF1 and HMGCR subnetworks. (A) This subnetwork consists of TRAF1 (center, gray) and 20 direct neighbors. To simplify the figure, only the top 20 genes that are most correlated in expression with TRAF1 are shown even though TRAF1 has 56 neighbors. CD40, TNFAIP3, and TRAF1 have been implicated in the pathogenesis of rheumatoid arthritis and are marked with star symbols. (B) This subnetwork consists of HMGCR (center, gray) and its direct neighbors.
With the above findings, we explored other genes that have been implicated in GWAS, but whose roles in disease pathogenesis are unknown. Both common (Todd et al. 2007) and rare (Nejentsev et al. 2009) variants of IFIH1 have been implicated in the predisposition to type 1 diabetes (T1D). In our coexpression network, IFIH1 is positively correlated with YES1 (rCEPH-Utah = 0.60; rASN = 0.55; rYRI = 0.56), a tyrosine kinase that facilitates glucose transport by mediating SLC2A4 (also known as GLUT4) translocation (Fig. 6A; Imamura et al. 2001). To determine if YES1 and IFIH1 are functionally related, we tested whether YES1 influences the expression of IFIH1. Since our samples are those in the CEPH and HapMap collections, high-density SNP genotypes are available on all samples (The International HapMap Consortium 2003, 2005). We regressed the expression level of IFIH1 on genotypes of SNPs in YES1 and found that variants in YES1 are significantly (rs7232858, P = 0.01) associated with the expression level of IFIH1. We also noted that an SNP (rs3786347) in YES1 is nominally significant in a recent meta-analysis of type 1 diabetes (P = 0.02) (Hulbert et al. 2007). This result suggests that IFIH1 influences the susceptibility of T1D by playing a role in glucose transport. Studies have demonstrated that defects in glucose transport precede the onset of overt type 1 diabetes and that such defects may play a role in the pathogenesis of diabetes (Unger 1991).
IFIH1 and B3GALT4 subnetworks. (A) This subnetwork consists of IFIH1 (center, gray) and eight direct neighbors. IFIH1 has been implicated in the pathogenesis of type I diabetes. (B) This subnetwork consists of B3GALT4 (gray) and its direct neighbors. To simplify the figure, only the top 11 genes that are most correlated in expression with B3GALT4 are shown.
Another example is B3GALT4, which has been implicated in influencing LDL cholesterol levels (Willer et al. 2008). B3GALT4 encodes a glycosyltransferase. While it is widely expressed in multiple tissues, it is only known to act on ganglioseries glycolipid biosynthesis. The role of B3GALT4 in influencing LDL cholesterol levels remains poorly understood, although it is hypothesized to glycosylate lipid receptors (Willer et al. 2008). In our coexpression network, B3GALT4 is connected to 30 genes, and five of them play a role in protein folding (Pc = 0.002) (Fig. 6B). This suggests that B3GALT4 may influence cholesterol levels by affecting the folding of proteins such as the LDL receptor. To further examine the role of B3GALT4 in protein folding, we analyzed the expression of B3GALT4 in cells with tunicamycin-induced ER stress. We found that B3GALT4 was significantly increased (P = 0.03), suggesting that B3GALT4 plays a role in the unfolded protein response. These findings further support previous studies that have demonstrated links between protein folding and cholesterol metabolism (Lee et al. 2008).
Human gene coexpression website
In this study, we examined more than 8.5 million pairs of genes. The results we reported are summaries of key points. To allow readers to explore the data, we have developed a website, http://www.geneticsofgeneexpression.org/network/, where one can input a gene of interest and find genes that are correlated with it. The underlying gene expression data used to calculate the correlations are provided in graphical and tabular forms on this website.
Discussion
In this study, we took advantage of the extensive variation in expression levels of human genes to construct gene coexpression networks. We analyzed gene expression data from one cell type, immortalized B cells, of normal individuals. In contrast, previous studies have pooled data from normal and diseased tissues to construct coexpression networks; the resulting interactions may not represent those in particular cells and/or tissues. To construct networks, we used gene pairs that are correlated in three data sets in order to minimize spurious correlations.
Our analysis shows that correlated genes often have similar functions. This allowed us to identify the functions of unknown genes based on functions of their neighbors in coexpression networks. Using this approach, we characterized the functions of 38 genes with no known functions, including those that were implicated in GWAS as disease susceptibility genes. One of these genes is TMEM111; we predicted that it plays a role in the endoplasmic reticulum. We confirmed this prediction by showing that its expression level is responsive to tunicamycin-induced ER stress. Another example is IFIH1, a susceptibility gene for type 1 diabetes. In our network, the expression level of IFIH1 is significantly correlated with YES1, a kinase that is involved in GLUT4-mediated glucose transport. We found that individuals with different polymorphic forms of YES1 have significantly (P = 0.01) different levels of IFIH1, suggesting that IFIH1 may influence susceptibility to diabetes through its role in glucose transport.
In addition to allowing prediction of gene functions, the coexpression networks provide candidate disease susceptibility genes. There is evidence for non-random clustering of disease susceptibility genes in the networks. The TRAF1 and HMGCR subnetworks include more susceptibility genes for rheumatoid arthritis and cholesterol levels, respectively, than expected by chance (P < 10−6). Among the 4238 genes examined in this study, seven genes have been implicated in rheumatoid arthritis (Hindorff et al. 2009b). Three of these genes are part of the TRAF1 subnetwork, which is 30 times what we would expect by chance based on the hypergeometric distribution (P = 9.9 × 10⁻⁷). This suggests that although the remaining genes in these subnetworks have not been implicated as susceptibility genes, some are likely to be associated with increased risks of rheumatoid arthritis.
Since the disease susceptibility genes that are in a coexpression network often participate in the same functional pathways, interactions among these genes can be studied. Many of the sequence variants identified in gene mapping studies, such as genome-wide association, have only modest effects. While the contributions of each gene to disease risk may be small, their contributions in aggregate are likely to be more substantial. Thus, understanding their interactions is important for quantifying a person's risk of developing a disease and for characterizing disease mechanisms.
In this study, we focused on B cells from normal individuals. Similar analysis of coexpression networks for other human cell types will elucidate the functions of other human genes and provide additional candidate disease susceptibility genes.
Methods
Samples and gene expression measurements
Immortalized B cell lines were obtained from Coriell Cell Repositories. Samples are those from individuals from four populations: European-derived individuals from the Utah pedigrees of the Center d'Étude du Polymorphisme Humain collection (CEPH-Utah), N = 148; Han Chinese in Beijing, China, N = 43 (CHB); Japanese in Tokyo, Japan (JPT), N = 44; and Yoruba in Ibadan, Nigeria (YRI), N = 60. The CHB and JPT samples were combined as “ASN.” We first collected samples from the CEPH-Utah collection, the majority of which were processed from October 2002 through 2004. We then analyzed the HapMap samples (ASN and YRI) when they became available; these were processed in 2005 and 2006. However, we do not consider batch effects to be a major concern for our analyses, since samples from each population were analyzed separately. Furthermore, batch effects would have resulted in significant differences between populations, which we did not observe in our analyses. Gene expression was measured as described previously (Cheung et al. 2005; Spielman et al. 2007; Price et al. 2008). Briefly, expression levels of genes were measured using Human Genome Focus Arrays (Affymetrix). RNA was extracted using the RNeasy Mini-Kit (QIAGEN), amplified, labeled, and hybridized as per the manufacturer's instructions. Gene expression signals were normalized using the MAS 5.0 algorithm (Affymetrix). Expression intensity was scaled to 500 and log2-transformed. The NCBI GEO accession number for this collection of microarray data is GSE12526. For a subset of the data, we also normalized the expression signals using RMA (Irizarry et al. 2003). We compared the gene correlations between MAS5.0 normalized and RMA normalized data; among the 8.9 million gene pairs, only 7515 (0.8%) gene pairs differed significantly (Pc < 0.05). Thus, for the remaining analyses, we used the MAS 5.0 normalized data.
Gene correlation and construction of the coexpression network
Of the 8793 genes on the microarray, 4238 (48%) genes were called “present” or “marginal” by the MAS 5.0 algorithm (Affymetrix) in at least 80% of individuals in one or more populations, and those genes were considered as “expressed” in our cells; we focused on these expressed genes for all analyses in this project. For all possible pairs of genes, we calculated the Pearson correlation of expression levels across individuals within a population. This calculation was done separately for each population. Fisher's test of homogeneity (Sokal and Rohlf 1995) was used to identify correlations that were significantly different (Bonferroni corrected, P < 0.05) among the three populations (CEPH-Utah, ASN, and YRI). For gene pairs that were not significantly different, we estimated weighted/common correlation coefficients (Sokal and Rohlf 1995). As an alternative to taking the weighted/common correlation, we examined correlation coefficients upon pooling data from the populations, but found that this did not change the results dramatically. Then, correlated gene pairs were connected to construct a coexpression network. We constructed multiple networks using different thresholds and measured topological properties of the resulting networks. Correlations and topological properties of the network were analyzed using MATLAB (The MathWorks, Inc.). Networks were represented as adjacency matrices in MATLAB, and standard MATLAB functions were used to calculate the number of genes, the number of connections, and the distribution of connections in each network. MATLAB functions for determining the clustering coefficient (Watts and Strogatz 1998), gamma (Barabasi and Albert 1999), and scale-free topology criteria (Zhang and Horvath 2005) were implemented as previously described. Code will be provided upon request. Figures of the resulting networks were drawn using Cytoscape 2.6.0 (Shannon et al. 2003) or GraphViz (Ellson et al. 2002).
Random gene pairs and networks
Random gene pairs were genes that were paired randomly as opposed to being paired based on correlation patterns.
Random networks were constructed as described previously (Maslov and Sneppen 2002). MATLAB code provided by S. Maslov (http://www.cmth.bnl.gov/∼maslov/matlab.htm) was used to generate random networks. Briefly, random networks consisted of the same 4238 genes as in the observed networks and were constructed to have the same topology as observed networks. To do this, a gene in the random network had the same number of connections as in the observed network, but its connections to other genes were random instead of being based on correlation patterns.
Enrichment analysis
Enrichment analysis of Gene Ontology Biological Processes was performed using BiNGO (version 2.3) (Maere et al. 2005) with the default parameters except that the organism was set to “Homo sapiens.” Enrichment was assessed using the hypergeometric test with Benjamini-Hochberg correction (Benjamini and Yekutieli 2001). Significant enrichments were those with Pc < 0.05. Enrichment analysis for BIND protein interactions or KEGG Pathways was done using DAVID (Dennis et al. 2003; Huang da et al. 2009). Significant enrichments were those with Pc < 0.05 (using Benjamini-Hochberg correction).
Co-occurrence of biological processes
To identify processes that were commonly found together among subnetworks, we used the Apriori algorithm for frequent item set mining (Agrawal et al. 1993), an implementation of which was provided by C. Borgelt (http://www.borgelt.net/apriori.html). The default parameters were used except that we focused our analysis on pairs of biological processes and lowered the threshold of minimal support to identify pairs of processes that occurred with a frequency of 0.1% or more (in at least two subnetworks). The output of this program lists all pairs of processes and how often they were observed together in the subnetworks. We examined this output to identify processes that are different (e.g., translation differs from glycolysis), noted the number of times that these different pairs were observed among subnetworks, and compared the observed counts with counts from a random network using a χ2 test.
Tunicamycin treatment
The following cell lines were treated with 4 μg/mL tunicamycin (T7765; Sigma) in DMSO or only with 0.5% DMSO (untreated) for 8 h: GM12146, GM12239, GM12144, GM12145, GM07022, GM07056, GM06994, GM07000, GM07034, and GM07055. RNA was extracted using the RNeasy Mini-Kit (QIAGEN), amplified, labeled, and hybridized as per the manufacturer's instructions. Expression levels of genes were measured using Human Genome U133 Plus 2.0Arrays (Affymetrix). Gene expression signals were normalized using the RMA algorithm (Irizarry et al. 2003). Changes in gene expression were assessed by t-test.
Databases
A Catalog of Published Genome-Wide Association Studies database was used to identify genes that have been implicated in genome-wide association studies (http://www.genome.gov/26525384) (Hindorff et al. 2009a).
Entrez programming utilities (Perl scripts) were used to access information in PubMed (http://www.ncbi.nlm.nih.gov/pubmed/, date accessed: March 2, 2009) and Entrez Gene databases (http://www.ncbi.nlm.nih.gov/sites/entrez, date accessed: March 2, 2009). These databases were used to identify genes with no entry in the “Description” field of the Entrez Gene database and no articles in PubMed when querying with the gene symbol. The resulting gene list was manually examined to confirm that these genes were poorly characterized and there was nothing published about their functions. Manual examination involved using the “Related Articles in PubMed” link for each gene on the Entrez Gene website (which allowed us to identify and exclude genes in our list that are well studied but are reported in the literature using an alternative gene symbol), and the GeneCards database (Rebhan et al. 1998).
Acknowledgments
We thank B. Dombroski for data on cells treated with tunicamycin, K. Halasa for developing the website, and S. Jensen and A. Bruzel for comments and discussion. This work is supported by grants from the National Institutes of Health (GM081930 to R.S.S. and V.G.C., T32 GM008216 to R.R.N.) and the Howard Hughes Medical Institute (to V.G.C.).
Footnotes
-
↵6 Richard S. Spielman passed away suddenly in April 2009 during the preparation of this article.
-
↵7 Corresponding author.
E-mail vcheung{at}mail.med.upenn.edu; fax (267) 426-9734.
-
[Supplemental material is available online at http://www.genome.org. Our data and the resulting networks are available at http://www.geneticsofgeneexpression.org/network/. Microarray data from this study have been submitted to Gene Expression Omnibus (http://www.ncbi.nlm.nih.gov/geo) under accession no. GSE12526.]
-
Article published online before print. Article and publication date are at http://www.genome.org/cgi/doi/10.1101/gr.097600.109.
-
- Received June 19, 2009.
- Accepted August 13, 2009.
- Copyright © 2009 by Cold Spring Harbor Laboratory Press


