
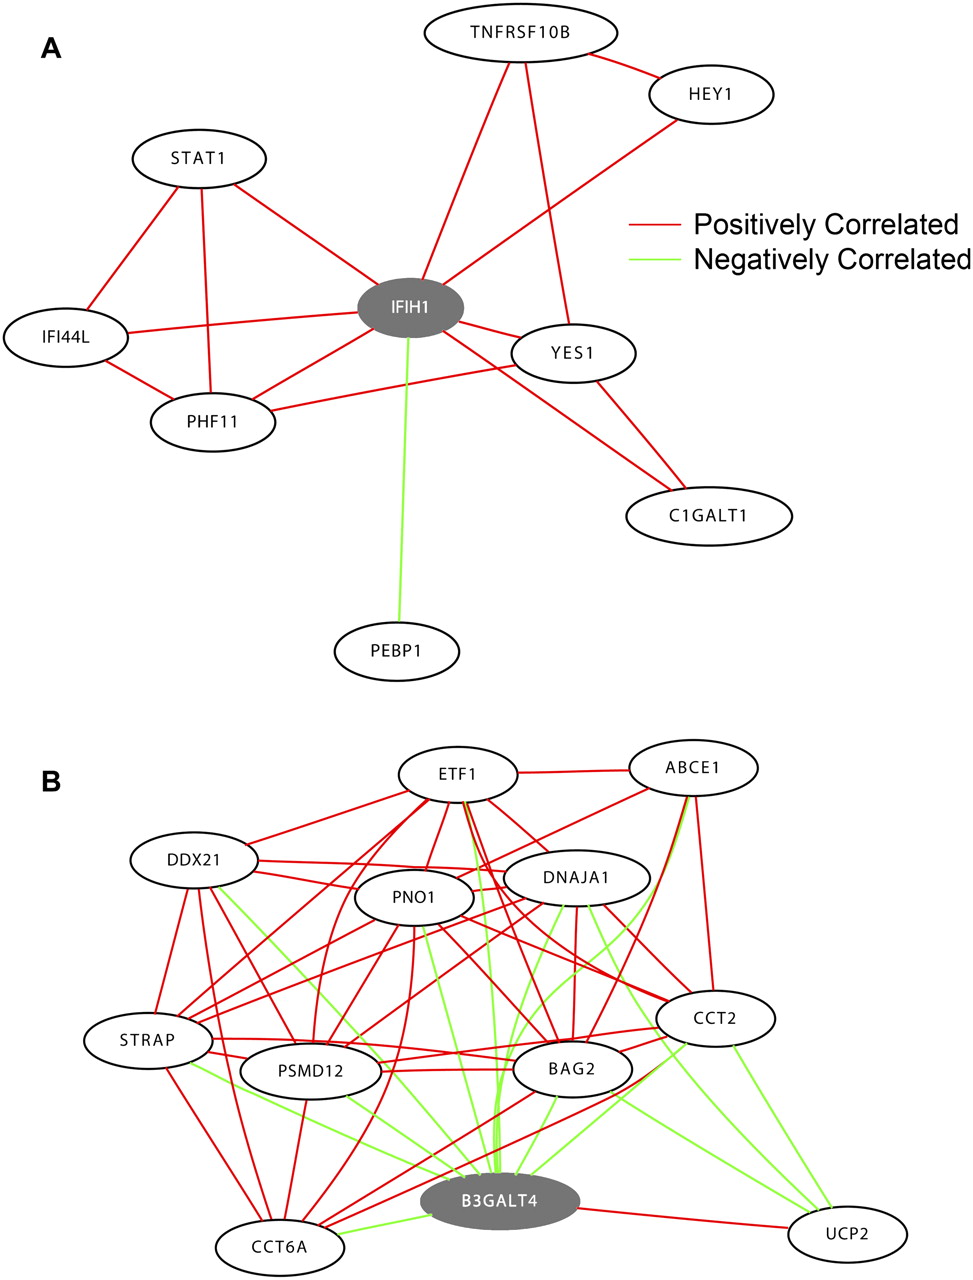
Figure 6.
IFIH1 and B3GALT4 subnetworks. (A) This subnetwork consists of IFIH1 (center, gray) and eight direct neighbors. IFIH1 has been implicated in the pathogenesis of type I diabetes. (B) This subnetwork consists of B3GALT4 (gray) and its direct neighbors. To simplify the figure, only the top 11 genes that are most correlated in expression with B3GALT4 are shown.


