
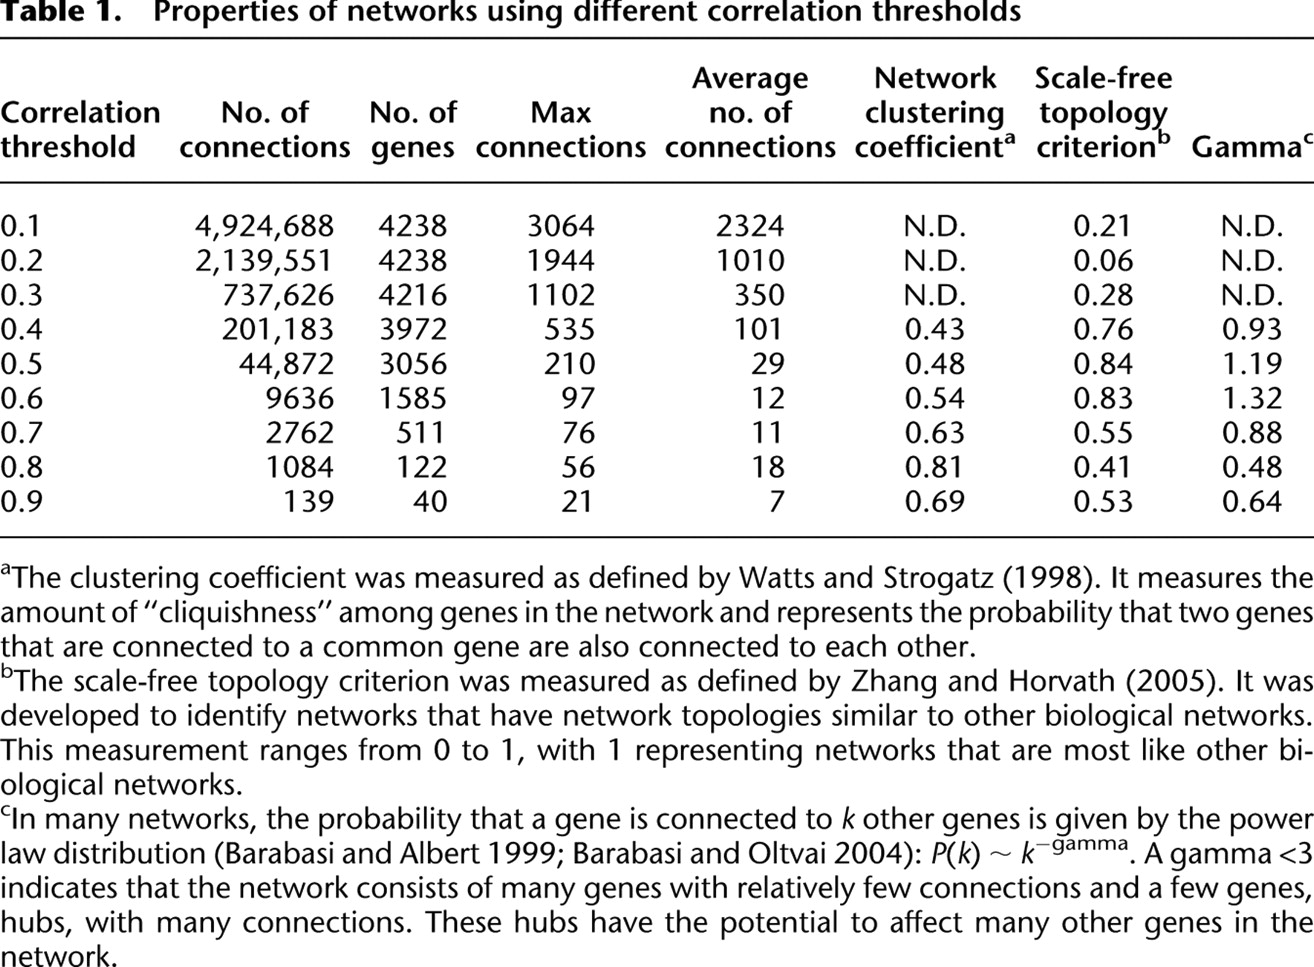
Properties of networks using different correlation thresholds
Click on table to view larger version.
-
aThe clustering coefficient was measured as defined by Watts and Strogatz (1998). It measures the amount of “cliquishness” among genes in the network and represents the probability that two genes that are connected to a common gene are also connected to each other.
-
bThe scale-free topology criterion was measured as defined by Zhang and Horvath (2005). It was developed to identify networks that have network topologies similar to other biological networks. This measurement ranges from 0 to 1, with 1 representing networks that are most like other biological networks.
-
cIn many networks, the probability that a gene is connected to k other genes is given by the power law distribution (Barabasi and Albert 1999; Barabasi and Oltvai 2004): P(k) ∼ k−gamma. A gamma <3 indicates that the network consists of many genes with relatively few connections and a few genes, hubs, with many connections. These hubs have the potential to affect many other genes in the network.


