
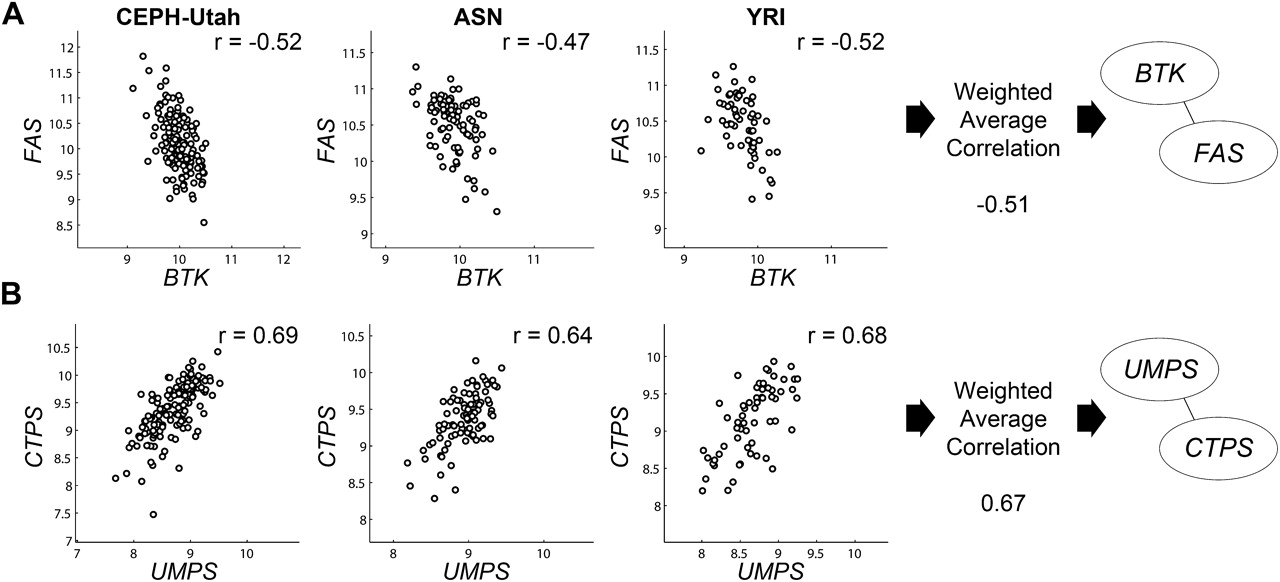
Figure 1.
Examples of gene pairs that are significantly and reproducibly correlated. (A) BTK and FAS are negatively correlated in expression across unrelated individuals from three different populations. The weighted average correlation between BTK and FAS is −0.51. (B) Similarly, UMPS and CTPS are positively correlated in expression and are connected in the coexpression network. Expression levels for these genes are provided on the axes and given in log2-transformed intensity units. The population-specific correlation coefficient is given in the upper-right-hand corner of each plot.


