
Parallel Identification of New Genes in Saccharomyces cerevisiae
- Guy Oshiro1,
- Lisa M. Wodicka2,
- Michael P. Washburn3,
- John R. Yates III3,4,
- David J. Lockhart2,5, and
- Elizabeth A. Winzeler1,4,6
- 1Genomics Institute of the Novartis Research Foundation, San Diego, California 92121, USA; 2Aventa Biosciences Corporation, San Diego, California 92121, USA; 3Torrey Mesa Research Institute, San Diego, California 92121, USA; 4Department of Cell Biology, The Scripps Research Institute, San Diego, California 92121, USA; 5Salk Institute for Biological Studies, Laboratory of Genetics, La Jolla, California 92037, USA.
Abstract
Short open reading frames (ORFs) occur frequently in primary genome sequence. Distinguishing bona fide small genes from the tens of thousands of short ORFs is one of the most challenging aspects of genome annotation. Direct experimental evidence is often required. Here we use a combination of expression profiling and mass spectrometry to verify the independent transcription of 138 and the translation of 50 previously nonannotated genes in the Saccharomyces cerevisiae genome. Through combined evidence, we propose the addition of 62 new genes to the genome and provide experimental support for the inclusion of 10 previously identified genes.
[The following individuals kindly provided reagents, samples, or unpublished information as indicated in the paper: V. Velculescu. Supplementary material is available online at http://www.genome.org.]
The complete genomic sequence of the budding yeast, Saccharomyces cerevisiae, was determined in 1996 (Goffeau et al. 1996). This was the first eukaryotic genome completely sequenced and served as an important test case for sequencing, annotation, and analyses of other larger genomes. Altogether, 6275 putative genes were identified in the original annotation effort (Goffeau et al. 1996). Because yeast is very AT rich and stop codons are frequently encountered, any open reading frame (ORF) predicted to encode >100 amino acids was automatically annotated as a gene. The cutoff of 100 amino acids was chosen because the likelihood of a misidentified ORF in the genome increases dramatically if shorter regions are allowed. Approximately 260,000 ORFs from 2 to 99 codons are found in the yeast genome. There are 9524 ORFs of 25 to 99 codons present in the intergenic regions (Basrai et al. 1997), or 64,085 if one considers ORFs within and overlapping the 6275 genes. Because only a minor fraction of these small ORFs are real genes, ORFs encoding proteins with <100 amino acids were omitted from the original annotation unless evidence for the gene had been found by direct experimentation. There are currently only 224 known genes (3.5% of the genome) in the yeast genome that code for proteins <100 amino acids in length (Cherry et al. 1998; Mewes et al. 1999). Many of these smaller genes encode proteins that play important roles in the yeast cell, such as mating pheromones, transporters, transcriptional regulators, and ribosomal proteins. In contrast, genes encoding small proteins in other sequenced organisms constitute up to 10% of their genomes (Basrai et al. 1997). By extrapolation, we suspect that there may be an additional 400 genes encoding small proteins lurking within the yeast genome.
Because computational methods do not reliably predict small genes and their small size makes them an elusive target for mutagenic screens, other experimental techniques are required to facilitate their identification. One method that has been used for such a purpose is the serial analysis of gene expression (SAGE) (Velculescu et al. 1997). In this technique, small 9-bp sequence tags are isolated from defined regions near the 3′ ends of different cDNAs. The 9-bp sequences are then concatenated, polymerase chain reaction (PCR) amplified, cloned, and sequenced. Estimations of the abundance of a transcript are made by sequencing and counting each SAGE tag. This technique does not rely on a priori gene predictions, and in one study of yeast ∼160 cDNA tags were detected that were convincingly mapped to nonannotated open reading frames (NORFs) of 60–98 codons (Velculescu et al. 1997). This result highlights the fact that genes that encode small proteins may have been missed in the original annotation effort. As a result of the SAGE study, 27 new annotated genes were added to theSaccharomyces Genome Database (SGD) on the basis of the combination of their strong SAGE expression profile and homology with proteins in other organisms (Cherry et al. 1998). Data for additional NORFs were also collected, but the results were inconclusive: Either the SAGE signal was weak or the SAGE tag was deemed too close to another ORF. In this study, we searched for novel genes in the yeast genome by first using genome-wide transcriptional profiling with oligonucleotide arrays containing probes to many of the larger SAGE-identified NORFs and then by whole genome proteomic analysis (Lockhart and Winzeler 2000; Washburn et al. 2001).
RESULTS
Identification of Expressed NORFS
We designed the Affymetrix Yeast S98 Array to query 6996 ORFs, as well as 93 tRNAs, 63 small nuclear RNAs, 5 ribosomal RNAs, 418 Ty elements, and 150 intergenic regions >5 kb (gap regions) within the yeast genome selected after probes for the NORFS were picked. Probes to 6075 yeast genes recognized by either the Saccharomyces Genome Database or MIPS (Munich Information Center for Protech Sequences) as of December 1998 were included on the S98 array (Mewes et al. 1997; Cherry et al. 1998). In addition to the recognized genes, probes that specifically interrogate 921 small NORFs were also included (see Materials and Methods section for NORF and probe selection). Evidence from the aforementioned SAGE study indicated that a significant fraction of these NORFs might be transcribed and thus should be included on the array (Velculescu et al. 1997). To increase the chance of observing expression of these NORFs, we grew yeast in a variety of different growth conditions. These included treatments with hydroxyurea, nocodazole, methyl methane sulfonate (MMS), and ultraviolet (UV) light, along with a heat and cold shock. After treatment, RNA was extracted from the yeast cells, labeled, and hybridized to high-density oligonucleotide arrays using standard methods (Wodicka et al. 1997). Replicate hybridizations were conducted for each of the nine different conditions and measurements of the expression levels for each of the 6996 genes and NORFs were taken. The transcriptional response of genes that were differentially expressed is shown in Figure 1. Several major patterns are readily discernible from the global view including a massive transcriptional response triggered by DNA damage caused by exposure to UV light or MMS (cluster V), an induction of a different class of genes in response to growth in glycerol media (cluster XVI), and repression of another class of genes in the presence of the DNA-damaging agents MMS and UV light (XVIII).
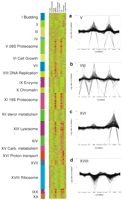
Transcriptional clusters identified by expression profiling over nine conditions. The data from the 18 different arrays were normalized such that the mean average difference for all genes was 200 (approximately two copies per cell). For clustering, the signals for each gene were normalized so that the median for all conditions was one. Representative clusters are shown in a–d, including clusters in which genes are induced after treatment with methyl methane sulfonate (MMS) and ultraviolet light (UV), induced after treatment with hydroxyurea (VIII), expressed on growth in glycerol-containing media (XVI), and repressed after treatment with MMS or UV (XVIII). For highly expressed genes, the fold change is likely to be underestimated because of the nonlinear response of the fluorescence signal at high concentrations. All data can be downloaded fromhttp://pub.gnf.org/∼ewinzeler/identification_of_new_gene.htm.
Affymetrix uses an algorithm to call a gene present (expressed) or absent (not expressed) on the basis of the behavior of the probe set that interrogates each gene. Eighty-seven percent (5525) of the known genes were called “present” (expressed) by AffymetrixGeneChip software in at least two of the 18 experiments, in good agreement with previous data (Wodicka et al. 1997). Of the 5525 genes, 3802 (62%) genes were determined to be present at a level of at least one copy per cell by normalizing the average difference of each gene to genes with a known copy number in the cell (Wodicka et al. 1997). This group of “expressed genes” included 19 of the 20 SAGE-identified small ORFs that had previously been given “gene” designations in SGD or MIPS and that were included on the array (Table1), thus indicating that hybridization data could be used to confirm SAGE data. In contrast to the annotated genes, we found very little signal for gap regions: Only 18% of the gap regions were called “present,” and at more than one copy per cell in one condition; these regions may also contain transcribed NORFs.
SAGE-Identified ORFs
We next asked if there was clear evidence for the expression of any NORFs included on the array. Altogether, 323 of the 921 NORFs queried on the array were called “present” by the AffymetrixGeneChip software at a level of at least one copy per cell (Avg Diff > 100) in one condition (seehttp://pub.gnf.org/∼ewinzeler/identification_of_new_gene.htm). This fraction (35%) is lower than that found for annotated genes (62%), indicating that some proportion of the NORFs are most likely not transcribed. However, 59% of the expressed NORFS (192/323) have a codon adaptation index >0.1, indicating that these genes are likely to be transcribed at moderate to high levels within the cell (Sharp and Li 1987).
Identification of Independently Transcribed NORFs
Although genome-wide expression profiling provides direct experimental verification that genomic regions are transcribed into RNA, expression profiling does have some limitations. A potential source of false positives in our analyses is the indeterminate length of the 3′ or 5′ untranslated regions of yeast genes. Because there is no highly conserved polyadenylation signal in yeast to demarcate the 3′ end of a transcript and promoter regions are difficult to predict, it is possible that the transcripts that hybridized to NORF probes actually originated at the promoters of adjacent larger genes. To address this probability, we identified NORFs that were separated by at least 500 nucleotides (nt) from the nearest upstream or downstream gene or were located at least 150 nt from neighboring genes and showed transcriptional patterns uncorrelated with those of neighboring genes (r < .6). We found 138 NORFs that satisfied these criteria. The entire list is available in Supplemental Table 1 available online at http://www.genome.org. The correlation and distance criteria are conservative and could result in a number of false negatives because coregulated genes are often juxtaposed in the genome (Cohen et al. 2000) and untranslated regions >150 nt are rare in yeast (Olivas et al. 1997). An example of one of the NORFs that meet the strict criteria is shown in Figure 2. NPR002C is expressed under all conditions and is significantly induced on growth in glycerol-containing media (Fig. 2). The physically adjacent genesYPR011C and YPR010C are not expressed in the same way as NPR002C, showing no up-regulation on growth in glycerol. Northern blot analysis of NPR002C and YPR011Cconfirms the differential expression patterns observed in theGeneChip analysis (Fig. 3). Furthermore, the size of the transcripts on the Northern blots shows that the NPR002C mRNA is not simply an extension of the mRNA of neighboring genes.
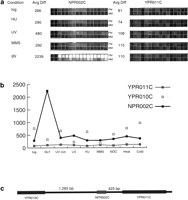
Transcriptional profile of the nonannotated open reading frame (NORF)NPR002C and the flanking neighboring genes YPR010Cand YPR011C. (a) Array hybridization images. Each open reading frame (ORF) and NORF is represented on the S98 array by 16 oligonucleotide pairs. One member of each pair corresponds to a perfectly matched sequence from the ORF (PM); the other pair member contains a single-base mismatch in a central position (MM). The difference in intensity between the perfectly matched and the mismatched sequences (PM-MM) is used to calculate an “average difference intensity” for each ORF in each experiment. Array probe hybridization images for NORF NPR002C and ORF YPR011Cfrom control cells in logarithmic phase growth, cells treated with HU, UV, MMS, and cells grown in glycerol containing media-treated cells are shown along with the average difference (Avg Diff) intensity values. (b) The average difference intensity of each gene graphed across all the conditions tested in this study. (c) Chromosomal view of NPR002C, YPR011C, andYPR010C with the distance in nucleotides between the NORF and ORF printed above the gap regions. The correlation of expression profiles between NPR002C and the upstream geneYPR011C and the downstream gene YPR010C is 0.13 and −0.32, respectively.
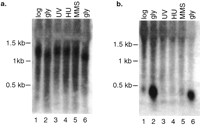
Northern blot analysis of NPR002C and YPR011C. (a) Expression of YPR011C across various conditions. RNA was extracted and total yeast RNA was separated by electrophoresis in an agarose gel, blotted, and hybridized with a polymerase chain reaction (PCR) amplicon of YPR011C. (b) The same blot was then stripped and hybridized with a PCR amplicon ofNPR002C.
Functional Assignment of Independently Transcribed NORFs
The expression pattern for a gene can provide clues to its function. In fact, in cases such as yeast in which gene redundancy is common, transcriptional profiling may be more informative than mutagenesis. We used this “guilt by association” method to assign a function to some of the 138 NORFs that were transcribed in a manner independent of adjacent genes. Of the 138 NORFS, 120 were identified as being differentially expressed using a nonparametric Kruskal-Wallis test over the nine different growth conditions. The expression results for the 120 NORFs were combined with the data for the 3392 expressed genes that were determined to be differentially expressed using the same nonparametric Kruskal-Wallis test (P < .05). The entire group was subjected to K-means clustering based on the Pearson correlation coefficient. For the 20 clusters, we found significant overlap with 11 MIPS functional categories (Mewes et al. 1997), including proteosome function (V, induction after treatment with MMS or UV light), ribonucleotide reductase function (VIII, induced in hydroxyurea), and ribosome function (XVIII repressed in MMS and UV).
Some of the functional classifications were not surprising. For example, yeast prefer fermentation to cellular respiration to generate ATP. Growth in media with a nonfermentable carbon source, such as glycerol, forces a switch to oxidative respiration. In the cluster containing genes induced after treatment with glycerol, we found 13 of the 16 genes known to have roles in proton transport (cluster XVIP = 7.9 × 10⁻¹³) and 11 of the 21 genes with known roles in TCA intermediate metabolism (P =1.5 × 10⁻¹⁰).
We also confirmed that a major transcriptional response to DNA damaging agents is the up-regulation of genes involved in protein degradation (Jelinsky and Samson 1999, Jelinsky et al. 2000) and a down-regulation of genes involved in protein synthesis (Fig. 1b). In fact, 29 of the 35 genes known to play a role in the function of the 26S proteosome were found in clusters V or XI, two similar clusters showing the most overlap with genes having a role in the function of the 26S or 19S proteosome, respectively. On the other hand, 102 of the 123 genes encoding proteins comprising the cytosolic ribosome were found in cluster XVIII (P = .0).
Hydroxyurea is known to interfere with the activity of ribonucleotide reductase (RNR) (Rittberg and Wright 1989). We expected, and indeed found, that all four members of the RNR gene family were induced by hydroxyurea and located in the same cluster of 108 genes (VIII) (P = 7.6 × 10⁻⁴). The RNR genes were also induced in response to MMS and UV light, although not as strongly as in hydroxyurea. This is probably because the cell needs extra dexoynucleoside triphosphates (dNTPs) for DNA replication and repair processes (Elledge et al. 1993; Huang and Elledge 1997). Another gene that shows a profile similar to the RNR genes is YML058W-A/HUG1 (hydroxyurea and UV and gamma radiation induced), which was originally identified in the aforementioned SAGE study and originally named NORF5 (Velculescu et al. 1997). HUG1 is known to interact with genes in the MEC1 DNA damage checkpoint (Basrai et al. 1999). In addition, in support of the functional assignments we found that the clusters could be used to identify transcription factor binding sites relevant to a particular cluster by searching for sequences that are overrepresented in regions upstream of genes in a transcriptional cluster (Table2) (Cho et al. 1998; Hughes et al. 2000).
Regulatory Elements Identified in Expression Clusters
Seventy-six of the NORFs were found in transcriptional clusters that had a significant overlap with MIPS functional categories (see Supplemental Table 1 available online at http://www.genome.org). For example, NOL015W and NPR002C may be involved in respiration because they are found in a cluster that includes many other genes that are required for energy metabolism and that are significantly induced in cells grown with glycerol as their sole carbon source. Although NOL015W was unclassified when the array was designed, it has since been shown by biochemical purification of the F1F0-ATP synthase complex (Arnold et al. 1998) to encode a subunit of the ATP synthase (ATP19), consistent with the functional assignment on the basis of its expression behavior. The list of 138 NORFs that shows evidence of independent transcription as well as codon adaptation indices, expression levels, and potential cellular roles is in Supplemental Table 1 (available online athttp://www.genome.org).
Computational Evidence of Gene Conservation
Evidence of independent transcription does not necessarily indicate that a NORF is a real gene: The transcript may not be translated into a protein, and there may be multiple small ORFs in regions that are transcriptionally active. Therefore a computational approach was used to provide further evidence that the NORFs detected by transcriptional profiling encoded real genes. Homology searches were conducted against the nonredundant protein databases to determine whether any of the transcribed NORFs encoded proteins that appear to have been conserved across multiple species. All 323 NORFs were searched against the National Center for Biotechnology Information (NCBI) nonredundant protein database with a Smith-Waterman algorithm. Alignments of 14 NORFs with a P value <.05 are listed in Table3. An example of a NORF that shows strong sequence conservation throughout evolution is NNL005C. We found that NNL005C shares significant homology with a gene found in both mouse and Drosophila (Fig.4). The sequences share 63% identity and 78% similarity in amino-acid sequence across the entire length of the coding sequences. The conservation in sequence indicates functional constraints on the sequences.
NORFs with Homologous Sequences
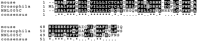
Homologs of NORF NNL005C are found in other species.CLUSTAWL alignment of homologous protein sequences from the mouse RIKEN cDNA 0610041E09 gene, Drosophila CG14199 gene, and the yeast NORF NNL005C. The mouse sequence scores (P < 8.3 × 10⁻²²) and theDrosophila sequence scores (P < 2.0 × 10⁻²⁰).
Others have applied this comparative genomics approach more systematically, first by collecting random shotgun sequences from related yeast species and second by comparing the predicted proteomes of these species with that of S. cerevisiae. Blandin et al. identified 50 NORFs conserved between S. cerevisiae and hemiascomyces (Blandin et al. 2000). Of these 50, 13 (11 as NORFs and two as genes) were probed on the yeast expression array and eight (seven NORFs, one gene) were found to be actively transcribed. Cliften et al. identified 11 NORFs conserved within the Saccharomycesgenus (Cliften et al. 2001). Of these 11, two were probed on the array and transcripts were detected for one. This fraction is similar to that observed for annotated genes (62%). Although the sample size is small for generalizations, these results confirm the value of the comparative genomics approach. One other gene, YLR363W-A, was identified by mass spectrometry as described below. These ORFs that are transcribed and that encode proteins that are homologous with proteins from other species are listed in Tables 3 and4 and have been given a gene designation according to S. cerevisiae systematic nomenclature.
NORFs Found in Other Studies
Evidence of Translation
Because a priori gene predictions are not needed, mass spectrometry represents an attractive alternative technology for the unbiased detection of new translated ORFs. We used tandem mass spectrometry coupled with in-line two-dimensional liquid chromatography, multidimensional protein identification technology (MudPIT) (Washburn et al. 2001), to characterize the proteins present in logarithmically growing yeast cultures. First, total yeast protein was extracted and proteolyzed into peptides with the proteases endoproteinase Lys-C and trypsin. The resulting complex peptide mixture was then applied to a biphasic microcapillary column packed with strong cation exchange and reverse-phase material from which peptides were sequentially eluted directly into a tandem mass spectrometer (Washburn et al. 2001). This MudPIT dataset was searched with the SEQUEST algorithm (Eng et al. 1994) against a concatenated database that contained the annotated ORF sequences (yeast_orfs.fasta database from the NCBI), as well as all ORFs from 25–99 amino acids (64,085), including 1187 NORFS identified by the SAGE study (Velculescu et al. 1997). The overall results of our MudPIT analyses were comparable to those previously published (Washburn et al. 2001) in which approximately one fourth of the predicted, annotated proteins in the yeast genome were detected and identified in a highly automated fashion (data not shown). The protein products of 22 SAGE NORFs were also detected, and 11 of these were in the set of 323 detectable transcripts (Table 5). An example of a mass spectra matching a NORF is shown in Figure5. An intense string of seven ions from they ion series and a less intense string of eight ions from theb ion series resulted in an excellent SEQUEST match and complete confidence in the identification (Fig. 5). The additional peptides described in Table 3 yielded comparable SEQUEST results indicating the probable translation of each of the NORFS listed. In the search of the 62,898 remaining 25–99 amino-acid proteome, spectra mapping to 28 small (<100 amino acids) NORFs were identified. Twenty-one of these small ORFs were within annotated genes, and eight were intergenic (Table 6), one of which had been identified in a previous study (Blandin et al. 2000). The fact that 11 proteins were identified in the 323 expressed ORFs (3%), 11 additional proteins in the set of (864) SAGE NORFs (which were either not expressed or not included on the array [1.2%]), and only 28 additional hits in a search of the entire 25–99 amino acid potential proteome (.04%) indicates a tremendous enrichment of proteins detected by mass spectrometry within the set of 323 “expressed” NORFs. NORFs detected by mass spectometry are listed in Tables 5 and 6 and have been given gene designations according to the systematic nomenclature.
NORFs Identified by MudPIT Proteomic Analyses
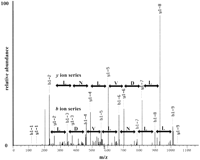
Mass spectra for a peptide from the NORF NIL001W. A multidimensional protein identification technology (MudPIT) analysis of the soluble proteome of BJ5460 was performed and the results analyzed via SEQUEST (Eng et al. 1994) using a concatenated database containing ORFs and NORFs. In the MudPIT analyses, a collision-induced dissociation tandem mass spectrum for (M + 2H) 2+ ion of the peptide DILDVLNLLK at m/z 578.5 from the NORFNIL001W was detected and identified. An eight-ion band seven-ion y series are shown in red and blue, respectively, and the corresponding amino acid difference between each ion is shown. The SEQUEST result for the tandem mass spectrum shown had an Xcorr of 3.1276 and a ΔCn of 0.2292, indicating complete confidence in the SEQUEST result.
Translated ORFs Identified in an Unbiased Search of Yeast Proteome
DISCUSSION
Array-based expression profiling allows a greater proportion of the genome to be queried than does mass spectrometry at present. It also allows more conditions to be rapidly examined than does SAGE. Also, in contrast to the use of computational searches, genome-wide expression profiling provides direct experimental verification that genomic regions are transcribed into RNA. Although expression patterns are not conclusive evidence of gene function because multiple functional categories may be represented in a particular cluster, they indicate directions for future research. Although expression profiling is a powerful strategy, there are certain inherent limitations. First, the oligonucleotide probes to putative genes on the S98 yeast array were chosen on the basis of experimental and computational data indicating that they might be expressed. A more unbiased search could be performed using arrays that cover the entire genome or all possible intergenic regions. Such “tiling” arrays have been successfully used to identify new genes and further define exon boundaries in humans (Shoemaker et al. 2001; Kapranov et al. 2002). At present, >500,000 probes can be placed on a typical Affymetrix array, allowing a more unbiased exploration of the genome. Another limitation of expression profiling is that it provides only a snapshot of the transcriptome at a specific time in response to specific stimuli. Many genes may be expressed only under very specific conditions and not under the range of conditions sampled here.
It is also possible that some of the RNAs detected are not translated into protein products. For example, we found that the signal for the 35S ribosomal RNA was often significant (average difference values up to 1500), indicating that even with oligo-dT priming for the construction of cDNA, some untranslated RNAs were amplified and labeled. It is unlikely that signals detected for many of the small ORFs are caused by contamination with genomic DNA, consistent with the observation that the average difference signal values for regions of the genome (so-called “gap regions”), which are not predicted to encode a gene, are generally quite low. In theory, whether an RNA was polyadenylated and thus likely to be translated could be confirmed by looking for further increases in signal at particular probe sets after direct labeling of RNA in the absence of poly(A)+purification (Wodicka et al. 1997). Alternative technologies, such as random transposon mutagenesis, may also be valuable ways to distinguish translated from nontranslated RNAs (Ross-Macdonald et al. 1999; Kumar et al. 2002). Finally, there may be multiple small ORFs within a single transcribed intergenic region and determining which one encodes the protein is difficult.
Proteomic analysis provides the most direct way to distinguish translated from nontranslated RNAs, although current proteomic methodologies have limitations. Although MudPIT has been shown to be the proteomic technology with the most comprehensive ability to detect and identify proteins with a broad range of isoelectric point (pI), hydrophobicity, size, and abundance (Washburn et al. 2001), MudPIT is not a completely comprehensive method. A recent characterization of the dynamic range of MudPIT indicated that it is capable of detecting and identifying a protein at 100 copies per cell in the background of proteins at 1,000,000 copies per cell (Wolters et al. 2001a). Although it is likely that MudPIT detects and identifies some proteins at <100 copies per cell, the number of proteins detected and identified at <100 copies per cell will likely be few. As with most techniques, low abundance proteins are harder to detect simply because of their scarcity.
It is important that searches for small genes with small NORFs be attempted for any genome for which there is sequence available, and other methods have been proposed, including random transposon mutagenesis (Kumar et al. 2002). This is because as the volume of sequence data grows, primary data are seldom considered and researchers become dependent on databases and catalogues that process, sort, and serve the sequence data. Because the index for many of these databases is the annotated gene, a NORF is effectively lost from consideration in many queries. There may be important signaling molecules, drug targets, or tumor suppressors in this collection of nonannotated genes. The comprehensive identification of all the transcribed RNAs and proteins in a genome will be a difficult task and is likely to be accomplished incrementally, especially as no method is perfectly suited to the task. In this work, we have shown the feasibility of using both expression profiling as well as mass spectrometry for the identification of new genes.
MATERIALS AND METHODS
Selection of Yeast NORFs to Include on the S98 Yeast Chip
The genome sequence and annotations were downloaded in November of 1998 (Mewes et al. 1997; Cherry et al. 1998). Approximately 1458 potential NORFs (>43 amino acids) were identified in the initial SAGE study (Velculescu et al. 1997). In 1187 cases, the SAGE tag mapped to a single region of the genome. Oligonucleotide probes for 1187 NORFs were selected and then subjected to a computational screen that favored a subset of sequences with similar GC content and thermodynamic properties and eliminated probes with possible secondary structure or sequence similarity to other probes. Probes specific to this subset of 921 potential NORFs were then synthesized on the S98 array by a process of photolithography and combinatorial chemistry following standard Affymetrix protocols (Pease et al. 1994).
Strains, Media, and Growth Conditions
S. cerevisiae strain BY4741 (MAT ahis3Δ1 leu2Δ0 met15Δ0 ura3Δ0) was used in this study. To limit the variables in expression profiling, a single large logarithmically growing culture (BY4741) was split into nine subcultures. Logarithmically growing cells were obtained by growing yeast cells to early log phase (3 × 10⁶ cells/mL) in yeast extract-peptone-dextrose- (YPD) rich medium at 30°C. For arrest in the S phase of the cell cycle, hydroxyurea (0.1 M) was added to early log phase cells, and the culture was incubated at 30°C for an additional 3.5 h. For arrest in the G2/M phase of the cell cycle, nocodazole (15 μg/mL) was added to early log phase cells, and the culture was incubated at 30°C for an additional 100 min. For cold shock and heat shock, yeast cells were shifted to either 37°C or 15°C for 20 min. For MMS exposure, MMS (0.1%) was added to early log phase cells, and the culture was incubated at 30°C for an additional hour. For exposure to UV irradiation, cells were spread on the surface of YPD plates, irradiated (Stratagene; UV Stratalinker 2400) at 60 J/m2, and then incubated for an additional hour before harvesting the cells from the plates (Kiser and Weinert 1996; Basrai et al. 1999). To control for the additional handling steps, an additional control was performed: Control cells were subjected to the same collection procedure without the UV exposure. For growth in a nonfermentable carbon source, an early log phase culture was resuspended in YP + 3% glycerol and incubated at 30°C for seven generations. Harvested cells were washed once with water before freezing at −70°C. The growth state and cell-cycle stage of the harvested cells were confirmed by microscopic analyses.
Yeast Expression Profiling
Total yeast RNA was isolated by using a hot phenol extraction method (Wodicka et al. 1997). All array hybridizations were performed in duplicate as previously described (Wodicka et al. 1997). Hybridizations were performed at 45°C for 16 hr. Microarray analysis was performed essentially as previously described. Briefly, 5 μg total RNA was converted to cDNA and used as a template to generate biotinylated cRNA. cRNA was fragmented and hybridized to Affymetrix S98 Yeast arrays as described in the standard protocol outlined in theGeneChip Expression Analysis Technical Manual (Affymetrix). After sample hybridization, arrays were washed and scanned at a resolution of 3 μM using a commercially available confocal laser scanner (Affymetrix).
Data Processing
Scanned image files were visually inspected for artifacts and analyzed with GeneChip 3.1 (Affymetrix). The data were normalized by setting the mean hybridization signal for each sample equal to 200. Initial data processing was accomplished with AffymetrixGeneChip software. Expression correlations were calculated with the correlation function within MatLab (Mathworks) and ad hoc Perl scripts. Clustering and data filtering was performed using GeneSpring 4.0 (Silicon Genetics).
Northern Blot Analysis
Northern analysis was performed with the Northern Max Kit from Ambion. Thirty μg of glyoxylated total RNA was separated in a 1% TBE agarose gel, blotted to Brightstar Plus membrane filter (Ambion) and hybridized to labeled PCR products. PCR products were labeled with (32P)dCTP by random priming (Roche). Hybridizations were performed at 42°C for 16 hr. The resulting blots were washed at 42°C and imaged using a Molecular Dynamics Storm imager and autoradiographic film.
MudPIT Analysis
Whole protein extracts of S. cerevisiae strainsBJ5460, BY4741, and S288C grown in rich media to mid-log phase at 30°C were prepared as described previously (Wolters et al. 2001). The samples were subjected to MudPIT analysis on a quaternary Hewlett Packard 1100 series HPLC that was directly coupled to a Finnigan LCQ ion trap mass spectrometer equipped with a nano-liquid chromatography ionization source as described previously (Washburn et al. 2001; Wolters et al. 2001). The SEQUEST algorithm (Eng et al. 1994) was run on each of the datasets using a database that contained the yeast_orfs.fasta database from the NCBI concatenated with 1458 potential NORFS identified in the initial SAGE study (Velculescu et al. 1997). The SEQUEST results were interpreted as described previously (Washburn et al. 2001; Wolters et al. 2001). Briefly, for specific identification of peptides from NORFS, the matches of tandem mass spectra for which the top scoring peptide was from a NORF were analyzed if the ΔCn was at least 0.1. When this was the case, the Xcorr was then analyzed in a charge-state dependent fashion. Xcorr and ΔCn are scoring values by which a user can judge the quality of a SEQUEST result (Eng et al. 1994). The same criteria for Xcorr were used for matches to NORFS as those described previously for other matches in which a +1 peptide had to be at least partially tryptic and with an Xcorr of at least 1.9, a +2 peptide had to be at least partially tryptic with an Xcorr between 2.2 and 3.0, a +2 peptide with an Xcorr >3.0 was accepted regardless of its tryptic nature, and a +3 peptide had to be at least partially tryptic with an Xcorr of at least 3.75. When a tandem mass spectra to a NORF was detected and passed the above criteria, the match was visually assessed for complete confidence as described previously (Washburn et al. 2001; Wolters et al. 2001).
WEB SITE REFERENCES
http://pub.gnf.org/∼ewinzeler/identification_of_new_gene.htm; Genomics Institute of the Novartis Research Foundation site.
Acknowledgments
We thank Pete Schultz and Steve Kay for supporting this research, Mike Mittmann at Affymetrix for help with the design of the S98 Array, Victor Velculescu for providing a list of the NORFS, and Katy Donaldson for critical reading of the manuscript. John R. Yates acknowledges funding from the National Institutes of Health (R33CA81665–01 and RR11823–03); Elizabeth Winzeler from the Ellison Medical Foundation (EMF ID-NS-0050–01); and Michael P. Washburn acknowledges support from the genome training grant T32HG000035–05.
The publication costs of this article were defrayed in part by payment of page charges. This article must therefore be hereby marked “advertisement” in accordance with 18 USC section 1734 solely to indicate this fact.
Footnotes
-
↵6 Corresponding author.
-
E-MAIL winzeler{at}scripps.edu; FAX (858) 784-9860.
-
Article and publication are at http://www.genome.org/cgi/doi/10.1101/gr.226802.
-
- Received December 7, 2001.
- Accepted May 17, 2002.
- Cold Spring Harbor Laboratory Press


