
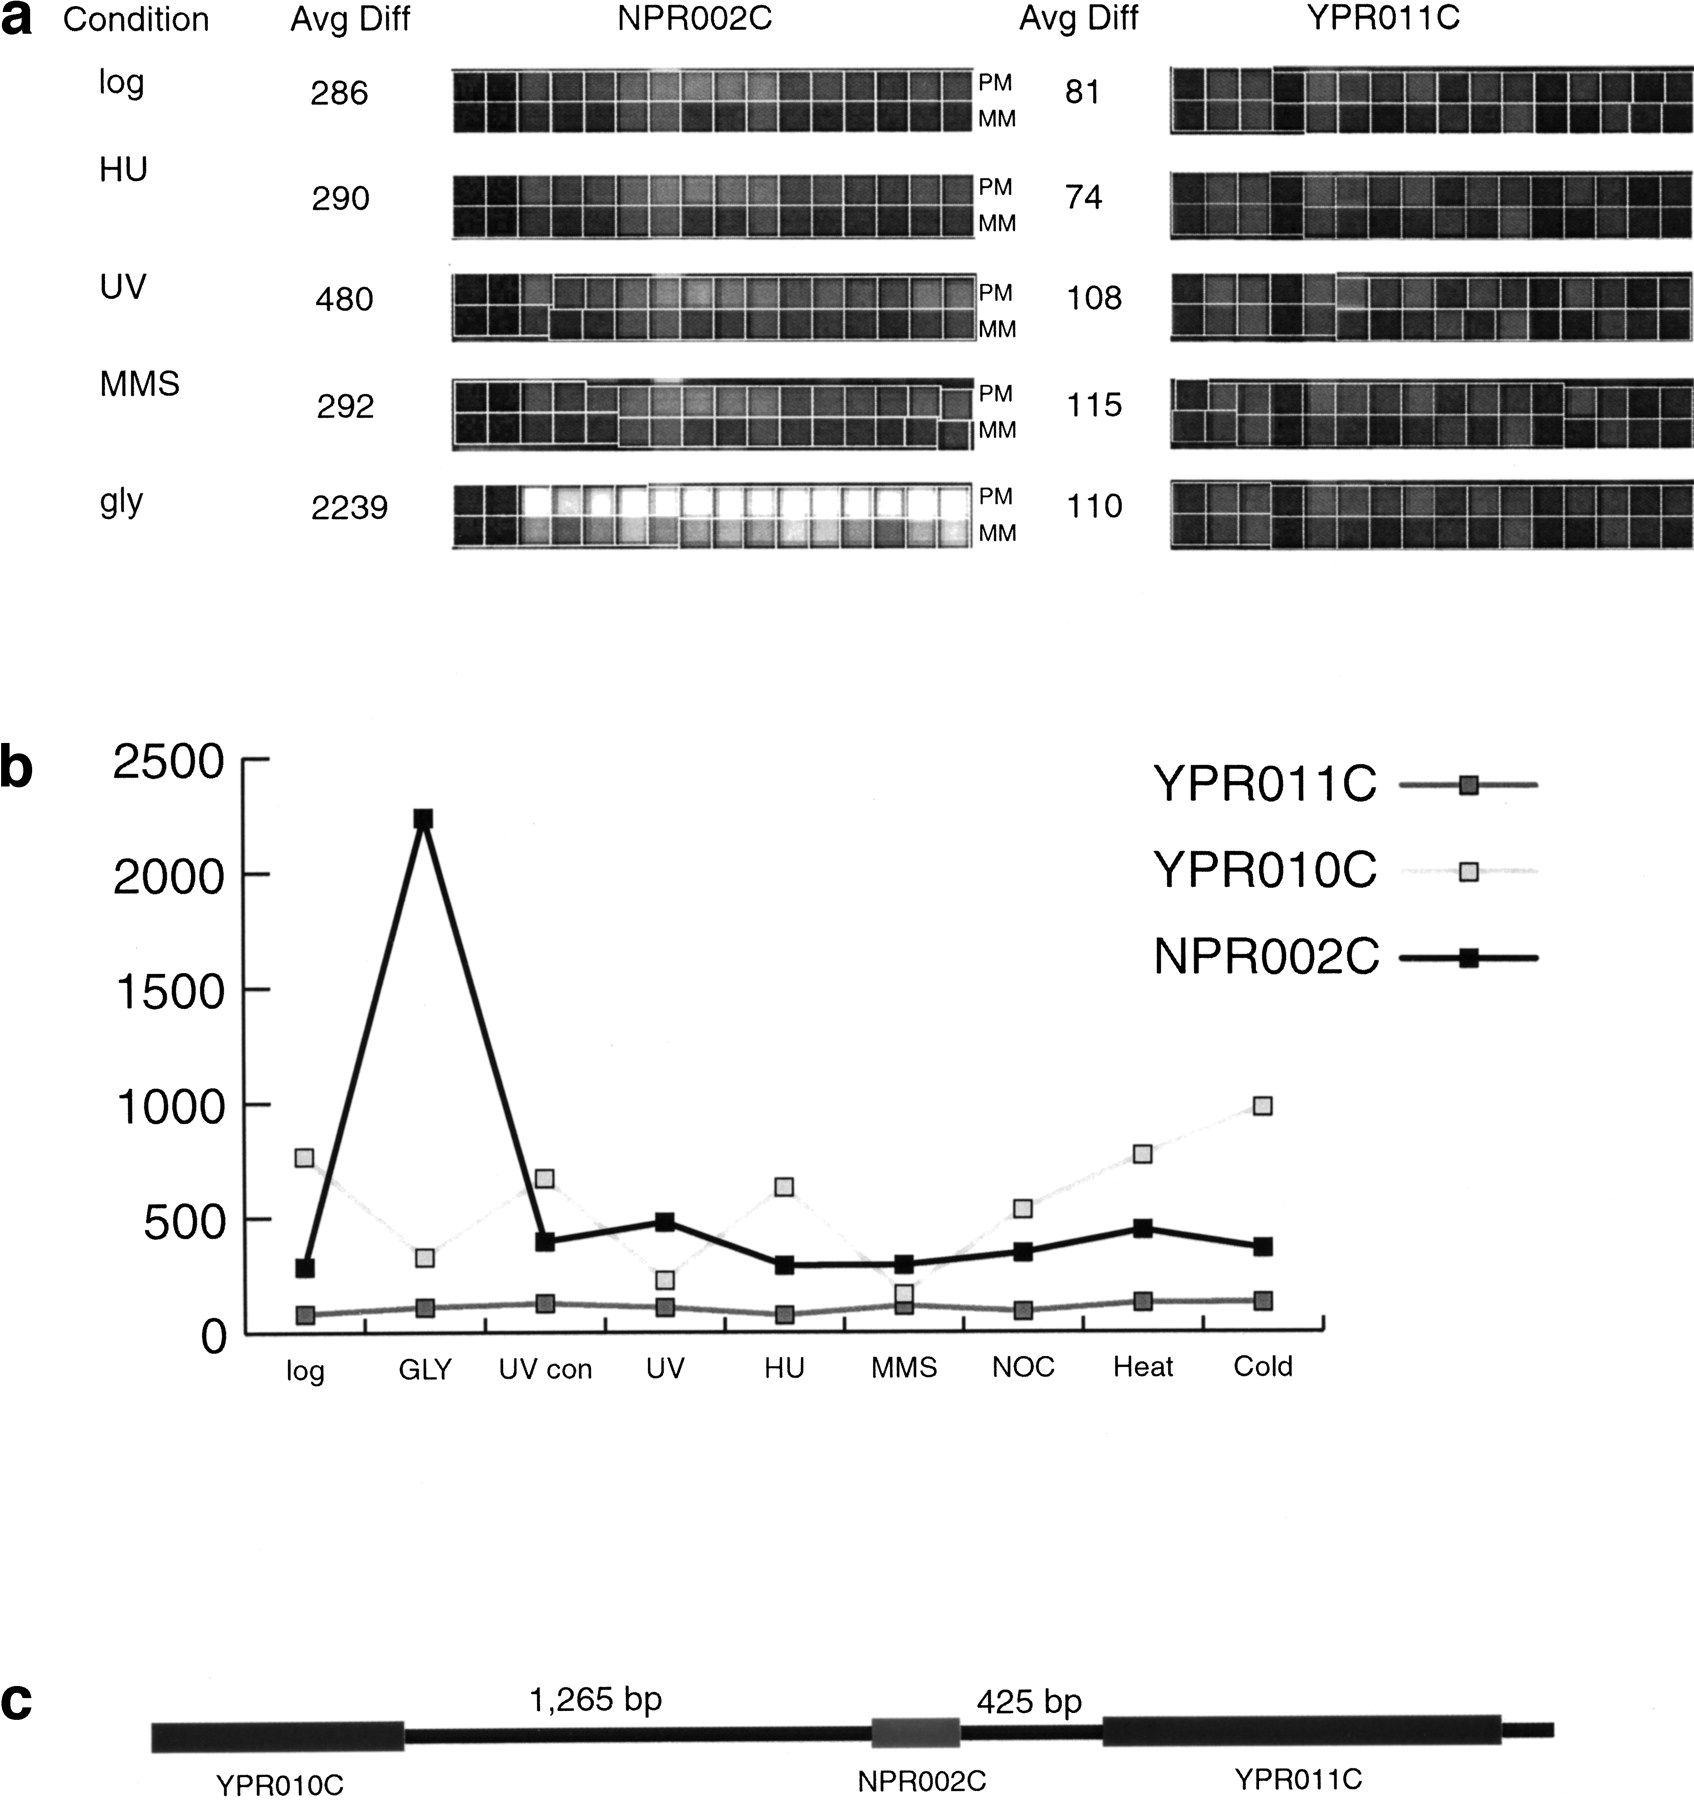
Transcriptional profile of the nonannotated open reading frame (NORF)NPR002C and the flanking neighboring genes YPR010Cand YPR011C. (a) Array hybridization images. Each open reading frame (ORF) and NORF is represented on the S98 array by 16 oligonucleotide pairs. One member of each pair corresponds to a perfectly matched sequence from the ORF (PM); the other pair member contains a single-base mismatch in a central position (MM). The difference in intensity between the perfectly matched and the mismatched sequences (PM-MM) is used to calculate an “average difference intensity” for each ORF in each experiment. Array probe hybridization images for NORF NPR002C and ORF YPR011Cfrom control cells in logarithmic phase growth, cells treated with HU, UV, MMS, and cells grown in glycerol containing media-treated cells are shown along with the average difference (Avg Diff) intensity values. (b) The average difference intensity of each gene graphed across all the conditions tested in this study. (c) Chromosomal view of NPR002C, YPR011C, andYPR010C with the distance in nucleotides between the NORF and ORF printed above the gap regions. The correlation of expression profiles between NPR002C and the upstream geneYPR011C and the downstream gene YPR010C is 0.13 and −0.32, respectively.


