
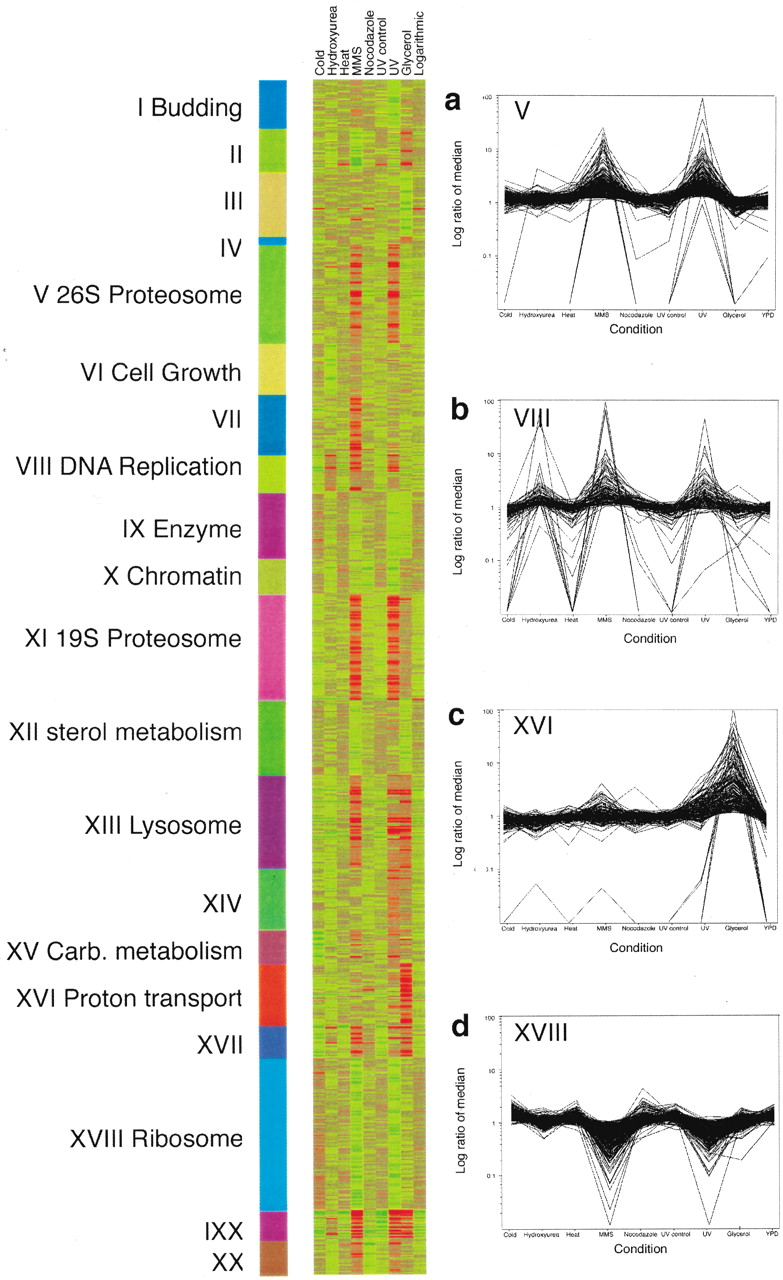
Transcriptional clusters identified by expression profiling over nine conditions. The data from the 18 different arrays were normalized such that the mean average difference for all genes was 200 (approximately two copies per cell). For clustering, the signals for each gene were normalized so that the median for all conditions was one. Representative clusters are shown in a–d, including clusters in which genes are induced after treatment with methyl methane sulfonate (MMS) and ultraviolet light (UV), induced after treatment with hydroxyurea (VIII), expressed on growth in glycerol-containing media (XVI), and repressed after treatment with MMS or UV (XVIII). For highly expressed genes, the fold change is likely to be underestimated because of the nonlinear response of the fluorescence signal at high concentrations. All data can be downloaded fromhttp://pub.gnf.org/∼ewinzeler/identification_of_new_gene.htm.


