
Abstract
The construction of highly integrated and annotated physical maps of human chromosomes represents a critical goal of the ongoing Human Genome Project. Our laboratory has focused on developing a physical map of human chromosome 7, a ∼170-Mb segment of DNA that corresponds to an estimated 5% of the human genome. Using a yeast artificial chromosome (YAC)-based sequence-tagged site (STS)-content mapping strategy, 2150 chromosome 7-specific STSs have been established and mapped to a collection of YACs highly enriched for chromosome 7 DNA. The STSs correspond to sequences generated from a variety of DNA sources, with particular emphasis placed on YAC insert ends, genetic markers, and genes. The YACs include a set of relatively nonchimeric clones from a human–hamster hybrid cell line as well as clones isolated from total genomic libraries. For map integration, we have localized 260 STSs corresponding to Genethon genetic markers and 259 STSs corresponding to markers ordered by radiation hybrid (RH) mapping on our YAC contigs. Analysis of the data with the program SEGMAP results in the assembly of 22 contigs that are “anchored” on the Genethon genetic map, the RH map, and/or the cytogenetic map. These 22 contigs are ordered relative to one another, are (in all but 3 cases) oriented relative to the centromere and telomeres, and contain >98% of the mapped STSs. The largest anchored YAC contig, accounting for most of 7p, contains 634 STSs and 1260 YACs. An additional 14 contigs, accounting for ∼1.5% of the mapped STSs, are assembled but remain unanchored on either the genetic or RH map. Therefore, these 14 “orphan” contigs are not ordered relative to other contigs. In our contig maps, adjacent STSs are connected by two or more YACs in >95% of cases. With 2150 mapped STSs, our map provides an average STS spacing of ∼79 kb. The physical map we report here exceeds the goal of 100-kb average STS spacing and should provide an excellent framework for systematic sequencing of the chromosome.
[Detailed information about the chromosome 7 physical map can be found at http://www.nhgri.nih.gov/DIR/GTB/CHR7or http://www.cshl.org/gr.]
Establishing the “genetic blueprint” of all human chromosomes represents the central goal of the ongoing Human Genome Project (Collins and Galas 1993; Olson 1993). On the basis of the experience gained by the systematic analysis of genomes in lower eukaryotes [e.g., yeast (Riles et al. 1993), nematode (Berks and the C. elegans Genome Mapping and Sequencing Consortium 1995), Drosophila (Rubin 1996)], the detailed study of human chromosomes is being performed in two consecutive phases: comprehensive physical mapping followed by complete genomic sequencing. The size and complexity of human chromosomes has necessitated the development and implementation of new approaches for constructing long-range physical maps. In 1990 (Green and Olson 1990a), we proposed a strategy whereby large segments of human DNA could be mapped using yeast artificial chromosomes (YACs) (Burke et al. 1987) as the source of cloned DNA and sequence-tagged sites (STSs) (Olson et al. 1989) as the landmarks on which the maps are based. This general approach, called YAC-based STS-content mapping (Green and Olson 1990a;Green and Green 1991), has been used to map numerous targeted regions of the human genome. This strategy has also been used to construct physical maps of whole human chromosomes (Chumakov et al. 1992a; Foote et al. 1992; Vollrath et al. 1992; Bell et al. 1995; Collins et al. 1995; Hudson et al. 1995; Krauter et al. 1995; Quackenbush et al. 1995;Qin et al. 1996; Nagaraja et al. 1997).
The use of STSs as mapping landmarks provides several key advantages (Green and Green 1991). For example, the ability to use the same PCR assays to analyze clone libraries (Green and Olson 1990b) and panels of radiation hybrid (RH) cell lines (Cox et al. 1990; Walter et al. 1994;Hudson et al. 1995; Schuler et al. 1996; Stewart et al. 1997) has important practical consequences. STSs also have the virtue of serving to integrate maps constructed by different methods, such as clone-based physical maps, RH maps, and genetic maps. Although alternate strategies have been used for constructing YAC-based physical maps of human chromosomes (Cohen et al. 1993; Chumakov et al. 1995; Crollius et al. 1996), the dominant approach used to date has been STS-content mapping.
Here we report completion of the first phase of establishing the “genetic blueprint” of human chromosome 7, a segment of the human genome containing an estimated ∼170 Mb of DNA (Trask et al. 1989;Morton 1991) and 2500–5000 genes. The resulting map, which provides access to large numbers of ordered STSs and well-positioned YACs, is proving to be useful for a variety of applications, including the positional cloning of genes associated with human disease and the systematic sequencing of the chromosome.
RESULTS
Overview of Project
Since the onset of the Human Genome Project, we have focused on constructing a detailed physical map of human chromosome 7 by a YAC-based STS-content mapping strategy (Green and Green 1991; Green et al. 1991a, 1994, 1995; Bouffard et al. 1997). Specifically, our goals included (1) mapping an STS, on average, every 100 kb across the chromosome [a programmatic goal of the U.S. Human Genome Project (Collins and Galas 1993)]; (2) integration of the YAC-based physical map with the cytogenetic, genetic, and RH maps of the chromosome; (3) construction of a map that covered the majority of the chromosome, that established an unique order for most of the mapped STSs, and that provided large, contiguous stretches of redundant clone coverage. We now report that these goals have been reached and that our physical map has been assembled to near completion, with the construction of 22 well-positioned YAC contigs that together account for virtually all of the chromosome (Table 1). Supplementing this paper is more detailed information that can be accessed electronically on the World Wide Web (Table2). Below are descriptions of the key aspects of our maps and the associated reagents.
YAC Contigs Constituting the Human Chromosome 7 Physical Map
| Anchored YAC contigs[i] | ||||||||
| Contig designation[ii] | Contig name[iii] | Genetic interval[iv] | RH interval[v] | Oriented[vi] | No. STSs[vii] | No. YACs[viii] | Cytogenetic[ix] | Physical length[x] |
| A | sWSS1361 | yes | 5 | 17 | 7p22 | 1,450 | ||
| B | sWSS457 | 3 | no | 6 | 11 | 550 | ||
| C | sWSS173 | 5–14 | 1.01–8.01 | yes | 86 | 148 | 7p22 | 6,150 |
| D | sWSS244 | 16–18 | 9.01–9.02 | yes | 20 | 25 | 7p21–p22 | 1,450 |
| E | sWSS9 | 19–87 | 9.03–59.02 | yes | 634 | 1260 | 7p11.2–p21 | 49,600 |
| F | sWSS3 | 88–97 | 60.01–65.01 | yes | 145 | 426 | 7p11.2–q11.2 | 10,100 |
| G | sWSS726 | 97 | 66.04–66.05 | yes | 6 | 8 | 1,300 | |
| H | sWSS686 | 97–98 | 65.02–65.03 | yes | 13 | 19 | 7q11.2 | 1,150 |
| I | sWSS86 | 100 | 66.01–66.06 | yes | 55 | 114 | 7q11.2 | 1,950 |
| J | sWSS10 | 101–128 | 67.01–77.07 | yes | 334 | 582 | 7q11.2–q22 | 27,550 |
| K | sWSS381 | 128–129 | 77.01–77.03 | yes | 30 | 41 | 7q21–q22 | 3,100 |
| L | sWSS11 | 129 | 78.04–78.06 | yes | 6 | 8 | 7q22 | 1,300 |
| M | sWSS328 | 129 | 78.05–78.07 | yes | 7 | 6 | 1,900 | |
| N | sWSS6 | 130–140 | 78.01–80.05 | yes | 111 | 246 | 7q22 | 10,550 |
| O | sWSS26 | 141–145 | 81.01–86.01 | yes | 95 | 225 | 7q22–q32 | 10,300 |
| P | sWSS1095 | 146 | 86.02 | no | 2 | 5 | 1,250 | |
| Q | sWSS81 | 145–150 | 87.01–96.03 | yes | 93 | 198 | 7q31–q32 | 6,400 |
| R | sWSS8 | 149–185 | 93.01–101.02 | yes | 359 | 704 | 7q31–q35 | 30,350 |
| S | sWSS806 | 99.04 | no | 6 | 5 | 800 | ||
| T | sWSS31 | 186–196 | 103.01–104.01 | yes | 71 | 137 | 7q36 | 4,450 |
| U | sWSS189 | 201–204 | 105.01–107.04 | yes | 25 | 39 | 7q36 | 2,450 |
| V | sWSS25 | yes | 8 | 19 | 7q36 | 1,150 | ||
| Unanchored YAC contigs[xi] | ||||||
| Contig name[iii] | No. STSs[vii] | No. YACs[viii] | Cytogenetic[ix] | Physical length[x] | Genes/ESTs[xii] | |
| sWSS33 | 3 | 2 | 7q36 | 1,550 | EST (1) | |
| sWSS419 | 3 | 5 | 7 CEN | 900 | ||
| sWSS420 | 2 | 3 | 7 CEN | 700 | ||
| sWSS1035 | 7 | 11 | 1,950 | gene (1) | ||
| sWSS1240 | 3 | 1 | 7q36 | 550 | ||
| sWSS1463 | 2 | 1 | 7q22 | 250 | gene (1), EST (1) | |
| sWSS2100 | 1 | 1 | 250 | |||
| sWSS2444 | 3 | 1 | 250 | |||
| sWSS2808 | 1 | 2 | 1,400 | |||
| sWSS3161 | 2 | 2 | 250 | EST (2) | ||
| sWSS3309 | 1 | 1 | 300 | EST (1) | ||
| sWSS3384 | 3 | 7 | 7q11.2 | 1,000 | EST (3) | |
| sWSS3577 | 1 | 1 | 350 | EST (1) | ||
| sWSS3647 | 1 | 2 | 1,500 | EST (1) | ||
[i] Contigs anchored in place relative to one another, based on their position with respect to the Genethon genetic, chromosome 7 RH, and/or cytogenetic maps (see text for details). Note that only the first and last contigs [A (sWSS1361) and V (sWSS25), respectively] are anchored exclusively on the cytogenetic map; these two contigs contain YACs corresponding to the 7p and 7q telomere, respectively.
[ii] Designation for the contig based on its relative position on the physical map (ordered from A to V, starting at 7pter and ending at 7qter).
[iii] Contig name assigned by SEGMAP, corresponding to the lowest numbered STS in the contig.
[iv] Interval on the Genethon genetic map spanned by the contig, corresponding to the position(s) [in cumulative cM from 7pter to 7qter (see Fig. 2)] of the most proximal and distal Genethon genetic marker(s) contained in the contig.
[v] Interval on the chromosome 7 RH map spanned by the contig, corresponding to the position(s) [in ordered bin location from 7pter to 7qter (see Fig. 3)] of the most proximal and distal RH-mapped marker(s) contained in the contig.
[vi] A contig is considered oriented relative to the centromere and telomeres if (1) the positions of uniquely ordered Genethon genetic markers contained in the contig allow the proximal and distal ends to be defined; (2) the positions of uniquely ordered RH-mapped markers contained in the contig allow the proximal and distal ends to be defined; or (3) in the case of contigs A (sWSS1361) and V (sWSS25), the position of the telomere-containing YAC indicates the telomeric end. The rare discrepancies between the physical map and the Genethon genetic or RH maps (see Figs. 2 and 3) were not considered in assessing contig orientation. In virtually every instance, there is remarkable agreement between the orientation indicated by the Genethon genetic and RH maps. For three contigs (B, P, S), none of the three criteria listed above were met, and the contigs are thus not considered oriented. Similarly, none of the unanchored contigs are considered oriented.
[vii] Number of STSs contained in the contig.
[viii] Number of YACs contained in the contig. Note that the sum of the YACs contained in each contig exceeds the total number of YACs actually present in the physical map (Table 4); this is because of the presence of YACs mapping to more than one contig. Here, such YACs are counted each time they appear in a contig, whereas in Table 4, each YAC is counted only once.
[ix] Established cytogenetic position of the contig, based on FISH-based mapping of a YAC(s) from the contig (Green et al. 1994,1995).
[x] Estimated physical length of the contig (in kb), as calculated by SEGMAP in deducing a computed map (see text) and then rounded to the nearest 50 kb.
[xi] Contigs unanchored in place relative to each other or to the anchored contigs. These contigs are devoid of a Genethon genetic or RH-mapped marker. Although many have cytogenetic assignments, there is not sufficient information to deduce a more refined position.
[xii] Presence of gene- and/or EST-specific STSs within the contig is indicated, along with the number of such STSs (in parenthesis).
Addresses for World Wide Web Sites Containing Chromosome 7 Mapping Data
| Electronic Supplements to This Paper (e.g., Figs. 2, 3, 4, 5) | |
| Genome Research Web Site | http://www.cshl.org/gr |
| General Summaries of Chromosome 7 Physical Map | |
| Chromosome 7 Mapping Project Web Site | http://www.nhgri.nih.gov/DIR/GTB/CHR7 |
| Information about Chromosome 7 STSs | |
| STS Division of GenBank | http://www.ncbi.nlm.nih.gov/dbSTS/ndex.html |
| Genome Database | http://gdbwww.gdb.org |
| Information about Chromosome 7 YACs | |
| Genome Database | http://gdbwww.gdb.org |
| Viewing Chromosome 7 Contig Maps | |
| Entrez Genomes Division | http://www.ncbi.nlm.nih.gov/htbin-post/ntrez/query?db=c&form=0 |
| Chromosome 7 Maps in Entrez Genomes Division | http://www.ncbi.nlm.nih.gov/cgi-bin/ntrez/zoovik?db=Genome&gi=7&from0&to=0 |
| Chromosome 7 Genomic Sequence Data | |
| Washington University Genome Sequencing Center | http://genome.wustl.edu/gsc/gschmpg.tml |
| University of Washington Genome Center | http://www.genome.washington.edu/UWGC |
Mapping Reagents
In constructing the physical map, we have mapped 2150 chromosome 7 STSs (see Methods for details). These STSs were derived intentionally from a variety of sources of DNA sequence (Table 3). Similarly, the YACs used for assembling the contig maps represent a diverse set of clones highly enriched for chromosome 7 DNA, including both relatively nonchimeric clones derived from a human–hamster monochromosomal hybrid cell line and clones isolated from total genomic libraries [mostly from the Centre d’Etude du Polymorphisme Humain (CEPH) YAC library; see Methods for details].
Characteristics of Different Sources of Mapped Chromosome 7 STSs
| STS source[i] | Mapped to YAC contig[ii] | YAC-based connectivity to Genethon genetic markers[iii] | Negative YAC screen[iv] | ||||
| same YAC | same contig | no connection | |||||
| Random | 568 (26%) | 500 | 58 | 10 | 6 | ||
| YAC insert ends | 790 (37%) | 690 | 80 | 20 | 0 | ||
| Genetic markers | 438 (20%) | 157 | 17 | 4 | 4 | ||
| Genes/ESTs | 354 (17%) | 293 | 43 | 18 | 13 | ||
| Total | 2150 | 1640 (87%) | 198 (10%) | 52 (3%) | 23 | ||
[i] The chromosome 7-specific STSs can be broadly classified into four major categories: those derived from sequences corresponding to random segments of chromosome 7 DNA [e.g., isolated by flow-sorting, subcloning, or Alu–PCR amplification of human DNA from chromosome 7-containing monochromosomal hybrid cell lines (Green et al. 1991a; Green 1993; Bouffard et al. 1997)], YAC insert ends, genetic (microsatellite) markers, and genes and ESTs.
[ii] Number (and relative percentage) of STSs mapped to the YAC contigs listed in Table 1, indicated for each STS source.
[iii] YAC-based physical connectivity between the mapped chromosome 7 STSs and Genethon genetic markers is indicated. A total of 1890 chromosome 7 STSs (2150 mapped STSs minus the 260 mapped Genethon genetic markers) were analyzed for their YAC-based connection to 1 or more of the 260 Genethon genetic markers localized on the contigs listed in Table 1. Indicated are the numbers of STSs from each source connected to a Genethon genetic marker(s) by the same YAC(s) or same YAC contig (but not the same YAC), as well as those with no YAC-based connection to a Genethon genetic marker (Green et al. 1994). The total (and relative percentage) for each of the three indicated categories is also provided.
[iv] Number of STSs for which no positive YAC could be identified, indicated for each STS source.
Some important characteristics about the YAC collection are evident based on the screens for 2173 chromosome 7 STSs. At least one positive YAC was identified for 2150 (99%) of these STSs (Table 3). There were an average of 9.9 positive YACs per STS and an average of 5.5 STSs in each STS-containing YAC, although these numbers varied for the different sources of YACs (Table 4). On the basis of the analysis of the resulting contigs, it is possible to estimate the relative contribution from each clone source. YACs constructed from the monochromosomal hybrid cell line account for 38%–40% of the total clone contribution in the contigs, the CEPH clones 50%–52%, and the other YACs 8%–12%. Thus, the relative clone contribution within our contig maps is similar, but not identical, for the small but mostly nonchimeric hybrid cell line-derived YACs and the large but often-chimeric CEPH YACs. It should be stressed that at least one positive hybrid cell line-derived YAC has been identified for 95% of the STSs, whereas at least one positive CEPH YAC has been identified for 90% of the STSs.
Characteristics of Different Sources of Mapped Chromosome 7 YACs
| Hybrid cell line YACs[i] | CEPH YACs[ii] | Other YACs[iii] | Total | |
| No. in contigs[iv] | 2200 | 1169 | 523 | 3892 |
| Avg. size (kb)[v] | 327 | 994 | 356 | 531 |
| Avg. no. positive YACs per STS[vi] | 4.0 | 5.5 | 3.0 | 9.9 |
| Avg. no STSs per positive YAC[vii] | 3.7 | 9.1 | 4.7 | 5.5 |
| Percent of STSs with corresponding positive YAC[viii] | 95 | 90 | 37 | 99 |
| Percent contribution based on cumulative YAC sizes[ix] | 40 | 52 | 8 | 100 |
| Percent contribution based on STS–YAC hits[x] | 38 | 50 | 12 | 100 |
[i] YACs constructed from the human chromosome 7-containing monochromosomal hybrid cell line GM10791, as described (Green et al. 1995).
[ii] YACs isolated from the total human genomic CEPH YAC library (Dausset et al. 1992) on the basis of chromosome 7-specificAlu–PCR-based hybridization analysis (Chumakov et al. 1992b; Green et al. 1995) and/or evidence that the YAC contains chromosome 7 DNA. The latter was assessed by the systematic examination of CEPH-Genethon mapping data (Cohen et al. 1993; Chumakov et al. 1995).
[iii] Miscellaneous YACs mostly isolated from the total human genomic Washington University YAC library (Burke et al. 1987;Brownstein et al. 1989), as well as a small number of clones derived from the total human genomic ICI YAC library (Anand et al. 1990) and a human telomere-specific YAC library (Riethman et al. 1989).
[iv] Total number of each source of YACs present in the contigs listed in Table 1.
[v] Average size of YACs (in kb) present in the contigs listed in Table 1, indicated for each source of YACs. The size of each YAC was measured by pulsed-field gel electrophoresis (Green et al. 1995).
[vi] Average number of positive YACs identified per STS, indicated for each source of YACs.
[vii] Average number of STSs contained in each positive YAC, indicated for each source of YACs.
[viii] Percentage of the total set of screened chromosome 7 STSs that identified at least one positive YAC, indicated for each source of YACs.
[ix] Relative contribution (as a percentage) of each source of YACs within the contigs is indicated, as estimated by analyzing the measured sizes of the mapped YACs. For this analysis, chimerism-factored sizes of YACs from each source that mapped within the contigs listed in Table 1 were summed and the relative totals assessed. In an attempt to account for chimeric DNA segments, only 75% of the measured YAC size was considered for clones isolated from total genomic libraries (e.g., CEPH, Washington University, ICI), because of their estimated 40%–60% chimerism rate (Green et al. 1991b). For the hybrid cell line-derived YACs, with their estimated 10%–15% chimerism rate (Green et al. 1995), 93% of the measured YAC size was considered. This calculation thus provides an estimate of the total amount of cloned chromosome 7 DNA accounted for by each YAC source as reflected by the size of the cloned inserts.
[x] Relative contribution (as a percentage) of each source of YACs within the contigs is indicated, as estimated by analyzing the frequency of STS–YAC hits. The presence of an STS in a YAC represents a single STS–YAC hit. The total number of such hits encountered for the 2150 mapped STSs was calculated for each source of YACs and the relative totals assessed. This calculation thus provides an estimate of the total amount of cloned chromosome 7 DNA accounted for by each YAC source as reflected by the representation of STSs.
Integration with Genetic, RH, and Cytogenetic Maps
As a high priority, we integrated our YAC-based physical map with the chromosome 7 genetic, RH, and cytogenetic maps. Cross-referencing different genomic maps enhances the utility of the maps, confirms the deduced STS order, and orders and orients the evolving YAC contigs (Green et al. 1994; Hudson et al. 1995; Bray-Ward et al. 1996). The Genethon genetic map of human chromosome 7 consists of 272 (CA) n -repeat polymorphisms positioned across 204 cM (Weissenbach et al. 1992; Gyapay et al. 1994; Dib et al. 1996). PCR assays suitable for YAC library screening were successfully developed for 262 of these markers, and in all but two instances, at least one positive YAC was identified. We also established the YAC contig locations of markers comprising a recently constructed chromosome 7 RH map (E.A. Stewart, K.B. McKusick, A. Aggarwal, S. Brady, G. diSibio, D. Elam, N. Fang, R. Goold, M. Harris, R. Lee, et al., in prep.). This map was derived by analyzing the Stanford G2 whole-genome RH panel (consisting of 85 human–hamster somatic hybrid cell lines) with 268 chromosome 7 STSs, many of which were selected based on their positions on the evolving YAC contigs. These markers mapped to 107 uniquely ordered RH bins (with each bin placed at >1000:1 odds) and were distributed across 5070 cR10,000. PCR assays suitable for YAC library screening were developed successfully for 259 of these markers, and in every instance, at least one positive YAC was identified.
Figure 1 provides a summary of the total number of chromosome 7 STSs analyzed by each of the independent mapping methods used here. In many cases, different PCR assays were used to localize an STS on the various maps [e.g., we preferred to design new primers for mapping Genethon genetic markers on the YAC contigs rather than use the ones employed for genotyping (Green et al. 1994)]. Electronic summary tables containing relevant information about the STSs corresponding to the markers on the Genethon genetic map (example shown in Fig.2) and chromosome 7 RH map (example shown in Fig. 3) are available on the World Wide Web (Table 2).
Distribution of STSs on the chromosome 7 YAC contig map, Genethon genetic map, and RH map. A summary of the total number of STSs present on one or more of the indicated maps is provided in a Venn diagram format. Note that 66 STSs are present on all three maps and that all but a few genetically mapped or RH-mapped STSs are also present on the YAC contig map.

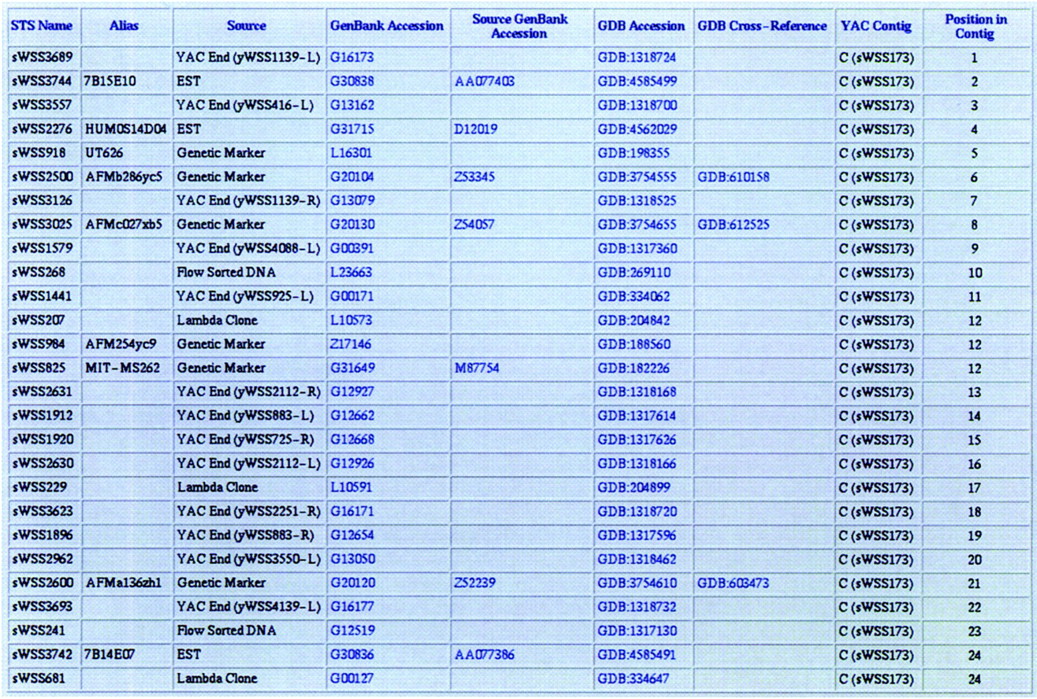
Physical location of markers on the chromosome 7 Genethon genetic map. A summary of the physical mapping information about the 272 markers comprising the chromosome 7 Genethon genetic map (Weissenbach et al. 1992; Gyapay et al. 1994; Dib et al. 1996; seehttp://www.genethon.fr/genethon_en.html) is provided in a table on the World Wide Web (see Table 2). This electronic supplement also includes detailed explanations about the information contained in the table. Shown here is a small, representative sample from the first portion of the table, which includes the Genethon genetic markers present in the YAC contig featured in Figs. 4 and 5.

Physical location of markers on the chromosome 7 RH map. A summary of the physical mapping information about the markers comprising the chromosome 7 RH map (E.A. Stewart, K.B. McKusick, A. Aggarwal, S. Brady, G. diSibio, D. Elam, N. Fang, R. Goold, M. Harris, R. Lee et al., in prep.) is provided in a table on the World Wide Web (see Table2). This electronic supplement also includes detailed explanations about the information contained in the table. Shown here is a small, representative sample from the first portion of that table, which includes the RH-mapped markers present in the YAC contig featured in Figs. 4 and 5.

For integration with the cytogenetic map, clones at regular physical intervals were mapped by fluorescence in situ hybridization (FISH). Particular emphasis was placed on YACs containing Genethon genetic markers, thereby integrating the physical, genetic, and cytogenetic maps at numerous points (Green et al. 1994). The electronic summary table (see Fig. 2) provides the established cytogenetic positions for those Genethon genetic markers whose corresponding YACs were analyzed by FISH.
General Features of Assembled YAC Contigs and STS Maps
The strategy for map construction (described in Methods) which made extensive use of the program SEGMAP, was used to localize 2150 chromosome 7 STSs relative to 3892 YACs, resulting in the construction of 36 contigs (Table 1). A representative sample of a SEGMAP-constructed contig map is provided in Figure4. Overall, the YAC-based STS-content analysis allowed 90% of the mapped STSs to be uniquely ordered within each contig. Furthermore, >95% of adjacent STS pairs are connected by two or more YACs (i.e., double-linked), thereby providing strong evidence for their close proximity on chromosome 7. An electronic summary table is available on the World Wide Web (Table 2) for each of the 36 YAC contigs and their mapped STSs (example shown in Fig. 5).
Representative YAC contig map. (A) The proximal (7pter-most) portion of contig C (sWSS173) is depicted, as deduced by SEGMAP. (B) The same portion of contig C (sWSS173) depicted inA is shown, as displayed in the Entrez Genomes Division (Table2). A detailed explanation of the various features of these maps is available in the electronic supplement associated with this paper (Table 2). Note that in each case, the contig map is displayed in its uncomputed form, where the STSs are simply spaced in an equidistant fashion from one another.

Order of STSs in YAC contig maps. For each of the 36 YAC contigs listed in Table 1, a table indicating the STSs in their deduced physical order, along with relevant information about each STS, is available on the World Wide Web (see Table 2). This electronic supplement also includes detailed explanations about the information contained in each table. As a representative example, the portion of the table for contig C (sWSS173) containing the STSs depicted in Fig. 4 is shown here.
Of the 36 contigs, 22 are “anchored” in place relative to the Genethon genetic, RH, and/or cytogenetic maps (Table 1; Figs. 2 and 3), accounting for >98% of the mapped STSs. For the subset of STSs corresponding to markers on the Genethon genetic and chromosome 7 RH maps, the STS order deduced by YAC-based mapping is remarkably consistent with that determined by these alternate methods. However, a small number of inconsistencies remain between the YAC contig map and the Genethon genetic (e.g., sWSS3069, sWSS3046, sWSS1221) and chromosome 7 RH (e.g., sWSS2745, sWSS1090, sWSS1713) maps. Specifically, 17 of 260 (7%) Genethon genetic markers and 12 of 259 (5%) RH markers mapped to YAC contigs appear to be at discrepant locations relative to their positions established by genetic and RH mapping, respectively (at >1000:1 odds). Four of the RH mapping cases correspond to markers mapping near the centromere, which is not unexpected given the difficulties inherent to the analysis of regions residing near centromeres by RH mapping methods (Cox et al. 1990;Walter et al. 1994; Hudson et al. 1995; Schuler et al. 1996; Stewtk;2art et al. 1997). All such discrepancies are indicated in the electronic summary tables (Table 2; Figs. 2 and 3).
Each of the 22 anchored YAC contigs has been assigned two names: one given by SEGMAP that reflects the lowest numbered STS in the contig and one indicating its long-range position relative to the other anchored contigs (A through V, respectively). Within the first and last anchored contigs, A (sWSS1361) and V (sWSS25), are 7p and 7q telomere-containing YACs, respectively. Neither of the telomeric contigs contain STSs corresponding to markers present on the Genethon genetic or RH maps; however, their terminal locations and relative orientations are known by the positions of the telomere-containing YACs. Of the remaining contigs, 18 are anchored on both the Genethon genetic and RH maps, whereas contig B (sWSS457) is only anchored on the Genethon genetic map and contig S (sWSS806) is only anchored on the RH map. Despite the occasional minor discrepancies with the Genethon genetic or RH maps (e.g., contigs P and R relative to the Genethon genetic map, contigs G, R, and S relative to the RH map), the predicted relative order of the anchored contigs seems reasonable in light of the available long-range mapping information. In addition to establishing the relative order for most of the anchored contigs, the Genethon genetic and RH maps allow determination of the relative orientation for all but a few contigs (Table 1). In total, 19 of the anchored YAC contigs, containing just under 98% of the mapped STSs, are both ordered and oriented. Figure 6provides a global overview of the predicted relative positioning of the 22 anchored YAC contigs across the chromosome.
Global positions of the anchored YAC contigs. All but one of the anchored YAC contigs listed in Table 1 are depicted as vertical bars. For contigs B–R, T, and U, the vertical positioning of each contig reflects its approximate position relative to the chromosome 7 Genethon genetic map [left; each horizontal cross-bar corresponds to a cumulative cM position (see Fig. 2)]. The bar for each contig is drawn so as to span the interval between the most proximal and most distal Genethon genetic markers in that contig. In some instances, contigs contain genetic markers residing at the same cumulative cM position (e.g., K, L, and M); in these cases, the contigs are roughly positioned in place with minimal intervening space. Genethon genetic markers with discrepant positions on the genetic and physical maps were not considered (see Fig. 2). The positions of contigs A and V at the ends of the chromosome reflect the presence of YACs containing the 7p (7p TEL) and 7q (7q TEL) telomere, respectively. Darkened bars denote contigs with known orientation, whereas open bars denote contigs where the orientation is not known (see Table 1). Contig S is not represented, as it is anchored on the RH map but not the Genethon genetic map. Note that the approximate position of the centromere (CEN) is indicated.

In routine usage, SEGMAP depicts contigs so that the STSs are evenly spaced and the size of each YAC, in general, reflects the number of STSs it contains (see Fig. 4). However, SEGMAP is capable of accounting for the measured insert size and STS content of each YAC to estimate the relative STS spacing and clone overlaps. Therefore, the resulting computed maps provide estimates of total contig sizes, with the 22 anchored contigs averaging 7.95 Mb in size (Table 1). Although the computed maps provide some insight about STS spacing and overall contig lengths, they are largely based on the measured size of each YAC. This measurement is limited by a number of factors, including the frequent presence of large chimeric segments in YACs [particularly clones from total human genomic libraries (Green et al. 1991b)] that make the cloned insert inappropriately large, the common occurrence of internal deletions in YACs that make the cloned insert inappropriately small, and the inherent inaccuracies associated with the high throughput sizing of 3892 YACs by pulsed-field gel electrophoresis. Note that the cumulative size of the 36 YAC contigs exceeds 186 Mb, whereas chromosome 7 is estimated to contain ∼170 Mb of DNA (Trask et al. 1989; Morton 1991). This discrepancy could reflect the above problems with calculating YAC contig sizes or an underestimate for the total size of the chromosome.
Unanchored Contigs
Despite our rigorous attempts, 14 unanchored (i.e., “orphan”) contigs remain that either have no YAC-based connections to an anchored contig or cannot be placed consistently within an anchored contig by SEGMAP (Table 1). Examination of these 14 contigs reveals a number of features. First, the orphan contigs are small, averaging 2.4 STSs and 2.9 YACs each compared to 96 STSs and 175 YACs for the anchored contigs (see Table 1). In fact, five of the orphan contigs contain a single STS. Second, the STSs mapping to orphan contigs are, in general, poorly represented in our YAC collection, averaging 2.7 positive YACs per STS compared to 9.9 positive YACs per STS for all contigs. A disproportionate number of the STSs in orphan contigs correspond to genes and expressed-sequence tags (ESTs) [12 of 33 (36%)]. In fact, 8 of the 14 orphan contigs contain at least one gene- or EST-specific STS. These findings suggest that many (or most) of the orphan contigs likely correspond to gene-rich regions of the chromosome that are GC-rich, which have been shown to be difficult to clone in YACs (Bernardi 1995; Saccone et al. 1996). Supporting this theory is the fact that the average GC content of the STSs in the anchored contigs is 40%, whereas the average GC content of the STSs in the unanchored contigs and those failing to identify a positive YAC is 47%. Furthermore, two of the orphan contigs (Table 1), as well as several of the STSs that failed to identify a positive YAC, are derived from 7q36, a region corresponding to a GC-rich isochore (Bernardi 1995). Except for this bias encountered with the orphaned contigs, there was otherwise no evidence of obvious clustering of gene/EST-specific STSs within specific regions of the chromosome.
The presence of a residual set of 14 small, orphan contigs is not surprising based on several aspects of our mapping strategy. First, with the known cloning bias against GC-rich regions, poor YAC coverage was expected for at least some of the chromosome. Second, at one point during the project, we deliberately developed STSs from the insert ends of >100 hybrid cell line-derived YACs that had not yet been identified by a chromosome 7 STS. In essence, we intentionally sought to develop STSs from those chromosomal regions not yet associated with an evolving YAC contig. Although this effort resulted in the expansion of some contigs and merger of others, it also yielded four of the orphan contigs listed in Table 1. Third, we have purposely mapped numerous gene- and EST-specific STSs (Table 3), including a large set developed from a collection of chromosome 7-enriched ESTs (Touchman et al. 1997). Undoubtedly, many of these STSs reside within GC-rich regions of the chromosome; in fact, several of the orphan contigs were created as a direct result of our gene/EST mapping effort and another 13 gene/EST-specific STSs failed to identify a positive YAC (Table 3).
Gaps in Contig Map
Attempts to fill the gaps between our contigs by walking with YAC-end STSs have stalled at either the STS development or YAC isolation stage. We have made no attempt to estimate the size of these gaps, although they are likely to be small. Although only 23 STSs failed to identify a positive YAC, most of these likely fall in the gaps between our contigs. A disproportionate number of these STSs correspond to gene and EST sequences (Table 3). For a small number of these STSs, additional attempts to isolate a positive YAC from other total human genomic libraries have failed. However, preliminary efforts have already identified positive bacterial artificial chromosome (BAC) (Shizuya et al. 1992) clones for a majority of these STSs (G.G. Bouffard and E.D. Green, unpubl.). Furthermore, STSs developed from the insert ends of several of these BACs have been found to map to orphan YAC contigs, further suggesting that some of the gaps and orphan contigs correspond to regions difficult to clone in YACs.
Apparent False-Negative and False-Positive Data
Despite the construction of a physical map that is, in general, globally consistent and appears to account for most of chromosome 7, the underlying data have numerous imperfections. As with other large YAC-based STS-content mapping efforts, there are numerous apparent false-negative and false-positive results. The apparent absence in a YAC of an STS that should be present based on the map is considered a false-negative result, whereas the apparent presence in a YAC of an STS that otherwise maps to a different location is considered a false-positive result. In fact, 21% of the YACs residing in contigs are associated with apparent false-negative or false-positive data, with false-negative results being more frequent. Note that SEGMAP segregates those YACs associated with any type of data inconsistency at the bottom of the contig maps (Fig. 4).
False-negative results can be caused by an internal deletion within a YAC insert (Foote et al. 1992; Vilageliu and Tyler-Smith 1992), a PCR assay that failed to amplify an STS from a YAC, an incorrectly deduced position of an STS within a contig map, or a data handling error. Careful reanalysis of our data suggests that the majority of the remaining false-negative results reflect either internal deletions in the YACs or the incorrect local positioning of STSs.
False-positive results can be caused by a chimeric clone that contains two unrelated segments of DNA in the same YAC or the same yeast cell, a contaminated well in the YAC library created during the arraying of clones or the preparation of DNA, the presence of a duplicated segment on the chromosome that results in the inappropriate connection of noncontiguous regions (by nonunique STSs residing within the duplicated segment; see below), or a data handling error. In roughly half of the false-positive cases we examined in detail, the results suggested there was a contamination problem. The remaining cases we suspect are attributable to chimeric clones containing two unrelated segments of chromosome 7 [syntenic chimeras (Cohen et al. 1993)], errors in the contig map, or an otherwise undetected duplicated segment.
Complex Chromosomal Regions
In addition to gaps in clone coverage and false-negative/false-positive data, another major class of problems associated with the chromosome 7 physical map are caused by the presence of complex genomic structures, in particular, large duplicated segments of DNA. One notably problematic region was the centromere [specifically, the proximal half of contig F (sWSS3)]. Here, the presence of large blocks of repetitive sequences (e.g., alphoid DNA, other low-copy repetitive elements) made the development of unique STSs difficult and often rendered the YACs unstable. The actual contig map has numerous anomalies, including overrepresentation of YACs, frequent apparent false-negative data, a major discrepancy with the Genethon genetic map (marker AFM329zb5, sWSS1770), and a number of discrepancies with the chromosome 7 RH map. Similar anomalies are seen with contig I (sWSS86). In both of these cases, attempts to minimize these problems failed to produce a markedly more consistent map. Thus, these contigs should be viewed cautiously, especially with respect to the precise STS order and YAC overlaps.
Indices of Map Completion
Numerous indices can be used for assessing the “completion” of a physical map. Although the various parameters mentioned above provide insight about the map, several other features are important to consider. One such feature is the fraction of the chromosome accounted for by the physical map. For example, 99% of the chromosome 7 STSs were mapped successfully to one of the YAC contigs. Thus, assuming that our collection of STSs represents chromosome 7 accurately, then 99% of chromosome 7 is accounted for by the assembled YAC contigs. Another parameter that can be considered is the cumulative size of the YAC contigs (Table 1), which totals ∼186 Mb and presumably reflects virtually all of chromosome 7.
For some applications, such as positional cloning (Collins 1995), the entry point to the chromosome 7 physical map will be through one or more genetic markers. Thus, we estimated the measured fraction of the chromosome that is physically connected by YACs to Genethon genetic markers using the total collection of STSs as a reflection of the chromosome (Green et al. 1994) (Table 3). Remarkably, 87% of the chromosome 7 STSs are present on the same YACs as Genethon genetic markers, whereas an additional 10% are present on the same YAC contig (but not the same YAC) as Genethon markers. Only 3% of our STSs map to a YAC contig devoid of a Genethon genetic marker. These percentages are generally the same for STSs derived from different DNA sources (Table3).
Another important index of map completion is STS resolution. At the simplest level, mapping 2150 STSs across a ∼170-Mb chromosome provides an average STS spacing of ∼79 kb. If only the 1933 uniquely ordered STSs are considered, then the map contains a uniquely ordered STS, on average, every 88 kb. More rigorous approaches for calculating resolution that account for the relative distribution of STSs (Olson and Green 1993; Cox et al. 1994) can also be used. For the latter analysis, SEGMAP uses the computed contig maps, with the inter-STS spacing estimated, to calculate the fraction of the chromosome accounted for within set bounds around each STS. Figure 7 depicts the results of analyzing our chromosome 7 physical map in this fashion, as deduced by SEGMAP. Roughly 60% of the chromosome appears to reside within 100 kb of an STS on our map, 84% is within 200 kb, and 94% is within 300 kb.
Relative resolution of mapped chromosome 7 STSs. As an index of the overall resolution of the physical map reported here, the 36 YAC contigs listed in Table 1 were analyzed by SEGMAP to calculate the percentage of the chromosome residing within various distances around each uniquely ordered STS, performed essentially as described (Olson and Green 1993; Cox et al. 1994). In short, physical bounds of the indicated distances were placed around uniquely ordered STSs present in each computed contig map (i.e., maps depicting the SEGMAP-estimated spacing between STSs). The resulting unique (i.e., nonoverlapping) bounds were then summed and compared to the estimated size of the chromosome (170 Mb). The percentage of the chromosome accounted for by this analysis is indicated for each distance. Shown are the results obtained after mapping the initial 1150 STSs and then after mapping all 2150 STSs.

Relationship Between Genetic and Physical Distance
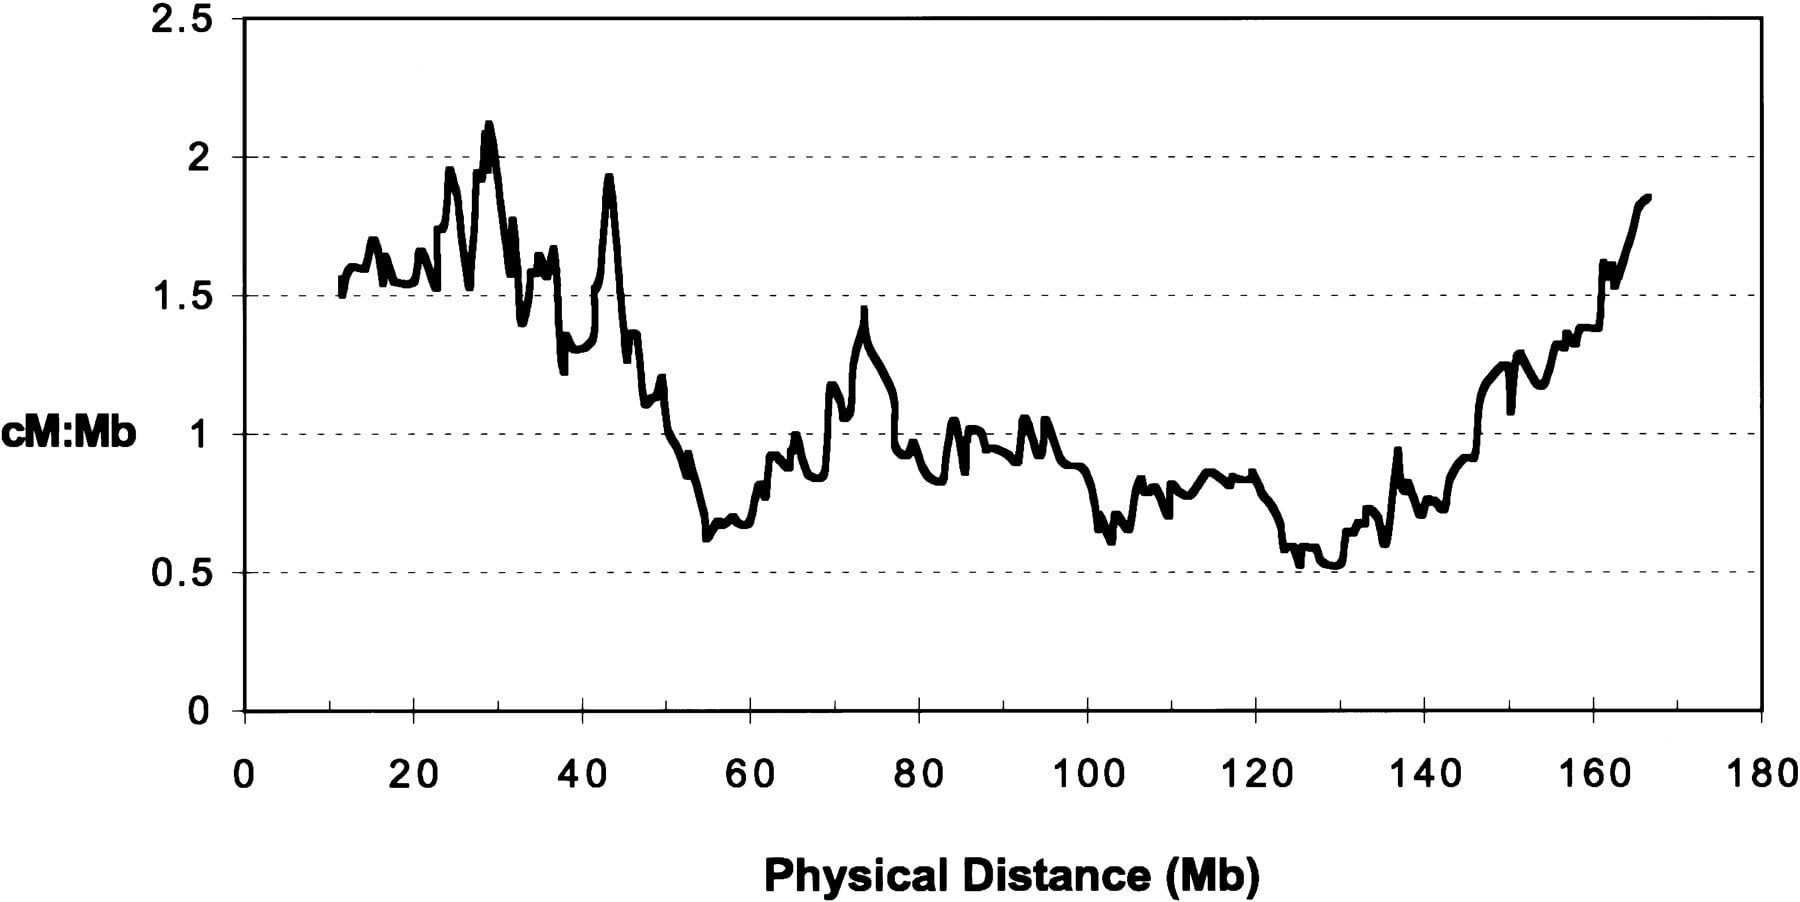
The availability of a complete physical map of a human chromosome, including the established positions for a large set of genetic markers, provided a unique opportunity to correlate genetic and physical distances across an entire chromosome. For this analysis, the 22 anchored YAC contigs were examined in their computed form, and the physical distance between each successive Genethon genetic marker was established. The resulting data allowed the ratio between genetic and physical distances to be calculated in successive intervals (Fig.8). This analysis revealed several interesting features of recombination across this chromosome, including some that cannot be revealed from the genetic map alone. The ratio of genetic to physical distance varies fourfold across human chromosome 7 and is highest near both telomeres, with a progressive decrease toward the centromere from either telomere. The ratio is lowest near the centromere (at ∼60 Mb), as well as at an internal region near the middle of 7q (at ∼130 Mb), in both instances indicating regions of decreased recombination. Whether the variation in recombination across a chromosome is caused by specific DNA sequences per se or the local chromatin structure is currently unknown. However, the specific regions of increased and decreased recombination can be studied further using the map and reagents we have generated.
Relationship between genetic and physical distance across the length of human chromosome 7. This relationship was examined for the mapped Genethon genetic markers with interlocus Kosambi map distances in cM (see Fig. 2). For physical distances, the computed versions of the anchored contigs listed in Table 1 were placed end-to-end in their established order and orientation (when known), assuming a distance of zero between contigs. The unanchored contigs were not included in the analysis. The intervening physical distance between successive Genethon genetic markers was then measured, ignoring markers at discrepant relative positions on the genetic and physical maps. The terminal segments, between the telomeres and the first or last Genethon genetic markers, were not considered. The ratio of genetic distance (in cM) to physical distance (in Mb) was then calculated in overlapping windows of 20 consecutive markers (A. Lynn and A. Chakravarti, unpubl.). The resulting values are plotted against the physical map in a 7p–7q direction, in each case at the mid-point of the physical map interval. Note that the centromere is located roughly at the 60-Mb position on the graph.
Data Dissemination
The important elements of the chromosome 7 physical map have been organized for dissemination on the World Wide Web (Table 2). The most difficult aspect of this process was establishing a mechanism for disseminating the contig maps. Our solution has been to use the program Chromoscope (Zhang et al. 1994), which provides the ability to display and manipulate highly complex maps imported in ASN.1 format (J. Zhang and J. Ostell, unpubl.) and allows the contigs to be accessed in the Entrez Genomes Division at the National Center for Biotechnology Information (NCBI). A representative example of a Chromoscope-depicted contig map is shown in Figure 4B.
DISCUSSION
Comparison to Other Chromosome 7 Physical Maps
Several other large-scale efforts (both genome wide and chromosome specific) have aimed to construct YAC-based physical maps of chromosome 7. The chromosome 7-specific mapping strategies have emphasized hybridization-based analyses rather than STS-content mapping (Scherer et al. 1993; Kunz et al. 1994; e.g., seehttp://www.genet.sickkids.on.ca/chromosome7) and used a separate YAC library constructed from a chromosome 7-containing human–rodent hybrid cell line (Scherer et al. 1992). Thus, our map has little in common with respect to either the markers or YACs, precluding rigorous map-to-map comparisons.
The CEPH–Genethon group used several experimental approaches to build a YAC-based physical map of the human genome (Cohen et al. 1993;Chumakov et al. 1995; seehttp://www.cephb.fr/bio/ceph-genethon-map.html). Using their computer programs (e.g., Quickmap), the data can be analyzed to yield contig maps in the form of “YAC paths” that cover the majority of the genome, including most of chromosome 7. Importantly, the CEPH–Genethon physical map is essentially a clone-based map, as opposed to a landmark-based map (such as a YAC-based STS-content map). Direct comparison of the CEPH–Genethon map with our chromosome 7 map is difficult, as only a subset of the YACs and an even smaller proportion of the markers are in common. Nonetheless, there appears to be general consistency between the maps, especially with respect to the identification of CEPH YACs containing Genethon genetic markers. Of note, where it is possible to align the two maps, the CEPH–Genethon map does not seem to either provide clone coverage across any of our gaps or significantly extend any of our YAC contigs.
In contrast to these studies, the genome-wide physical mapping effort by the Whitehead/MIT Genome Center was more analogous to our project (Hudson et al. 1995). The major similarities between our chromosome 7 physical map and the Whitehead/MIT map are the general strategic approach (STS-content mapping of YACs coupled with genetic and RH mapping), the use of sequences from various sources for generating STSs, and the apparent coverage of >95% of chromosome 7 by the resulting map. However, a number of important differences are also evident. For example, the Whitehead/MIT map relies heavily on the STS order established by RH mapping; in fact, a large fraction of the STSs were never mapped to YACs. Furthermore, the YACs themselves were derived exclusively from the CEPH YAC library, with its associated 40–60% chimerism rate (Green et al. 1991b), whereas a large fraction of the clone coverage in our map is provided by hybrid cell line-derived YACs with a 10–15% chimerism rate (Green et al. 1995). Finally, some of the gaps in the Whitehead/MIT map were filled on the basis of available CEPH–Genethon mapping data (e.g., YAC fingerprint analysis), whereas we used only STS content data for constructing contigs. Direct map-to-map comparisons (based on Release 11, October, 1996; see http://www-genome.wi.mit.edu; L. Hui and L. Stein, pers. comm.) reveal several important numerical differences, including (Whitehead/MIT map vs. our map, respectively, in each case): (1) number of STSs mapped to either YACs or RH cell lines (1001 vs. 2150); (2) average spacing of mapped STSs (∼170 vs. ∼79 kb); (3) number of STSs mapped to YACs (659 vs. 2150); (4) number of STSs mapped to RH cell lines (696 vs. 259); (5) number of Genethon genetic markers mapped to YACs (208 vs. 260); and (6) number of YACs in contigs (968 vs. 3892).
Because of the similar strategies used, we can align more readily the Whitehead/MIT chromosome 7 physical map with our map. In no instance does their map provide YAC connectivity between adjacent Genethon genetic markers that we were unable to establish. Thus, none of our remaining gaps appear to be filled in their map. Remarkably, there are only minor apparent discrepancies between the two maps, whereas there is generally good correlation with respect to the presence of notably large or small YAC contigs at specific locations along the chromosome.
Comparison to Physical Maps of Other Human Chromosomes
At a minimum, first-generation clone-based physical maps have been constructed for all human chromosomes. In most instances, the best available maps are those constructed by the genome-wide mapping efforts (Cohen et al. 1993; Chumakov et al. 1995; Hudson et al. 1995). However, in some cases, more focused efforts have produced more refined physical maps of individual chromosomes, including those for chromosomes 3 (Gemmill et al. 1995), 4 (see http://shgc.stanford.edu), 11 (Quackenbush et al. 1995; Qin et al. 1996), 12 (Krauter et al. 1995), 16 (Doggett et al. 1995), 19 (Ashworth et al. 1995), 21 (Chumakov et al. 1992a), 22 (Bell et al. 1995; Collins et al. 1995), X (Crollius et al. 1996; Nagaraja et al. 1997), and Y (Foote et al. 1992; Vollrath et al. 1992). However, there are significant differences among these maps, especially with respect to the reagents used (e.g., clones, markers), mapping strategy, and overall map resolution. The goal of 100-kb average STS spacing (Collins and Galas 1993) has thus far been achieved with the chromosome 7 map reported here and that constructed by a very similar strategy for the X chromosome (Nagaraja et al. 1997).
Problems Encountered
The most difficult problems encountered relate to the presence of large nonunique blocks of DNA on human chromosomes. Unlike highly repetitive DNA sequences (e.g., Alu and L1 elements), these repeated segments are present only a few times in the genome. For our project, the use of a YAC collection highly enriched for chromosome 7 DNA helped to minimize problems caused by duplicated segments present on other chromosomes. However, several examples of duplicated blocks of DNA confined to chromosome 7 were encountered. In general, when the duplicated segment is small relative to the typical YAC size, the problem can often be overcome by simply discarding those STSs residing within the repeated DNA. However, when the duplicated segment is large, elimination of the nonunique STSs often precludes the establishment of contiguous clone coverage across the duplicated regions. In the latter case, one is thus presented with the dilemma of eliminating problematic STSs at the expense of continuity, a situation difficult to resolve.
A less severe problem is the failure to isolate certain genomic regions in YACs. For chromosome 7, we found this situation to be rare (1% of the STSs analyzed), similar to the experience for other human chromosomes (Chumakov et al. 1992a; Foote et al. 1992; Hudson et al. 1995; Qin et al. 1996). Thus, only a very small fraction of the human genome appears to be absent in carefully constructed YAC-based physical maps. Admittedly, there is evidence that some of the DNA that cannot be isolated in YACs is gene rich and thus, should not be simply ignored.
Utility of Map
Ultimately, the value of the physical map reported here should be assessed based on how it facilitates other experimental efforts. One set of studies that have already been greatly enhanced are those aiming to isolate chromosome 7 genes associated with genetic disease by a positional cloning strategy (Collins 1995). Important advances have already been made as a direct result of our physical map (Curran et al. 1995; Howard et al. 1997). In studies such as these, the most common entry point into the physical map is through specific genetic markers; for example, those defining a critical region harboring a gene of interest. Thus, the presence of >430 genetic markers on our physical map should prove valuable for positional cloning efforts. Likewise, the established locations of >350 gene/EST-specific STSs as well as near complete clone coverage across the chromosome should facilitate virtually any positional cloning project involving chromosome 7.
Perhaps the most important utility of our physical map, however, will be to provide the necessary infrastructure for sequencing chromosome 7. The Human Genome Project is currently at a critical transition point, as the emphasis shifts from assembling a map of the human genome to elucidating its sequence (Olson 1995). Ironically, despite the large investment in up-front physical mapping of the human genome and the relatively low per-base-pair cost of physical mapping compared to sequencing, the availability of high quality physical maps and supporting clone coverage of the mapped regions remains a rate-limiting step in the sequencing of the human genome. Our STS-based physical map provides an excellent starting point for deriving the necessary clones for large-scale sequencing. For example, similar to the strategy proposed by Hudson et al. (1995), we are actively using our STS-specific PCR assays to isolate corresponding BAC clones. Although the average STS spacing across our map is ∼79 kb, the precise distance between adjacent STSs is highly variable. As such, we are encountering many situations where multiple STSs are present in a single 100- to 200-kb BAC as well as other instances where the interval between adjacent STSs cannot be spanned by any one BAC. For the latter cases, achieving clone continuity will require the generation of new STSs from the BAC insert ends and subsequent walking, similar to the strategy we used to construct YAC contigs. Our experience to date, which includes the isolation of BACs that together account for >40 Mb of chromosome 7 (G.G. Bouffard and E.D. Green, unpubl.), indicates that long-range BAC coverage can be achieved starting with the STS map reported here.
A distinctive feature of our map relevant to the sequencing of chromosome 7 is the frequent presence of YACs derived from a monochromosomal hybrid cell line. These YACs represent virtually all of the chromosome and are rarely chimeric. Such clones may be valuable for the systematic sequencing of the chromosome. For example, a sizable fraction (∼20%) of the nematode genome has been difficult to isolate in large-insert bacterial clones (Berks and the C. elegans Genome Mapping and Sequencing Consortium 1995). For these regions, YACs are proving to be critical sources of sequencing templates (Vaudin et al. 1995). Should an analogous situation be encountered with chromosome 7, then the availability of well-mapped, high-quality YACs should facilitate the complete sequencing of the chromosome. Toward that end, we have taken great care in the handling and growth of these clones so as to minimize serial propagation and the opportunity for rearrangement of the cloned inserts. Of note, several overlapping pairs of hybrid cell line-derived YACs have been subcloned and analyzed at very high resolution, with no evidence of any clone-to-clone variation (Wong et al. 1997). Thus, at least for the cases examined to date, these YACs appear to represent a reliable source of cloned DNA that can be used, when needed, for sequencing segments of chromosome 7.
The sequences of various chromosome 7 BACs and YAC-derived cosmids (generated in collaboration with the Washington University Genome Sequencing Center and the University of Washington Genome Center, respectively; see Table 2) are now being established and deposited in GenBank at a steady pace. It is our expectation that chromosome 7 will be among the first few human chromosomes completely sequenced, perhaps around the turn of this century.
METHODS
Chromosome 7 STSs
To achieve 100-kb average STS spacing across the ∼170-Mb chromosome 7 required the development and mapping of, at minimum, 1700 STSs. However, we sought to map significantly more STSs, as computer modeling of the project indicated that some important map features (e.g., long-range continuity, total chromosomal coverage) would be enhanced by mapping >2000 STSs (Green and Green 1991). In addition, a higher STS resolution would undoubtedly render the map more useful for most applications.
Of the 2150 mapped chromosome 7 STSs, 26% were developed from “random” chromosome 7 sequences (Green et al. 1991a; Green 1993), whereas 37% were derived from YAC insert ends (Table 3). Genetic (i.e., microsatellite) markers were used to develop 20% of our STSs, with particular emphasis placed on generating STSs from the mapped Genethon (Weissenbach et al. 1992; Gyapay et al. 1994; Dib et al. 1996), Cooperative Human Linkage Center (CHLC) (Murray et al. 1994), and Utah (Utah Marker Development Group 1995) genetic markers. Finally, 17% were derived from known gene and EST sequences. The majority of the latter correspond to ESTs we generated from a set of chromosome 7-enriched direct selection cDNA libraries (Touchman et al. 1997).
For organizational simplicity, all of our STSs are named with the prefix sWSS followed by a unique number. In developing the corresponding set of STS-specific PCR assays, our efforts accounted for (1) both DNA sequence generation and PCR primer design for 66% of the STSs; (2) PCR primer design but not DNA sequence generation for 17%; and (3) neither DNA sequence generation nor PCR primer design for 17%. The development of virtually all of the STSs in the first two categories has been reported previously (Green et al. 1991a; Bouffard et al. 1997; Touchman et al. 1997). Most of the STSs in the second and third categories correspond to markers that serve to integrate our physical map with the genetic, RH, and transcript (i.e., gene/EST) maps. For STSs in the third category, the corresponding PCR assays were simply imported from other laboratories.
Information on all STSs is available in the STS Division of GenBank (dbSTS) at NCBI and the Genome Database (GDB). The corresponding records include, when appropriate, relevant cross-references to the original DNA sequences. Furthermore, electronic summary tables with information about the mapped STSs are available on the World Wide Web (Table 2).
YAC Clones
The collection of YAC clones used to construct the chromosome 7 physical map consisted of (1) YACs constructed from the monochromosomal human–hamster hybrid cell line GM10791 (Jones et al. 1990); importantly, <10–15% of these clones contain chimeric inserts (Green et al. 1995); (2) YACs identified by chromosome 7-specificAlu–PCR-based hybridization analysis (Chumakov et al. 1992b) of CEPH “mega-YACs” (Dausset et al. 1992); (3) YACs obtained by screening the Washington University (Burke et al. 1987; Brownstein et al. 1989), ICI (Anand et al. 1990), and CEPH (Dausset et al. 1992) libraries for individual STSs; (4) YACs from the CEPH library (Dausset et al. 1992) thought to contain chromosome 7 DNA, based on data generated by the CEPH–Genethon mapping effort (Cohen et al. 1993;Chumakov et al. 1995; seehttp://www.cephb.fr/bio/ceph-genethon-map.html); and (5) two YAC clones containing the 7p and 7q telomeres [7p telomere YAC: yRM2185 (yWSS4377), GDB:229879 (H. Riethman, unpubl.); 7q telomere YAC: HTY146 (yWSS4191), GDB:171469 (Riethman et al. 1989)]. Note that the first three components listed above correspond to the “human chromosome 7 YAC resource” described previously (Green et al. 1995), whereas the last two components represent subsequent additions.
For organizational simplicity, all YACs are named with the prefix yWSS followed by a unique number. Information about the YACs has been deposited in GDB; for clones derived from total human genomic libraries, each corresponding GDB record includes the original well position from which the clone was isolated. In total, >5400 chromosome 7-enriched YACs, arrayed in 58 96-well microtiter plates, were screened for STSs involving a relatively efficient three-step scheme (Green et al. 1995). It is important to stress that each positive YAC was confirmed by PCR testing the purified DNA derived from the individual microtiter well housing that clone.
Strategy for Map Construction
The chromosome 7 physical map was constructed using the interactive computer program SEGMAP (Green and Green 1991; C.L. Magness and P. Green, unpubl.; seehttp://www.genome.washington.edu/UWGC/tools/segmap.htm). SEGMAP analyzes YAC-based STS-content data using a linear programming algorithm and then assembles YAC contigs, establishes the optimal order of STSs and YAC ends, identifies possible data anomalies, calculates various mapping parameters, and estimates the relative spacing between STSs. SEGMAP also provides visual annotation about the STSs present on other maps (e.g., genetic, RH) as well as the location of YACs and STSs on the cytogenetic map. SEGMAP does not constrain the position of the genetically or RH-mapped STSs based on their positions on these other maps; rather, the contigs maps are constructed exclusively on the basis of the YAC-based STS-content data. However, SEGMAP does indicate whether there is concordance or discordance between the order of STSs on the YAC contig map and that established by an alternate mapping method.
Our general approach for map construction involved an orderly series of steps. Initially, STSs were generated from sequences obtained at random from chromosome 7, and YACs were isolated for these STSs to “seed” contigs. Once contigs containing multiple STSs began to form, our effort became increasingly focused on the development of STSs from the insert ends of YACs residing at the termini of evolving contigs. In short, we performed bidirectional chromosome walking from all nascent contigs by screening our clone collection with newly developed YAC-end STSs, thereby facilitating the establishment of long-range clone coverage (Green and Green 1991; Palazzolo et al. 1991;Kere et al. 1992). The availability of a set of relatively nonchimeric chromosome 7-specific YACs constructed from a monochromosomal hybrid cell line (Green et al. 1995) allowed us to emphasize the development of STSs from YAC insert ends. As a result, our largest class of mapped STSs (37%) correspond to those developed from YAC insert ends (Table3). The development of STSs from YACs residing at the ends of contigs was used in an iterative fashion, as contigs expanded, merged, and, in some cases, reorganized to place new YACs at the contig ends.
All SEGMAP-deduced contig maps were routinely subjected to manual review; in particular, the STS order within each contig was evaluated for its consistency with the genetic and RH maps. The putative long-range order and orientation of contigs was also monitored for consistency with the genetic and RH maps as well as the FISH-based cytogenetic assignment of the YACs. Inconsistencies were reviewed for possible data errors, for the presence of chimeric YACs [specifically, syntenic chimeras (Cohen et al. 1993) containing two unrelated segments of chromosome 7 DNA], and for underlying complex genomic structures, such as those containing duplicated STSs. Each newly created merger of contigs was examined in an effort to assess its validity. In addition, places with only a single YAC connecting an adjacent pair of STSs were routinely scrutinized. Although these are now rare in our contigs (<5% of adjacent STS pairs), almost all are supported by the long-range STS order established by genetic or RH mapping.
The systematic evaluation of SEGMAP-deduced contigs routinely revealed inconsistent data that required subsequent follow-up evaluation and experimentation. For example, inappropriate contig mergers connecting regions that were discontinuous on the Genethon genetic or RH maps would often, with more careful analysis, be found to result from a data entry error, false-positive PCR result, chimeric YAC, microtiter well containing more than one chromosome 7 YAC, or duplicated STS. In some cases, such analysis pointed to a specific YAC or STS as the singular cause of the problem. When the other supporting data were convincing, such YACs or STSs were then excluded from consideration and the contig maps were reassembled by SEGMAP. This was mostly done for nonunique STSs that mapped to more than one region on the chromosome, many of which were also associated with a higher than average number of positive YACs, and for YACs believed to contain chimeric inserts. Thus, the contig maps reported reflect the products of numerous rounds of detailed and systematic review of the deduced STS order in light of other mapping data. This map represents an attempt to strike an optimal balance between establishing contiguous clone coverage (i.e., maximizing contig sizes) and minimizing the number of inconsistencies with other maps of the chromosome.
We gratefully acknowledge the efforts of various individuals previously associated with the chromosome 7 mapping project, including Mary Pat Leckie, Allison Wilson, Jim Landgraf, and Regina Lim, as well as numerous colleagues that served as collaborators for various aspects of the project, including Barbara Trask, Bob Moyzis, Daniel Cohen, Ilya Chumakov, John Wasmuth, Terry Featherstone, and Buddy Brownstein. We also acknowledge Beth Stewart, David Cox, and Rick Myers as well as the staff of the Stanford Human Genome Center for their collaborative efforts in STS development and RH map construction, Jim Ostell and Jinghui Zhang for their collaborative efforts in displaying our maps in the Entrez Genomes Division, Harold Riethman for providing telomere-containing YACs, and Audrey Lynn and Aravinda Chakravarti for assistance in analyzing the relationship between genetic and physical distances. We thank Andy Baxevanis for assistance in the preparation of the electronic summaries and Phil Green, Maynard Olson, Aravinda Chakravarti, Bob Nussbaum, Dennis Drayna, Lorraine Everett, and Gabriela Adelt Green for critical review of the manuscript. Finally, we thank Maynard Olson, Phil Green, David Schlessinger, and Robert Waterston for critical guidance, support, and advice throughout the course of this project.
The publication costs of this article were defrayed in part by payment of page charges. This article must therefore be hereby marked “advertisement” in accordance with 18 USC section 1734 solely to indicate this fact.
Notes
[27] Corresponding author.
Notes
[28] E-MAIL [email protected]; FAX (301) 402-4735.
REFERENCES
- ↵R. AnandJ.H. RileyR. ButlerJ.C. SmithA.F. Markham(1990) A 3.5 genome equivalent multi access YAC library: Construction, characterisation, screening and storage. Nucleic Acids Res. 18:1951–1956.
- ↵L.K. AshworthM.A. BatzerB. BrandriffE. BranscombP. de JongE. GarciaJ.A. GarnesL.A. GordonJ.E. LamerdinG. Lennon(1995) An integrated metric physical map of human chromosome 19. Nature Genet. 11:422–427.
- ↵C.J. BellM.L. BudarfB.W. NieuwenhuijsenB.L. BarnoskiK.H. BuetowK. CampbellA.M.E. ColbertJ. CollinsM. DalyP.R. Desjardins(1995) Integration of physical, breakpoint and genetic maps of chromosome 22: Localization of 587 yeast artificial chromosomes with 238 mapped markers. Hum. Mol. Genet. 4:59–69.
- ↵M. Berks(1995) Around the genomes: The C. elegans genome sequencing project. Genome Res. 5:99–104, the C. elegans Genome Mapping and Sequencing Consortium.
- ↵G. Bernardi(1995) The human genome: Organization and evolutionary history. Annu. Rev. Genet. 29:445–476.
- ↵G.G. BouffardL.M. IyerJ.R. IdolV.V. BradenA.F. CunninghamL.A. WeintraubR.M. Mohr-TidwellD.C. PelusoR.S. FultonM.P. Leckie(1997) A collection of 1814 human chromosome 7-specific STSs. Genome Res. 7:59–66.
- ↵P. Bray-WardJ. MenningerJ. LiemanT. DesaiN. MokadyA. BanksD.C. Ward(1996) Integration of the cytogenetic, genetic, and physical maps of the human genome by FISH mapping of CEPH YAC clones. Genomics 32:1–14.
- ↵B.H. BrownsteinG.A. SilvermanR.D. LittleD.T. BurkeS.J. KorsmeyerD. SchlessingerM.V. Olson(1989) Isolation of single-copy human genes from a library of yeast artificial chromosome clones. Science 244:1348–1351.
- ↵D.T. BurkeG.F. CarleM.V. Olson(1987) Cloning of large segments of exogenous DNA into yeast by means of artificial chromosome vectors. Science 236:806–812.
- ↵I. ChumakovP. RigaultS. GuillouP. OugenA. BillautG. GuasconiP. GervyI. LeGallP. SoularueL. Grinas(1992a) Continuum of overlapping clones spanning the entire human chromosome 21q. Nature 359:380–387.
- ↵I.M. ChumakovI. Le GallA. BillaultP. OugenP. SoularueS. GuillouP. RigaultH. BuiM.-F. De TandE. Barillot(1992b) Isolation of chromosome 21-specific yeast artificial chromosomes from a total human genome library. Nature Genet. 1:222–225.
- ↵I.M. ChumakovP. RigaultI. Le GallC. Bellanne-ChantelotA. BillaultS. GuillouP. SoularueG. GuasconiE. PoullierI. Gros(1995) A YAC contig map of the human genome. Nature 377:175–297.
- ↵D. CohenI. ChumakovJ. Weissenbach(1993) A first-generation physical map of the human genome. Nature 366:698–701.
- ↵F.S. Collins(1995) Positional cloning moves from perditional to traditional. Nature Genet. 9:347–350.
- ↵F. CollinsD. Galas(1993) A new five-year plan for the U.S. human genome project. Science 262:43–46.
- ↵J.E. CollinsC.G. ColeL.J. SminkC.L. GarrettM.A. LevershaC.A. SoderlundG.L. MaslenL.A. EverettK.M. RiceA.J. Coffey(1995) A high-density YAC contig map of human chromosome 22. Nature 377:367–379.
- ↵D.R. CoxM. BurmeisterE.R. PriceS. KimR.M. Myers(1990) Radiation hybrid mapping: A somatic cell genetic method for constructing high-resolution maps of mammalian chromosomes. Science 250:245–250.
- ↵D.R. CoxE.D. GreenE.S. LanderD. CohenR.M. Myers(1994) Assessing mapping progress in the human genome project. Science 265:2031–2032.
- ↵H.R. CrolliusM.T. RossA. GrigorievC.J. KnightsE. HollowayJ. MisfudK. LiM. PlayfordS.G. GregoryS.J. Humphray(1996) An integrated YAC map of the human X chromosome. Genome Res. 6:943–955.
- ↵M.E. CurranI. SplawskiK.W. TimothyG.M. VincentE.D. GreenM.T. Keating(1995) A molecular basis for cardiac arrhythmia: HERG mutations cause long QT syndrome. Cell 80:795–803.
- ↵J. DaussetP. OugenH. AbderrahimA. BillaultJ.-L. SambucyD. CohenD. Le Paslier(1992) The CEPH YAC library. Behring Inst. Mitt. 91:13–20.
- ↵C. DibS. FaureC. FizamesD. SamsonN. DrouotA. VignalP. MillasseauS. MarcJ. HazanE. Seboun(1996) A comprehensive genetic map of the human genome based on 5,264 microsatellites. Nature 380:152–154.
- ↵N.A. DoggettL.A. GoodwinJ.G. TesmerL.J. MeinckeD.C. BruceL.M. ClarkM.R. AltherrA.A. FordH.-C. ChiB.L. Marrone(1995) An integrated physical map of human chromosome 16. Nature 377:335–365.
- ↵S. FooteD. VollrathA. HiltonD.C. Page(1992) The human Y chromosome: Overlapping DNA clones spanning the euchromatic region. Science 258:60–66.
- ↵R.M. GemmillI. ChumakovP. ScottB. WaggonerP. RigaultJ. CypserQ. ChenJ. WeissenbachK. GardinerH. Wang(1995) A second-generation YAC contig map of human chromosome 3. Nature 377:299–319.
- ↵E.D. Green(1993) Physical mapping of human chromosomes: Generation of chromosome-specific sequence-tagged sites. in Methods in molecular genetics (Volume 1: Gene and chromosome analysis, Part A) ed K.W. Adolph(Academic Press, Inc.) pp 192–210, San Diego, CA..
- ↵E.D. GreenP. Green(1991) Sequence-tagged site (STS) content mapping of human chromosomes: Theoretical considerations and early experiences. PCR Methods Applic. 1:77–90.
- ↵E.D. GreenM.V. Olson(1990a) Chromosomal region of the cystic fibrosis gene in yeast artificial chromosomes: A model for human genome mapping. Science 250:94–98.
- ↵(1990b) Systematic screening of yeast artificial-chromosome libraries by use of the polymerase chain reaction. Proc. Natl. Acad. Sci. 87:1213–1217, ibid.
- ↵E.D. GreenR.M. MohrJ.R. IdolM. JonesJ.M. BuckinghamL.L. DeavenR.K. MoyzisM.V. Olson(1991a) Systematic generation of sequence-tagged sites for physical mapping of human chromosomes: application to the mapping of human chromosome 7 using yeast artificial chromosomes. Genomics 11:548–564.
- ↵E.D. GreenH.C. RiethmanJ.E. DutchikM.V. Olson(1991b) Detection and characterization of chimeric yeast artificial-chromosome clones. Genomics 11:658–669.
- ↵E.D. GreenJ.R. IdolR.M. Mohr-TidwellV.V. BradenD.C. PelusoR.S. FultonH.F. MassaC.L. MagnessA.M. WilsonJ. Kimura(1994) Integration of physical, genetic and cytogenetic maps of human chromosome 7: Isolation and analysis of yeast artificial chromosome clones for 117 mapped genetic markers. Hum. Mol. Genet. 3:489–501.
- ↵E.D. GreenV.V. BradenR.S. FultonR. LimM.S. UeltzenD.C. PelusoR.M. Mohr-TidwellJ.R. IdolL.M. SmithI. Chumakov(1995) A human chromosome 7 yeast artificial chromosome (YAC) resource: Construction, characterization, and screening. Genomics 25:170–183.
- ↵G. GyapayJ. MorissetteA. VignalC. DibC. FizamesP. MillasseauS. MarcG. BernardiM. LathropJ. Weissenbach(1994) The 1993–94 Genethon human genetic linkage map. Nature Genet. 7:246–249.
- ↵T.D. HowardW.A. PaznekasE.D. GreenL.C. ChiangN. MaR.I.O. De LunaC.G. DelgadoM. Gonzalez-RamosA.D. KlineE.W. Jabs(1997) Mutations in TWIST, a basic helix-loop-helix transcription factor, in Saethre-Chotzen syndrome. Nature Genet. 15:36–41.
- ↵T.J. HudsonL.D. SteinS.S. GeretyJ. MaA.B. CastleJ. SilvaD.K. SlonimR. BaptistaL. KruglyakS.-H. Xu(1995) An STS-based map of the human genome. Science 270:1945–1954.
- ↵N.J. JonesS.A. StewartL.H. Thompson(1990) Biochemical and genetic analysis of the Chinese hamster mutants irs1 and irs2 and their comparison to cultured ataxia telangiectasia cells. Mutagenesis 5:15–23.
- ↵J. KereR. NagarajaS. MummA. CiccodicolaM. D’UrsoD. Schlessinger(1992) Mapping human chromosomes by walking with sequence-tagged sites from end fragments of yeast artificial chromosome inserts. Genomics 14:241–248.
- ↵K. KrauterK. MontgomeryS.-J. YoonJ. LeBlanc-StraceskiB. RenaultI. MarondelV. HerdmanL. CupelliA. BanksJ. Lieman(1995) A second-generation YAC contig map of human chromosome 12. Nature 377:321–333.
- ↵J. KunzS.W. SchererI. KlawitzS. SoderY.-Z. DuN. SpeichM. Kalff-SuskeH.H.Q. HengL.-C. TsuiK.-H. Grzeschik(1994) Regional localization of 725 human chromosome 7-specific yeast artificial chromosome clones. Genomics 22:439–448.
- ↵N.E. Morton(1991) Parameters of the human genome. Proc. Natl. Acad. Sci. 88:7474–7476.
- ↵J.C. MurrayK.H. BuetowJ.L. WeberS. LudwigsenT. Scherpbier-HeddemaF. ManionJ. QuillenV.C. SheffieldS. SundenG.M. Duyk(1994) A comprehensive human linkage map with centimorgan density. Science 265:2049–2054.
- ↵R. NagarajaS. MacMillanJ. KereC. JonesS. GriffinM. SchmatzJ. TerrellM. ShomakerC. JermakC. Hott(1997) X chromosome map at 75-kb STS resolution, revealing extremes of recombination and GC content. Genome Res. 7:210–222.
- ↵M.V. Olson(1993) The human genome project. Proc. Natl. Acad. Sci. 90:4338–4344.
- ↵(1995) A time to sequence. Science 270:394–396, ibid.
- ↵M.V. OlsonP. Green(1993) Criterion for the completeness of large-scale physical maps of DNA. Cold Spring Harbor Symp. Quant. Biol. LVIII:349–355.
- ↵M. OlsonL. HoodC. CantorD. Botstein(1989) A common language for physical mapping of the human genome. Science 245:1434–1435.
- ↵M.J. PalazzoloS.A. SawyerC.H. MartinD.A. SmollerD.L. Hartl(1991) Optimized strategies for sequence-tagged-site selection in genome mapping. Proc. Natl. Acad. Sci. 88:8034–8038.
- ↵S. QinN.J. NowakJ. ZhangS.N.J. SaitP.G. MayersM.J. HigginsY.-J. ChengL. LiD.J. MunroeD.S. Gerhard(1996) A high-resolution physical map of human chromosome 11. Proc. Natl. Acad. Sci. 93:3149–3154.
- ↵J. QuackenbushC. DaviesJ.M. BailisJ.V. KhristichK. DiggleY. MarchuckJ. TobinS.P. ClarkA. RodkinsS. Marcano(1995) An STS content map of human chromosome 11: Localization of 910 YAC clones and 109 islands. Genomics 29:512–525.
- ↵H.C. RiethmanR.K. MoyzisJ. MeyneD.T. BurkeM.V. Olson(1989) Cloning human telomeric DNA fragments into Saccharomyces cerevisiae using a yeast artificial-chromosome vector. Proc. Natl. Acad. Sci. 86:6240–6244.
- ↵L. RilesJ.E. DutchikA. BakthaB.K. McCauleyE.C. ThayerM.P. LeckieV.V. BradenJ.E. DepkeM.V. Olson(1993) Physical maps of the six smallest chromosomes of Saccharomyces cerevisiae at a resolution of 2.6 kilobase pairs. Genetics 134:81–150.
- ↵G.M. Rubin(1996) Around the genomes: The Drosophila genome project. Genome Res. 6:71–79.
- ↵S. SacconeS. CaccioJ. KusudaL. AndreozziG. Bernardi(1996) Identification of the gene-richest bands in human chromosomes. Gene 174:85–94.
- ↵S.W. SchererB.J. TompkinsL.-C. Tsui(1992) A human chromosome 7-specific genomic DNA library in yeast artificial chromosomes. Mamm. Genome 3:179–181.
- ↵S.W. SchererJ.M. RommensS. SoderE. WongN. PlavsicB.J.F. TompkinsA. BeattieJ. KimL.-C. Tsui(1993) Refined localization and yeast artificial chromosome (YAC) contig-mapping of genes and DNA segments in the 7q21-q32 region. Hum. Mol. Genet. 2:751–760.
- ↵G.D. SchulerM.S. BoguskiE.A. StewartL.D. SteinG. GyapayK. RiceR.E. WhiteP. Rodriguez-TomeA. AggarwalE. Bajorek(1996) A gene map of the human genome. Science 274:540–546.
- ↵H. ShizuyaB. BirrenU.-J. KimV. MancinoT. SlepakY. TachiiriM. Simon(1992) Cloning and stable maintenance of 300-kilobase-pair fragments of human DNA in Escherichia coli using an F-factor-based vector. Proc. Natl. Acad. Sci. 89:8794–8797.
- ↵E.A. StewartK.B. McKusickA. AggarwalE. BajorekS. BradyA. ChuN. FangD. HadleyM. HarrisS. Hussain(1997) An STS-based radiation hybrid map of the human genome. Genome Res. 7:422–433.
- ↵J.W. TouchmanG.G. BouffardL.A. WeintraubJ.R. IdolL. WangC.M. RobbinsJ.C. NussbaumM. LovettE.D. Green(1997) 2006 expressed-sequence tags derived from human chromosome 7-enriched cDNA libraries. Genome Res. 7:281–292.
- ↵B. TraskG. van den EnghB. MayallJ.W. Gray(1989) Chromosome heteromorphism quantified by high- resolution bivariate flow karyotyping. Am. J. Hum. Genet. 45:739–752.
- ↵Utah Marker Development Group (1995) A collection of ordered tetranucleotide-repeat markers from the human genome. Am. J. Hum. Genet. 57:619–628.
- ↵M. VaudinA. RoopraL. HillierR. BrinkmanJ. SulstonR.K. WilsonR.H. Waterston(1995) The construction and analysis of M13 libraries prepared from YAC DNA. Nucleic Acids Res. 23:670–674.
- ↵L. VilageliuC. Tyler-Smith(1992) Structural instability of YAC clones and the use of recombination-deficient yeast host strains. in Techniques for the analysis of complex genomes, ed R. Anand(Academic Press Limited, London, UK), pp 93–112.
- ↵D. VollrathS. FooteA. HiltonL.G. BrownP. Beer-RomeroJ.S. BoganD.C. Page(1992) The human Y chromosome: A 43-interval map based on naturally occurring deletions. Science 258:52–59.
- ↵M.A. WalterD.J. SpillettP. ThomasJ. WeissenbachP.N. Goodfellow(1994) A method for constructing radiation hybrid maps of whole genomes. Nature Genet. 7:22–28.
- ↵J. WeissenbachG. GyapayC. DibA. VignalJ. MorissetteP. MillasseauG. VaysseixM. Lathrop(1992) A second-generation linkage map of the human genome. Nature 359:794–801.
- ↵G.K.-S. WongJ. YuE.C. ThayerM.V. Olson(1997) Multiple-complete-digest restriction fragment mapping: Generating sequence-ready maps for large-scale DNA sequencing. Proc. Natl. Acad. Sci. 94:5225–5230.
- ↵J. ZhangJ. OstellK. Rudd(1994) ChromoScope: A graphic interactive browser for E. coli data expressed in the NCBI data model. in Proceedings of the Twenty-Seventh Annual Hawaii International Conference on System Sciences (Vol. V) ed L. Hunter(IEEE Computer Society Press, Los Alamitos, CA), pp 58–67.