Abstract
Analyzing omics data in the context of pathway knowledge is critical for understanding the molecular mechanisms underlying pathological changes. However, current pathway analysis methods do not model the detailed mechanistic nature of biological interactions, limiting the understanding of pathway behavior to a relatively shallow level. To address this issue, we present a knowledge-driven machine learning framework that embeds features into pathway graphs and models reactions analytically, producing interpretable feature hierarchies and subnetworks in which functional associations are estimated to model biological interactions. The approach is agnostic to feature selection, enabling the use of full omics data sets without discarding weak signals. Applications to breast cancer microRNA–gene regulation data and COVID-19 metabolomic data highlight immune and metabolic pathways relevant to disease progression. This framework bridges predictive modeling with mechanistic interpretation and offers a foundation for integrative pathway analysis.
Elucidating the mechanistic basis of biological pathways and their responses to pathological changes is a foundational challenge in systems biology and clinical research. Biological pathways and networks organize interactions among genes, proteins, and metabolites that collectively shape cellular phenotypes and disease processes (Barabási and Oltvai 2004). The proliferation of high-throughput multiomic technologies has produced large volumes of data describing these molecular entities at single-feature resolution, facilitating the identification of biomarkers and network markers associated with disease states (The Cancer Genome Atlas Network 2012; Karczewski and Snyder 2018).
However, the mechanistic interpretation of these complex data sets remains a central challenge. Traditional approaches that focus on single-gene or single-feature analyses often miss the broader context of coordinated biological processes; such reductionist methods frequently yield lists of putative biomarkers that are difficult to validate mechanistically and clinically (Khatri et al. 2012). Pathway-level analysis has emerged as a powerful alternative, allowing researchers to contextualize molecular changes within functional networks, improve statistical power, reduce false positives, and produce biologically interpretable results. This shift has accelerated progress in clinical biomarker discovery, disease subtyping, and pathway-centric drug targeting.
Nevertheless, a persistent obstacle remains: bridging the gap between associative patterns in the data and the underlying functional organization of biological systems. Traditional approaches to pathway analysis can be broadly classified as statistical enrichment methods or machine learning frameworks (Maghsoudi et al. 2022). Statistical enrichment tools typically identify pathways that are overrepresented among differentially expressed features, providing summary-level biological annotations that lack mechanistic detail (Kuleshov et al. 2016; Tamayo et al. 2016). In contrast, recent advances in machine learning enable high-dimensional modeling of omic data that incorporates pathway information, yielding powerful predictive models for clinical outcomes (Elmarakeby et al. 2021; Hartman et al. 2023). However, such models often have limited capacity to capture the functional dependencies inherent to biological networks and tend to operate as “black boxes” whose internal representations are difficult to interpret biologically (Cheng et al. 2023).
An emerging paradigm in computational biology seeks to reconcile predictive performance with mechanistic explainability by integrating prior biological knowledge, such as pathway topology, directly into machine learning architectures (Hartman et al. 2023). However, most strategies have relied on static graph embeddings or post hoc enrichment analysis and rarely address the need to model the functional strength of molecular interactions. From a biological perspective, the effect that one gene exerts on another, or the regulatory impact of a metabolite along a pathway is fundamentally a functional mapping that varies in strength, directionality, and context (Angermueller et al. 2016; Geyer et al. 2017).
In this work, we present a knowledge-driven, explainable machine learning framework that elevates pathway analysis from conventional association testing to rigorous functional approximation. Inspired by the universal approximation theorem (Hornik 1991), we construct a neural network whose connectivity mirrors curated biological pathway graphs. Each node corresponds to a molecular feature, and each edge reflects a documented biological interaction, ensuring that the model structure is biologically plausible and interpretable. Crucially, our framework learns explicit, parameterized functional approximators for each interaction, represented as trainable mappings that quantify how one molecule influences another along the pathway. This formulation naturally accommodates the propagation of signals, analogous to biological processes such as gene regulation, signal transduction, and metabolic control, by leveraging residual connections that encode both direct and context-dependent effects. As a result, each model weight serves as a candidate functional coefficient, offering a bridge between statistical learning and mechanistic hypothesis generation.
Overall, this work positions functional approximation as a principled and generalizable methodology for mechanistic pathway analysis by unifying biological knowledge graphs, multiomic integration, and explainable machine learning. Our framework supports deeper investigation of complex disease mechanisms and provides a foundation for biologically grounded precision medicine.
Results
Method overview
We propose a knowledge-driven machine learning framework for analyzing and interpreting omic data. Its main inputs are a feature-by-sample molecular data matrix, a supervised end point, a set of task-relevant centric features, and a prior biological graph whose nodes can be mapped to measured features. The first core component integrates selected centric features with their corresponding pathway or interaction neighborhoods (Fig. 1A). The workflow begins with raw-feature acquisition and task-driven feature selection, followed by construction of a pathway or interaction neighborhood around the selected centric features. Numerous studies have explored approaches for selecting features or biomarkers (Golub et al. 1999; Langfelder and Horvath 2008; Patti et al. 2012). Our framework is agnostic to the specific feature-selection method, provided that the selected features can be mapped to the supplied prior graph. This graph is not restricted to a gene regulatory network; depending on the application, it may represent miRNA–gene regulation, metabolic reactions, signaling pathways, protein–protein interactions, or a user-defined biological graph.
Overview of the PathNet workflow and model architecture. (A) Raw molecular features are acquired from omic platforms such as gene-expression profiling and LC–MS; candidate centric features are selected using biological knowledge and data-driven evidence; and pathway or interaction databases are used to construct the local prior graph around those centric features. (B) During model fitting, pathway-connected neighboring features are embedded toward selected biomarker/centric features through sparse graph-constrained connections, whereas unrelated features are excluded from the corresponding local propagation route. (C) After training, retained edge functions are used for downstream analysis, including subnetwork selection by pruning weak connections and functional analysis of learned edge-specific response curves. (D) The model architecture uses edge-specific functional approximation blocks and a sparse feed-forward propagation structure before the final softmax prediction layer.
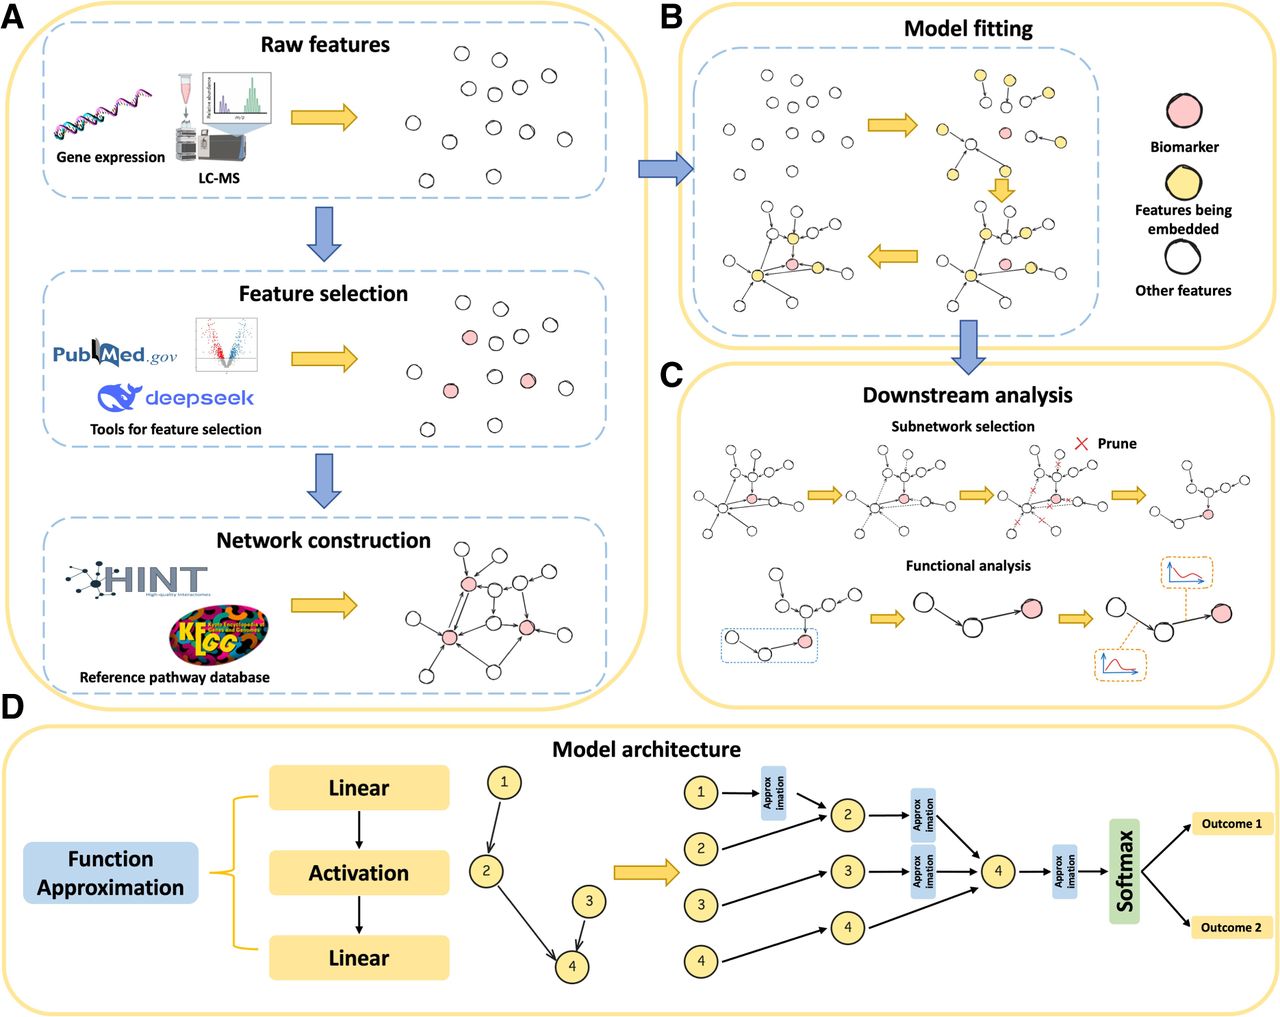
The second core component is a graph-constrained neural model (Fig. 1B,D). Each neuron represents a mapped molecular feature, and connections are established only when the corresponding features participate in documented or user-specified biological relationships. At each layer, predetermined marginal features transmit signals toward selected centric features through the prior graph neighborhood. The cumulative effect of these marginal vertices propagates through the network to the centric features, thereby characterizing pathway-constrained associations relevant to the supervised end point. Finally, the adjusted centric-feature representations are passed to a prediction head. In the two case studies presented here, this head is a multilayer perceptron (MLP) with softmax activation for clinical classification, but the overall framework is not conceptually limited to clinical outcomes and can be adapted to other supervised biological end points by choosing an appropriate prediction head and loss function.
A detailed functional-scope summary of the workflow, including the input, output, supported data types, and example applications of each step, is provided in Supplemental Table S1.
The model was implemented in PyTorch (Paszke et al. 2019) and trained with the Adam optimizer (Kingma and Ba 2015). All experiments were conducted on a workstation with dual Intel Xeon Platinum 8276L CPUs (112 threads) and dual NVIDIA RTX 3090 GPUs (24 GB each).
Application to breast cancer data
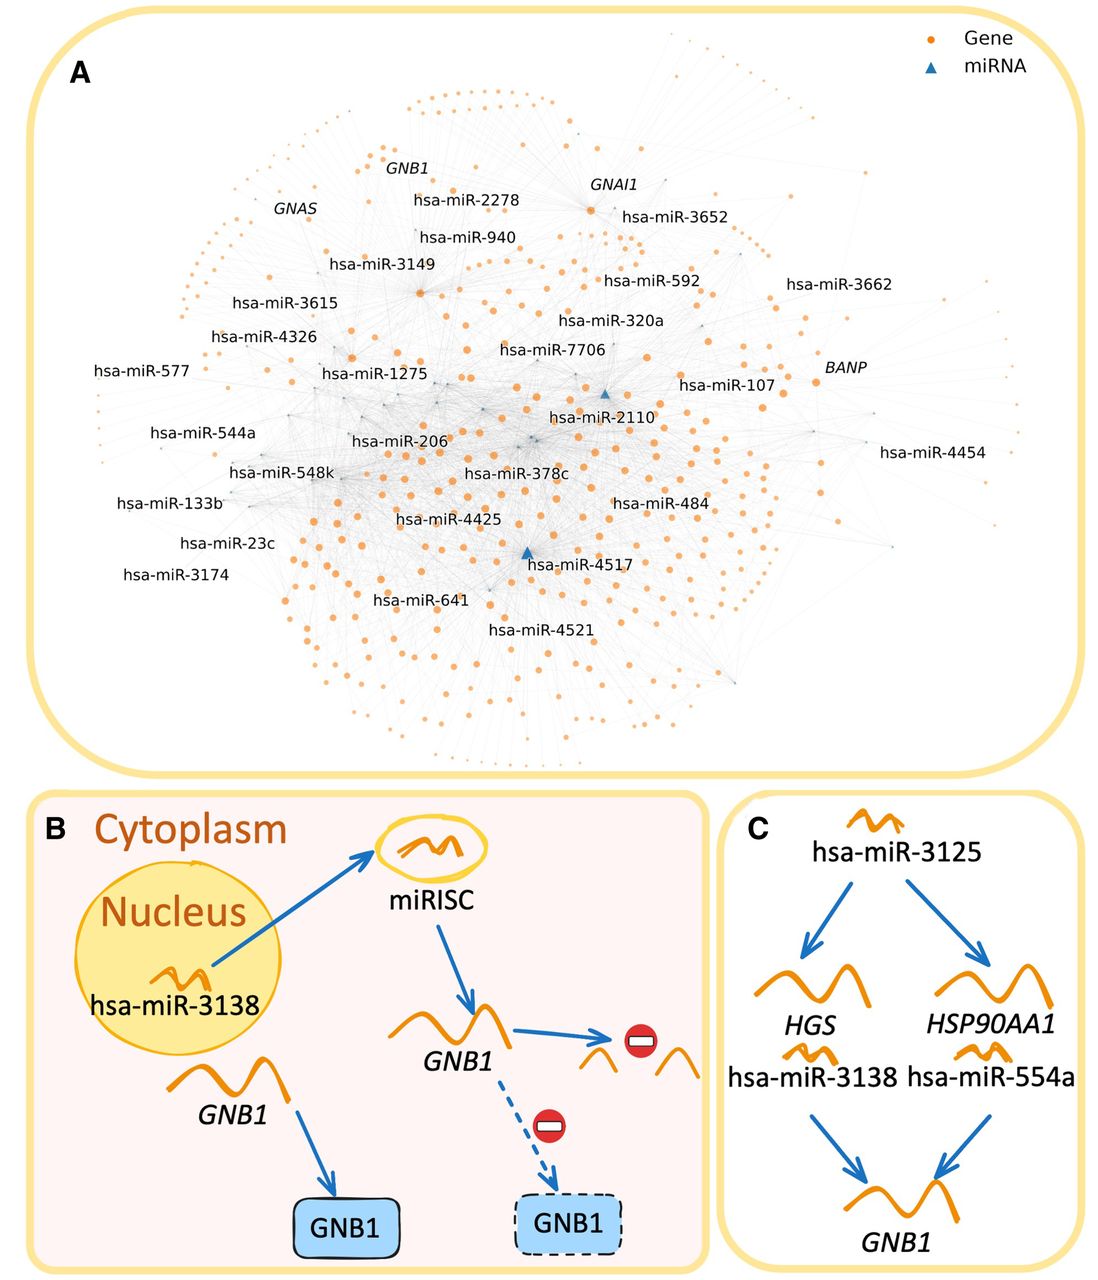
MicroRNAs (miRNAs) are small noncoding RNA molecules that regulate gene expression post-transcriptionally through the miRNA-induced silencing complex (miRISC), in which the mature miRNA guides the complex to complementary target mRNAs, resulting in translational repression or mRNA degradation (Fig. 2B,C; Bartel 2004; Fabian and Sonenberg 2012). For example, MIR373 (also known as hsa-miR-373) has been shown to activate gene expression by targeting promoter sequences in DNA (Place et al. 2008), underscoring the diverse regulatory roles of miRNAs beyond conventional mRNA targeting.
Overview of the breast cancer application. (A) Representative selected gene regulatory network used in the experiment. Larger nodes indicate higher-degree features in the graph. Nodes with a degree ≥30 are labeled. (B) Schematic of miRNA-mediated gene-expression regulation through miRISC. By associating with miRISC, MIR3138 (also known as hsa-miR-3138) targets GNB1 mRNA and reduces translation of the GNB1 protein. (C) One miRNA can target multiple genes, and one gene can be regulated by multiple miRNAs.
To investigate the influence of miRNAs on specific clinical outcomes mediated by gene regulation, we applied our method to the Cancer Genome Atlas breast cancer cohort TCGA-BRCA (The Cancer Genome Atlas Network 2012). For this analysis, we restricted our attention to matched miRNA expression (miRNA-seq) and gene expression (RNA-seq) profiles, thereby enabling a focused assessment of post-transcriptional regulatory interactions relevant to disease phenotype. We examined the association between miRNA and gene expression and a clinically relevant breast cancer phenotype, estrogen receptor (ESR1 [also known as ER]) status, which plays a pivotal role in tumor progression (Sørlie et al. 2003). Understanding how miRNAs and genes function within regulatory networks associated with ER status is therefore clinically important. A key advantage of our method is its ability to integrate diverse molecular interactions, provided that the relationship between any two molecular features is available. For gene–gene interactions, we used the HINT database (Das and Yu 2012); for miRNA–target gene interactions, we used multiMiR (Ru et al. 2014) to match miRNAs to their gene targets.
Identification of genes strongly regulated by miRNAs
After filtering out genes and miRNAs with low expression or those without valid matching relationships, we retained 8523 genes and 334 miRNAs for analysis. The model was trained with a batch size of 16 for 100 epochs. We set the maximum network depth, excluding the effects of miRNAs, to three and selected top-ranked features using a naive differential analysis, defined here as ranking features by their univariate statistical significance between case and control groups without multivariate modeling or extensive correction. Such approaches are commonly used as baselines in gene expression studies, in which simple t-tests or fold-change criteria serve as initial filters for candidate features (Robinson et al. 2010; Dalman et al. 2012; Love et al. 2014). The final model achieved an average test accuracy of 0.952. A representative partial view of the selected gene regulatory network is shown in Figure 2A. The complete plot of gene–miRNA pairs is available in Supplemental Figure S2.
Applying a stringent pruning threshold to the model enabled the identification of genes most strongly regulated by miRNAs, with potential relevance to ER positivity. Although our framework may not always capture precise functional relationships, it robustly prioritizes genes that are under substantial miRNA regulatory influence and may play a role in key biological processes. Notably, many of these genes have previously been implicated in ER signaling or tumor progression, lending credibility to the selected candidates (Fig. 3).
Selected miRNA–gene regulatory reaction sketches. The title of each plot identifies the miRNA and its target gene. The functional curves retain the original feature scales; steeper curves indicate larger learned per-unit associations on those scales, not larger unexplained residuals.
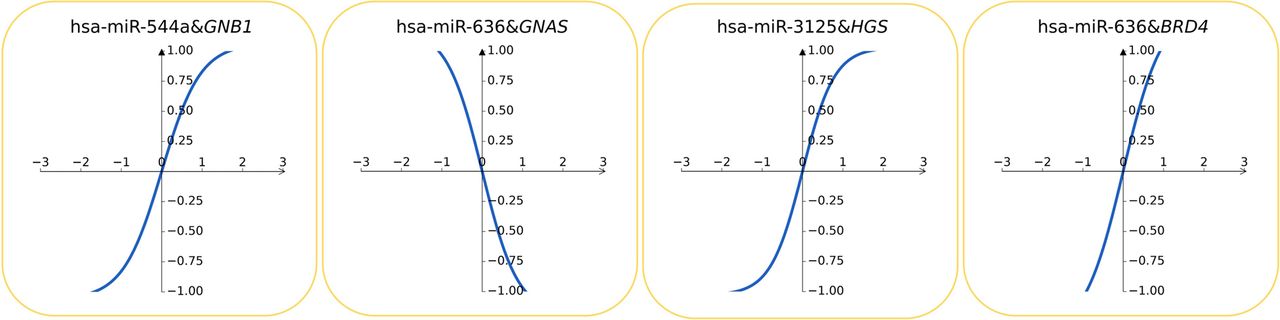
For example, studies have demonstrated that phytoestrogens such as genistein upregulate GNB1 expression through ESR1- and ESR2-dependent transcriptional activation, directly linking ER signaling to downstream G-protein modulation (Naragoni et al. 2009). Likewise, BRD4 has been shown to potentiate ER activity by binding to acetylated histones, whereas disruption of SWI/SNF components leads to increased BRD4 recruitment and sustained ER-driven proliferation, even during antiestrogen therapy (Nagarajan et al. 2020).
In addition to pairs with previously established roles in ER signaling, our analysis also prioritized several miRNA–gene associations for which no direct evidence is currently available in the literature. Among the top miRNA–gene pairs identified, both HGS (targeted by MIR3125, also known as hsa-miR-3125) and HSP90AA1 (also targeted by hsa-miR-3125) emerged as notable candidates, despite the absence of direct literature linking them to ER status in breast cancer. Hepatocyte growth factor–regulated tyrosine kinase substrate (HGS) encodes a protein involved in endosomal trafficking and the regulation of receptor tyrosine kinase (RTK) signaling. Although its role in modulating EGFR degradation and signal attenuation has been described in other malignancies, its potential involvement in hormone receptor pathways remains uncharacterized (Raiborg and Stenmark 2009). The identification of HGS in our analysis suggests that miRNA-mediated regulation of vesicular transport and RTK turnover could have as-yet unexplored implications for ER signaling or response to therapy.
Similarly, HSP90AA1 encodes a cytosolic heat shock protein 90 isoform, which functions as a molecular chaperone stabilizing a variety of client proteins, including many oncoproteins and kinases. HSP90 inhibitors have been investigated as potential therapeutics in several cancers, including breast cancer, largely because of their broad impact on oncogenic signaling networks (Trepel et al. 2010; Neckers and Workman 2012). However, there is limited direct evidence associating HSP90AA1 with ER status specifically. The emergence of HSP90AA1 as a prioritized target in our miRNA–gene network points to the possible importance of post-transcriptional regulation of protein homeostasis in ER-positive tumors, warranting further functional investigation.
Functional interpretation
Beyond the immediate effects of miRNA regulation, several of the identified genes possess known roles in tumor biology and gene–gene regulatory networks. For instance, FETUB has been characterized as a tumor suppressor in prostate cancer, acting through inhibition of the PI3K/AKT pathway and modulation of apoptotic processes (Zhan et al. 2020). FETUB may also exert inhibitory effects in estrogen-driven contexts, and its interaction with meprin A subunit alpha (MEP1A) further implicates it in extracellular matrix remodeling and inflammation (Denecke et al. 2003; Kim et al. 2014; Russo et al. 2016; Bayly-Jones et al. 2022).
FOXG1 is another notable candidate gene. Its encoded protein can function as a tumor suppressor by disrupting the NCOA3 (AIB1)–E2F1–SP1–EP300 transcriptional activation complex at the NCOA3 promoter (Oh et al. 2008; Li et al. 2013). Although FOXG1 protein does not directly interact with the ER, repression of NCOA3, which encodes the critical ER coactivator AIB1, compromises ER-mediated transcription and affects breast cancer progression and treatment resistance (Louie et al. 2004; Lahusen et al. 2009). The clinical association between low expression of this gene and poor prognosis underscores the relevance of this axis. Other selected genes and pathways are provided in Supplemental Figure S3. Additional retained-network visualizations for the TCGA-BRCA and COVID-19 analyses are provided in Supplemental Figure S4.
A module-level reading of the complete retained TCGA-BRCA topology further supports this interpretation. Several retained edges form an HSP90/CDC37-centered chaperone-signaling neighborhood connected to ESR1, EGFR, AKT1, FKBP5, HSP90AA1, and HSP90AB1. This is consistent with the established role of HSP90 as a cancer chaperone for steroid-receptor and kinase clients and with CDC37 as an HSP90 cochaperone for kinase signaling (Trepel et al. 2010; Neckers and Workman 2012; Xu and Neckers 2012; Dhamad et al. 2016; Prince et al. 2023). The retained topology also highlights secondary modules with independent breast cancer support, including a MAPT-associated neighborhood related to ER-positive disease and taxane response (Rouzier et al. 2005; Andre et al. 2007) and a CALM1/CALM3–KCNJ3 ion-channel and calcium-signaling neighborhood in which KCNJ3 has been reported as a prognostic marker in ER-positive breast cancer (Kammerer et al. 2016). We therefore interpret the TCGA-BRCA result at the pathway-module level rather than as experimental validation of every retained edge or miRNA–gene pair.
Although the precise mechanistic cascades connecting these genes to ER status cannot be definitively established in this analysis, the literature support for their involvement in ER-associated pathways underscores the utility of knowledge-driven machine learning for hypothesis generation in molecular oncology. Further experimental validation and multiomic integration are warranted to elucidate the underlying biological mechanisms.
Application to COVID-19 metabolomic data
The robustness and flexibility of our knowledge-driven framework were further evaluated using liquid chromatography–mass spectrometry (LC–MS) data from patients with COVID-19. LC–MS is widely used in untargeted metabolomics to profile metabolites comprehensively in biological samples (Dunn et al. 2011). However, the complexity of LC–MS data presents several analytical challenges, including signal drift, matrix effects, and difficulty identifying metabolites across wide chemical diversity and concentration ranges (Broadhurst et al. 2018). Moreover, preprocessing steps such as peak alignment, noise filtering, and normalization must be optimized rigorously to ensure accuracy and reproducibility (Want et al. 2010). Addressing these challenges is critical to advancing untargeted metabolomics and biomarker discovery in disease research.
We used our knowledge-driven modeling approach to analyze the ST001849 COVID-19 metabolomic data set (Sindelar et al. 2021). The data set comprises 609 longitudinal LC–MS profiles annotated according to subsequent admission to the intensive care unit (ICU). The raw LC–MS data were obtained from the Metabolomics Workbench and processed using apLCMS (Yu et al. 2009), followed by batch-effect correction with ComBat (Leek et al. 2012). A total of 913 metabolites were matched and integrated into the pathway network using KEGG metabolic pathways as a reference (Kanehisa and Goto 2000). This case study highlights the potential of our framework to interpret high-dimensional metabolomic data and identify clinically relevant molecular features in COVID-19.
LLM-enhanced feature selection
Recent advances in large language models (LLMs) have enabled the integration of domain knowledge into computational workflows across biomedical research (Brown et al. 2020; Guo et al. 2025). In this study, we employed DeepSeek, a state-of-the-art LLM, to augment the feature selection process by prioritizing metabolites with potential clinical relevance to severe COVID-19 outcomes. The LLM-driven approach distills instructive information from existing biochemical databases and literature, facilitating the identification of functionally important metabolites from high-dimensional LC–MS data and streamlining the analytical pipeline.
After filtering, the selected metabolites associated with severe COVID-19 symptoms are listed in Table 1. LLM-assisted feature selection not only improves interpretability but also offers a pragmatic approach to extracting actionable biological knowledge from complex omic data sets. For instance, our analysis highlighted beta-hydroxybutyric acid (BHB) as a top candidate. BHB, a ketone body produced under metabolic stress, has been shown to modulate immune responses by inhibiting the NLRP3 inflammasome, a central driver of cytokine storms in severe COVID-19 (Youm et al. 2015). Furthermore, BHB may exert antiviral effects by altering cellular metabolism and restricting viral replication (Codo et al. 2020).
LLM-selected metabolites with their KEGG IDs
| KEGG ID | Name |
|---|---|
| C00328 | L-Kynurenine |
| C00186 | (S)-Lactate |
| C00584 | Prostaglandin E2 |
| C02165 | Leukotriene B4 |
| C00696 | Prostaglandin D2 |
| C01089 | (R)-3-Hydroxybutanoate (beta-hydroxybutyric acid) |
| C00042 | Succinate |
| C06124 | Sphingosine 1-phosphate |
| C00249 | Hexadecanoic acid |
| C00780 | Serotonin |
Metabolic subnetwork associated with COVID-19 progression
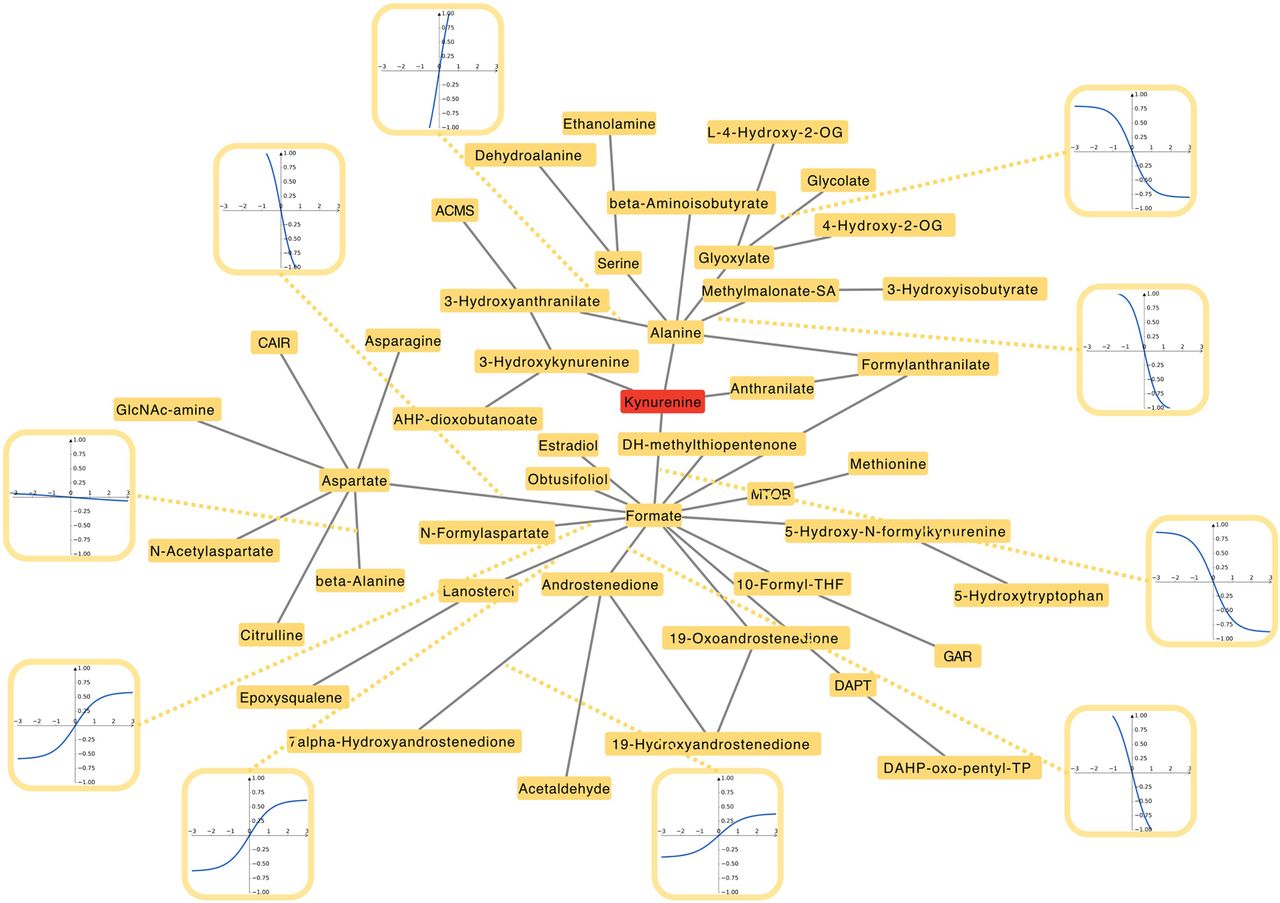
The model was trained for 100 epochs with a batch size of 16 and a maximum depth of three, achieving an average test accuracy of 0.725. Among the selected metabolites and pathways, the tryptophan metabolic pathway (see Fig. 4) was particularly prominent. Dysregulation of tryptophan metabolism has been implicated in the pathogenesis of severe COVID-19 and SARS, especially through its immunomodulatory effects. Tryptophan is metabolized through the kynurenine pathway, which is activated by proinflammatory cytokines such as interferon-gamma (IFNG protein), leading to the production of immunoregulatory metabolites such as kynurenine. Elevated kynurenine levels have been associated with immune suppression and increased COVID-19 severity, potentially exacerbating viral persistence and hyperinflammation (Thomas et al. 2020). In addition, prostaglandins (PGs), particularly prostaglandin E2 (PGE2), play a central role in modulating inflammatory responses during viral infections. Overproduction of PGE2 has been linked to cytokine storms and acute respiratory distress syndrome (ARDS) in severe COVID-19 because it enhances vascular permeability and leukocyte recruitment (Chen et al. 2018). Several reactions in this pathway are also shown in Figure 4. For example, the retained neighborhood includes formate- and amino acid–related nodes such as alanine, aspartate, and serine, linking the selected COVID-19 metabolites to one-carbon and amino acid metabolism. Formate donates one-carbon units for purine biosynthesis (Pietzke et al. 2020). Although direct links are lacking, mitochondrial dysfunction and energy imbalance have been reported consistently in severe COVID-19 (Saleh et al. 2020). Together, these metabolic perturbations highlight the therapeutic potential of targeting tryptophan and PG pathways to mitigate severe disease outcomes.
Representative retained COVID-19 metabolomic subnetwork centered on the tryptophan/kynurenine and one-carbon/amino acid neighborhood. Each node represents a metabolite, and each edge denotes a retained KEGG-constrained model connection after pruning. Node labels are shown as metabolite names rather than KEGG identifiers. To preserve readability, only a subset of representative edge-specific functional curves are displayed with consistent panel dimensions. The functional curves retain the original feature scales; steeper curves indicate larger learned per-unit associations on those scales, not larger unexplained residuals. An edge without a curve inset is still retained, whereas pruned edges are not drawn in the subnetwork.
The arachidonic acid (AA) metabolism pathway, which encompasses both PGs and leukotrienes (LTs), was also selected and plays a pivotal role in the inflammatory response associated with severe COVID-19 and SARS infections. Following viral invasion, phospholipase A2 enzymes release AA from membrane phospholipids; cyclooxygenase (COX) and lipoxygenase (LOX) enzymes then metabolize AA into PGs and LTs, respectively. PGs, particularly PGE2, mediate fever, vasodilation, and pain, whereas LTs (LTB4 and cysteinyl-LTs) promote neutrophil recruitment and bronchoconstriction, thereby exacerbating respiratory distress in severe cases (Ricciotti and FitzGerald 2011; Chen et al. 2018). Evidence indicates that SARS-CoV-2 infection upregulates PTGER2 (also known as COX-2) protein expression, resulting in excessive PG production that may contribute to cytokine storms and acute lung injury (Chen et al. 2021). Furthermore, LT-driven inflammation has been implicated in pulmonary fibrosis, a long-term sequela of severe COVID-19 (Aigner et al. 2020). Accordingly, pharmacological inhibition of AA metabolites, for example, with PTGER2 inhibitors or LT receptor antagonists, has been proposed as a strategy to attenuate hyperinflammation in severe viral infections (Aigner et al. 2020; Ahmadi et al. 2022).
Figure 4 is a representative partial view of the pruned COVID-19 retained-edge network, not a complete drawing of all retained model edges. Auditing the full retained-edge topology identified 107 metabolite nodes and 105 retained edges, with a large connected component linking seven selected centric metabolites: succinate, L-kynurenine, PGE2, PGD2, serotonin, BHB, and LTB4. Lactate, hexadecanoic acid/palmitate, and sphingosine 1-phosphate were selected centric metabolites in the model input, but they did not have retained edges in the final pruned retained-edge topology. Additional retained-network visualizations for the COVID-19 and TCGA-BRCA analyses are provided in Supplemental Figure S4.
The retained edges are consistent with several KEGG metabolic neighborhoods that have strong COVID-19 support. First, the tryptophan branch connects L-kynurenine to anthranilate, 3-hydroxy-L-kynurenine, and formate, whereas a nearby serotonin branch links tryptophan, 5-hydroxy-L-tryptophan, serotonin, N-acetylserotonin, and melatonin-related metabolites. This supports a more specific interpretation than simply selecting tryptophan metabolism, because both the kynurenine immune-regulatory arm and the serotonin/melatonin arm are retained, consistent with COVID-19 studies reporting altered kynurenine-, fatty-acid-, serotonin-, and melatonin-related metabolism in severe disease (Thomas et al. 2020; Wu et al. 2020; Roberts et al. 2022). Second, the eicosanoid neighborhood connects PGE2, PGD2, LTB4, PGH2, PGF2α, PGI2, 20-OH-LTB4, and HETE/HPETE intermediates, aligning the retained topology with AA inflammatory lipid signaling reported in severe COVID-19 lung inflammation (Ricciotti and FitzGerald 2011; Chen et al. 2018; Archambault et al. 2021).
The complete retained topology also adds a biological context that was not explicit in the original figure discussion. A dense arginine/nitrogen-metabolism neighborhood links L-arginine with L-citrulline, L-ornithine, urea, beta-alanine, guanidinoacetate, aspartate, and fumarate, matching COVID-19 metabolomic and vasculopathy literature on amino acid remodeling, arginine depletion, nitric-oxide biology, and endothelial dysfunction (Shen et al. 2020; Durante 2022). In parallel, succinate is connected to fumarate, malate, acetoacetate, carnitine, and O-acetylcarnitine-related metabolites, whereas BHB is linked through acetoacetate. This supports a metabolic-stress interpretation involving TCA-related intermediates, ketone-body metabolism, and carnitine-linked lipid oxidation, consistent with reports of mitochondrial and ketogenesis disruption in severe COVID-19 (Saleh et al. 2020; Karagiannis et al. 2022). Finally, the high-connectivity formate/10-formyltetrahydrofolate neighborhood links one-carbon transfer and purine-related intermediates; this is a supporting KEGG-consistency signal rather than the primary COVID-19 mechanism, but it is compatible with reports that SARS-CoV-2 can remodel folate and one-carbon metabolism for nucleotide biosynthesis (Pietzke et al. 2020; Zhang et al. 2021).
Lactic acid was also selected as a biomarker. Its accumulation can exacerbate immune dysregulation by suppressing antiviral T cell responses and promoting cytokine storms, a hallmark of severe COVID-19 (Gupta 2022). Additionally, lactate has been shown to stabilize hypoxia inducible factor 1 subunit alpha (HIF1A), which enhances viral replication by upregulating expression of the angiotensin-converting enzyme 2 (ACE2) receptor, the primary entry receptor for SARS-CoV-2 (Codo et al. 2020). These findings suggest that lactic acid not only serves as a biomarker of disease severity but also contributes actively to the progression of severe viral infections by modulating host metabolism and immune responses. However, no pathway-matched metabolites interacting with lactic acid were detected, suggesting that further analysis is needed to characterize its local metabolic context. More reactions between metabolites are presented in Supplemental Figure S1. In Figure 4, the topology graph displays a readable partial subnetwork, whereas the small functional-curve insets are shown only for selected representative retained edges to preserve readability. Therefore, the absence of a curve inset on an edge does not indicate that the edge was pruned or unused; pruned edges are removed from the displayed retained-edge subnetwork.
Collectively, these results illustrate the value of combining LLM-guided feature selection with knowledge-driven machine learning to prioritize biologically and clinically relevant metabolic subnetworks.
Simulation and ablation study
Simulation design
To evaluate how PathNet behaves when prior biological knowledge is imperfect, we replaced the original simulation description with a controlled prior-robustness simulation in which the true signal routes are known. Each synthetic graph was generated as 30 disconnected pathway-like modules. In the default full setting, six modules contained true centric targets and six separate modules provided decoy targets. Within each signal module, the target node was connected to inner nodes, inner nodes were connected to middle nodes, and middle nodes were connected to informative source nodes, producing source–middle–inner–target routes. The class signal was not assigned directly to the target nodes. Successful prediction therefore required the supplied graph prior and a sufficient propagation depth to route source-node information into the selected centric-feature neighborhood.
For each simulated data set, all molecular measurements were first sampled as noisy continuous features. Informative source nodes then received signed class-dependent shifts with source-specific weights, whereas noninformative nodes remained background noise. Labels were generated from the average signed source signal across the true signal modules plus Gaussian label noise and then were thresholded at the median to create balanced binary classes. Decoy modules received only weak nuisance shifts, so bad centric features were not trivially constant but did not provide reliable access to the label-generating signal. This design separates a genuinely correct prior from a factually wrong prior: A correct graph can connect true source nodes to selected centric targets, whereas a wrong decoy graph or fully bad centric features have no short route to the designed signal.
Simulation details
The full simulation used two data set sizes: 500 samples with 840 features and 900 samples with 1080 features. These correspond to 30 modules with 28 or 36 nodes per module. For each size, we ran five random seeds, producing 10 runs per prior-quality condition. Each run used stratified train/validation/test splits of 60%/20%/20%. PathNet was trained with Adam optimization, batch size 48, dropout 0.1, learning rate 10−3, and 90 epochs. We evaluated the correct graph at the default depth, correct-graph depth variants with a shallower or deeper neighborhood, a density-matched wrong decoy graph constrained to have no short route from selected targets to true source nodes, an unrestricted density-matched random graph, randomized layer-matched sparse masks, partial inner-layer randomization, fully bad centric features, and mixed bad-feature settings in which 25%, 50%, or 75% of true centric targets were replaced by decoy targets. The controlled simulation design and prior-robustness summary are shown in Figure 5.
Controlled prior-robustness simulation design and summary. Informative source nodes were placed three graph hops from true centric targets in pathway-like modules, and decoy targets were placed in separate modules. Performance under the correct graph prior is high and stable, whereas a wrong decoy graph and fully bad centric features are near chance. The random graph condition has larger variability because it can occasionally route true source nodes by chance.
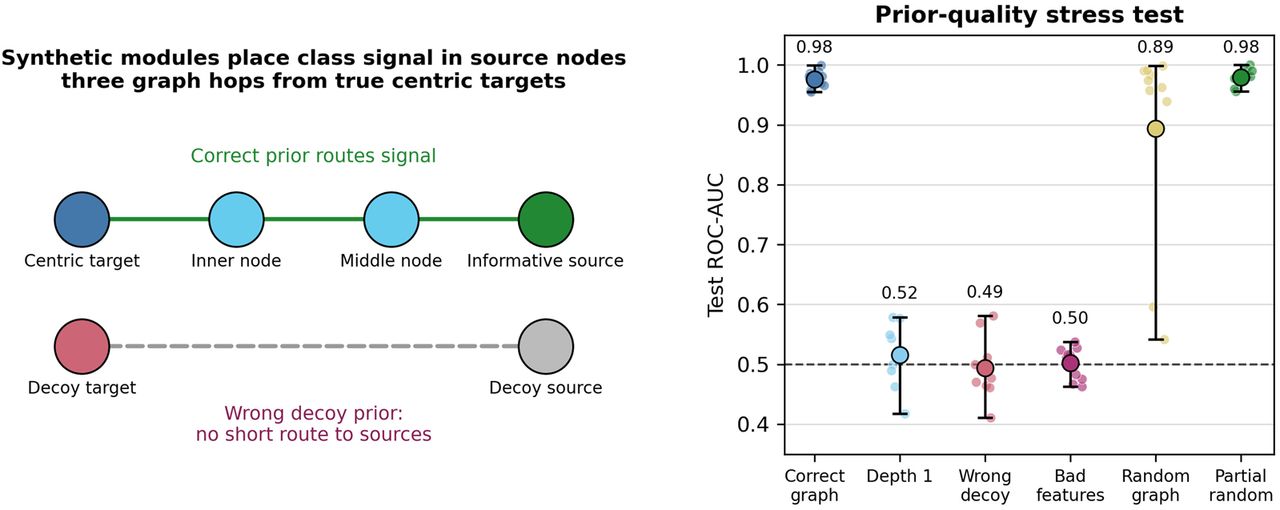
The results show three patterns. First, performance under the correct graph prior was high and stable, with ROC-AUC 0.976 ± 0.014 and balanced accuracy 0.970 ± 0.020. The shallower depth-1 model was near chance (ROC-AUC 0.515 ± 0.051) because it could not route the designed source signal, whereas the deeper depth-3 model recovered the signal similarly to the default depth (ROC-AUC 0.978 ± 0.011). Second, fully misleading priors failed: a strictly wrong decoy graph was near chance (ROC-AUC 0.494 ± 0.051), and fully bad centric features were also near chance (ROC-AUC 0.502 ± 0.027). Third, partially incorrect priors behaved more subtly. Unrestricted random graph priors had lower stability (ROC-AUC 0.893 ± 0.172) because they could occasionally route a few true source nodes by chance, and partial inner-layer randomization preserved prediction when the useful node set remained accessible (ROC-AUC 0.979 ± 0.014). Thus, predictive performance and pathway-edge interpretability must be separated: PathNet can remain predictive under some partial misspecification, but wrong wiring weakens the biological interpretation of retained edges.
Mixed bad-feature settings further support this interpretation. Replacing 25%, 50%, and 75% of the true centric targets with decoy targets still produced ROC-AUC values of 0.978 ± 0.015, 0.976 ± 0.013, and 0.970 ± 0.021, respectively, because enough true target modules remained to route the source signal. In contrast, replacing all centric targets with decoys removed access to the informative sources and reduced performance to chance. These results demonstrate that PathNet depends on biologically meaningful graph priors and centric features for edge-level interpretation and should not be treated as a causal-discovery method that can repair arbitrary false graph annotations.
The key interpretation is that prior quality affects prediction and biological interpretation through different mechanisms. If the selected centric features preserve access to informative source nodes, the classifier may remain accurate even when some inner wiring is randomized; however, the retained randomized edges no longer have a trustworthy biological meaning. Conversely, when the selected centric features or graph prior removes the route to the true source signal, both prediction and interpretation collapse. Additional details on graph generation, feature sampling, label construction, train/test splitting, stress-test conditions, and the corresponding real-data stress tests are provided in the Supplemental Material.
Discussion
A key advantage of our approach is the natural integration of omic data with their underlying pathway structures. This design ensures that the architecture and downstream analyses follow biologically meaningful logic. Consequently, all edges in the neural network are interpretable, offering insights into mechanistic behavior rather than serving solely as predictive associations. Additional real-data benchmarks against fully connected MLP and KAN baselines (Liu et al. 2025) indicate that this pathway-constrained design may not always maximize black-box predictive performance, but it provides direct pathway-edge-level interpretability that unconstrained models lack. To facilitate practical use, we have developed the package PathNet, which streamlines the application workflow and supports further exploration across diverse data sets.
Despite these strengths, several limitations remain. First, although our framework provides interpretable pathway-level insights, it cannot capture the full complexity of biological systems. Incomplete pathway annotation and context-dependent interactions restrict mechanistic resolution. Moreover, when modeling complex biochemical reactions among molecular features, embedding information solely from a pathway perspective yields only a partial understanding of reality and constrains interpretation of known reactions. Future work should consider probabilistic pathway modeling, as has been applied in graph-based analyses of spatial transcriptomics (Hu et al. 2021). Such approaches would enable not only adjustment of pathway annotations but also the discovery of undocumented interactions.
Second, the current implementation simplifies the directional, heterogeneous, and cyclic structure of biological networks when constructing the neural architecture. The supplied pathway graph is used as an undirected topological prior for neighborhood extraction and layer construction, so cycles or feedback loops in the original biological graph are not represented as recurrent computational loops. Instead, nodes are assigned to a finite number of layers according to graph distance from the selected centric features, and information is propagated through this feed-forward layer structure. This design improves stability and interpretability in the present applications, but it cannot represent every direction-specific biochemical relation or feedback-rich process. Future extensions should incorporate explicit node and edge types, direction-aware propagation, and reaction hierarchy when these details are central to interpretation.
The graph-depth parameter should also be interpreted as a practical implementation choice rather than as a universal biological scale. In the current version, a single maximum hop depth is used to extract neighborhoods around all centric features, which makes the architecture easy to construct, compare, and tune. However, biological pathways are not organized with a uniform effective radius: Some curated reactions represent immediate biochemical transformations, whereas others represent broader regulatory or pathway-context links. A more knowledge-faithful implementation would therefore choose propagation depth and local neighborhood boundaries in a feature- or pathway-specific manner, using the topology, interaction type, evidence quality, and biological question to decide which upstream or downstream nodes should be included. Such adaptive graph construction is better aligned with the goal of knowledge-informed modeling, and we view it as an important extension beyond the current fixed-depth implementation.
Third, PathNet learns an outcome-relevant, pathway-constrained representation rather than a complete map of all biologically meaningful moderate-effect features. As a result, its interpretation is constrained by the supervised end point: features or pathway branches that are biologically relevant but weakly reflected in a simple or coarse outcome may be pruned or excluded from the selected neighborhood. This is an inherent limitation of outcome-guided feature anchoring and pruning. Richer supervision, such as longitudinal outcomes, multitask labels, graded phenotypes, or more specific mechanistic readouts, may support larger graph neighborhoods and better retention of moderate-effect pathway signals, and we view this as an important direction for future evaluation.
In this study, we proposed an explainable machine learning framework for analyzing omic data within a knowledge-driven pathway context. The model accommodates both homogeneous and heterogeneous data types, demonstrating substantial flexibility. To our knowledge, this is the first approach to simultaneously leverage graph-structured pathway information and model reactions among features within a unified framework. By embedding marginal features and propagating informative signals through biological processes, the framework provides a biologically intuitive representation. Applications to both the miRNA–gene breast cancer data set and the COVID-19 LC–MS data set highlight the broad applicability of our method.
Methods
Knowledge-driven interpretable neural network
We introduce a novel neural network architecture based on a sparsely connected MLP. By constraining the network connectivity according to curated biological pathways, the design mitigates overfitting while retaining strong predictive ability and interpretability (Frankle and Carbin 2019). The central idea is to emulate biological signal transmission: Information from marginal molecular features flows along pathway connections toward a subset of biologically important centric features, which are ultimately used for outcome prediction.
Formally, let X ∈ ℝn×p denote the feature matrix, where n is the number of samples, and P is the number of molecular features; let y ∈ ℝn be the outcome labels. Prior biological knowledge is given in the form of a graph G = (V, E), where each vertex vi ∈ V represents a distinct molecular feature (e.g., a gene or metabolite), and each undirected edge eij ∈ E corresponds to a known biological interaction derived from pathway databases.
In the current implementation, directional information in curated pathway databases is not imposed as a hard architectural constraint. We use the pathway graph primarily as a topological prior: Edges define documented relationships and are treated as undirected when computing graph neighborhoods and constructing sparse connectivity. The resulting layer-wise flow from marginal features toward centric features is a modeling direction for signal aggregation, not a claim that each biological interaction has that causal orientation. Accordingly, learned edge functions should be interpreted as predictive functional associations under the chosen propagation direction. If prior biology indicates that the true regulatory direction is opposite, the fitted function should be read as an opposite-orientation association, and its sign or slope should be interpreted cautiously. When directional interpretation is central, users should choose centric features and pathway neighborhoods so that the model orientation is aligned with the hypothesized biological process. For subnetwork selection, however, our pruning relies on the magnitude of the learned interaction strength; weakly contributing features are expected to remain weak regardless of the chosen orientation, making pathway selection less sensitive to direction than causal interpretation.
Within V, we first select γ2 centric features, denoted , chosen for their potential biological relevance to the prediction task. This selection is intended to be question-driven rather than tied to a single universal feature-selection algorithm. A good centric feature is one that can serve as a biologically meaningful anchor for downstream pathway exploration. In practice, users should prioritize features supported by external biological or clinical evidence, such as wet-laboratory findings, prior mechanistic knowledge, curated databases, or literature, and may combine this evidence with data-driven signals such as differential abundance/expression, association with the outcome, or model-agnostic feature importance. Candidate centric features should also be reliably measured, mappable to the reference pathway graph, connected to a plausible neighborhood of marginal features, and interpretable with respect to the scientific question. AI tools, when used, are therefore knowledge-gathering aids for annotation and literature prioritization rather than automatic decision makers; the final selection remains investigator defined and evidence based. When the biological anchors are uncertain, users should evaluate alternative centric-feature choices as a robustness check, because poor anchors can reduce predictive stability and weaken downstream pathway interpretation. The remaining features are considered marginal features that may influence the centric features through pathway connections. To organize the network layers, we introduce the hyperparameter γ1, representing the maximum number of hops along G over which a marginal feature can transmit information to a centric feature. The maximum graph depth γ1 controls the breadth of the pathway neighborhood included around the selected centric features. In practice, we recommend selecting γ1 by jointly considering validation performance, biological interpretability of the included neighborhood, and computational budget. Small depths preserve local interpretability and reduce model size, whereas larger depths may capture more indirect pathway context but can introduce weakly relevant nodes and substantially increase the number of trainable edge functions. Conversely, if a biologically relevant signal is expected to enter through multihop pathway routes, an overly shallow depth can miss the informative neighborhood. Therefore, larger depth is not automatically preferable; users should compare a small set of candidate depths and select the smallest depth that provides stable validation performance and a biologically coherent neighborhood.
For each noncentric feature , we compute its shortest-path distance to the nearest centric feature in V0, denoted as
The network then consists of γ1 layers. In layer j, features in Vj transmit updated signals to their immediate upstream neighbors in Vj−1, progressively aggregating peripheral information toward the centric features in V0. After this stepwise aggregation, the updated centric feature representations are passed to a fully connected MLP with softmax activation to produce the final prediction.
Biology-inspired residual connections with learnable functional approximation
Residual, or shortcut, connections have been shown to preserve information flow and improve optimization stability by mitigating gradient vanishing in deep neural networks (He et al. 2016). To emulate analogous information gain and signal propagation mechanisms in biological systems, we model the influence of one molecular feature vi on another vj as
Inspired by the universal approximation theorem (Hornik 1991), we parameterize f as
To express this transmission process compactly, let Vi and Vj be the sets of features in two consecutive layers, li and lj, respectively, as defined by the layer-partitioning procedure in Supplemental Algorithm S1. Define the adjacency matrix between these layers as by
This operation ensures that each feature in Vi interacts independently with each reaction pathway to Vj. The full transformation is then
The current framework relies on several assumptions. First, the pathway graph is treated as a topological prior that constrains candidate molecular interactions, rather than as a complete causal representation of the biological system. Second, the centric features are assumed to be biologically meaningful anchors for the scientific question and should be selected using external biological evidence, measurement reliability, and data-driven support. Third, the edge-specific functional approximators are used to model predictive functional associations between connected molecular features; retained functions should therefore be interpreted as pathway-constrained associations rather than direct proof of causal biochemical regulation. Consequently, if the supplied graph or centric features are factually incorrect, the selected hierarchy or subnetwork can be biologically misleading even when prediction is possible. We recommend stress-testing alternative centric features, graph neighborhoods, and graph-depth choices when prior knowledge is uncertain, and interpreting predictive robustness separately from edge-level biological validity.
Training proceeds by mapping measured features to the prior graph, selecting centric features, extracting a depth-limited neighborhood, assigning nodes to layers according to shortest-path distance from the centric features, and constructing sparse layer-wise connections from marginal features toward centric features. The edge-specific functional approximators and the final prediction layer are optimized jointly by backpropagation. In the real-data analyses and benchmark reruns, PathNet was trained with Adam, batch size 16, learning rate 10−3, dropout 0.1, and fixed epoch counts following the example notebooks. The most important user-facing tuning parameters are the centric features, the maximum graph depth, the pruning threshold for subnetwork selection, and standard neural-network training hyperparameters.
Subnetwork selection and functional analysis
Extensive studies have explored knowledge distillation and subnetwork selection in deep neural networks (Guo et al. 2016; Hu et al. 2016; Molchanov et al. 2017). A simple yet effective strategy is to prune all weights whose absolute values fall below a threshold (Han et al. 2015), which can preserve predictive performance while enhancing interpretability. In our framework, we apply a similar pruning principle to identify informative subnetworks within the overall pathway.
Specifically, in the functional approximation defined in Equation 3, the parameters w1 and w2 jointly describe the interaction strength between features vi and vj. For subnetwork selection, we retain an edge only when both |w1| and |w2| exceed the pruning threshold; edges failing this joint criterion are removed. In such cases, the learned signal transmission through that edge is weak, and the source feature vi can be regarded as uninformative for the retained subnetwork (Fig. 1C).
Previous work on graph-structured machine learning has used connection weights to quantify the importance of features (Olden and Jackson 2002; Kong and Yu 2018; Tian and Yu 2023). In many domains, such as computer vision, interpreting the meaning of a connection between two neurons can be difficult (Yosinski et al. 2015; Bau et al. 2017). In contrast, a key advantage of our approach is that each edge corresponds to a documented molecular reaction from a knowledge graph or curated database. The functional estimator in Equation 3 therefore provides both an approximation of the underlying biological interaction and a natural mechanism for regularization to avoid overfitting.
After pruning edges with low absolute weights, the remaining connections can be visualized as learned functional associations between molecular features. The functional curves are shown on the original feature scales rather than after global feature normalization. Therefore, curve steepness should be interpreted as the learned per-unit association under the displayed source and target feature units not as an unexplained residual or a normalized effect size. The qualitative trend of each function is the primary interpretation; when trends are comparable, slope magnitude provides only a preliminary indication of relative association strength and should be read together with the feature scales and the chosen approximation form. For completeness of pathway interpretation, features not analyzed directly can be reintroduced into the selected subnetwork as context nodes, ensuring biological coherence.
The public input data sets used in the two applications were obtained from established public repositories. The TCGA-BRCA miRNA-seq and RNA-seq profiles were obtained from the NIH/NCI Genomic Data Commons data portal (https://portal.gdc.cancer.gov), and the COVID-19 LC–MS metabolomic data were obtained from Metabolomics Workbench study ST001849 (https://www.metabolomicsworkbench.org//data/DRCCMetadata.php?Mode=Study&StudyID=ST001849). The pathway and interaction annotations were derived from public or previously published resources as described above, including KEGG, HINT, and multiMiR. This study analyzed only publicly available, deidentified data from TCGA/GDC and Metabolomics Workbench and did not involve the collection of new human samples or direct interaction with human participants. Therefore, no additional ethics approval or participant consent was required for this secondary computational analysis. Ethics approval and consent for the original data collection were governed by the source studies and repositories.
Code availability
The PathNet package, example workflows, built-in KEGG graph resource, and reproducible example notebooks are available at GitHub (https://github.com/YanLarryKE/PathNet) and as Supplemental Code. The package accepts feature-by-sample molecular matrices whose features can be mapped to nodes in a prior graph and is applicable to bulk transcriptomic, miRNA–gene regulatory, metabolomic, proteomic, or other omic data with suitable annotations. In addition to the built-in KEGG-based metabolite graph used in this study, users may provide custom pathway annotations as GraphML-compatible files, including .graphml and the package's .graphhml extension, existing igraph objects, or simple edge-list files in which each row specifies the source and target node of one interaction. No new raw experimental omic data were generated in this study. Generated benchmark, stress-test, depth-sensitivity, and simulation summaries from the revision are provided in the Supplemental Material and linked with the public repository for reproducibility. The corresponding supplemental numerical summaries are provided in Supplemental Tables S2 through S7.
Competing interest statement
The authors declare no competing interests.
Acknowledgments
This work was partially supported by the National Key Research and Development Program of China (2022ZD0116004), Guangdong Talent Program (2021CX02Y145), Guangdong Provincial Key Laboratory of Big Data Computing, and Shenzhen Science and Technology Program ZDSYS20230626091302006 and JCYJ20240813113536047.
Author contributions: Y.K. and T.Y. designed the study. Y.K. wrote the code used for modeling. Y.K. and T.Y. evaluated the analysis results and wrote/revised the manuscript. Y.K. prepared all figures. Both authors read and approved the final manuscript.
Footnotes
[1] Supplementary material [Supplemental material is available for this article.]
[2] Article published online before print. Article, supplemental material, and publication date are at https://www.genome.org/cgi/doi/10.1101/gr.281686.125.
[3] Freely available online through the Genome Research Open Access option.
References
- ↵Ahmadi M, Bekeschus S, Weltmann KD, von Woedtke T, Wende K. 2022. Non-steroidal anti-inflammatory drugs: recent advances in the use of synthetic COX-2 inhibitors. RSC Med Chem 13: 471–496. 10.1039/D1MD00280E
- ↵Aigner L, Pietrantonio F, Bessa de Sousa DM, Michael J, Schuster D, Reitsamer HA, Zerbe H, Studnicka M. 2020. The leukotriene receptor antagonist montelukast as a potential COVID-19 therapeutic. Front Mol Biosci 7: 610132. 10.3389/fmolb.2020.610132
- ↵Andre F, Hatzis C, Anderson K, Sotiriou C, Mazouni C, Mejia J, Wang B, Hortobagyi GN, Symmans WF, Pusztai L. 2007. Microtubule-associated protein-tau is a bifunctional predictor of endocrine sensitivity and chemotherapy resistance in estrogen receptor-positive breast cancer. Clin Cancer Res 13: 2061–2067. 10.1158/1078-0432.CCR-06-2078
- ↵Angermueller C, Pärnamaa T, Parts L, Stegle O. 2016. Deep learning for computational biology. Mol Syst Biol 12: 878. 10.15252/msb.20156651
- ↵Archambault AS, Zaid Y, Rakotoarivelo V, Turcotte C, Doré É, Dubuc I, Martin C, Flamand O, Amar Y, Cheikh A, 2021. High levels of eicosanoids and docosanoids in the lungs of intubated COVID-19 patients. FASEB J 35: e21666. 10.1096/fj.202100540R
- ↵Barabási AL, Oltvai ZN. 2004. Network biology: understanding the cell's functional organization. Nat Rev Genet 5: 101–113. 10.1038/nrg1272
- ↵Bartel DP. 2004. MicroRNAs: genomics, biogenesis, mechanism, and function. Cell 116: 281–297. 10.1016/S0092-8674(04)00045-5
- ↵Bau D, Zhou B, Khosla A, Oliva A, Torralba A. 2017. Network dissection: quantifying interpretability of deep visual representations. In 2017 IEEE Conference on Computer Vision and Pattern Recognition (CVPR), Honolulu, HI, pp. 6541–6549. IEEE, Piscataway, NJ.
- ↵Bayly-Jones C, Lupton CJ, Fritz C, Venugopal H, Ramsbeck D, Wermann M, Jäger C, de Marco A, Schilling S, Schlenzig D, 2022. Helical ultrastructure of the metalloprotease meprin α in complex with a small molecule inhibitor. Nat Commun 13: 6178. 10.1038/s41467-022-33893-7
- ↵Broadhurst D, Goodacre R, Reinke SN, Kuligowski J, Wilson ID, Lewis MR, Dunn WB. 2018. Guidelines and considerations for the use of system suitability and quality control samples in mass spectrometry assays applied in untargeted clinical metabolomic studies. Metabolomics 14: 72. 10.1007/s11306-018-1367-3
- ↵Brown TB, Mann B, Ryder N, Subbiah M, Kaplan J, Dhariwal P, Neelakantan A, Shyam P, Sastry G, Askell A, 2020. Language models are few-shot learners. In 34th Conference on Neural Information Processing Systems (NeurIPS 2020) (ed. Larochelle H, ), virtual conference, pp. 1877–1901. Curran Associates, Red Hook, NY.
- ↵Chen L, Deng H, Cui H, Fang J, Zuo Z, Deng J, Li Y, Wang X, Zhao L. 2018. Inflammatory responses and inflammation-associated diseases in organs. Oncotarget 9: 7204–7218. 10.18632/oncotarget.23208
- ↵Chen JS, Alfajaro MM, Chow RD, Wei J, Filler RB, Eisenbarth SC, Wilen CB. 2021. Nonsteroidal anti-inflammatory drugs dampen the cytokine and antibody response to SARS-CoV-2 infection. J Virol 95: e00014-21. 10.1128/JVI.00014-21
- ↵Cheng Y, Bi X, Xu Y, Liu Y, Li J, Du G, Lv X, Liu L. 2023. Machine learning for metabolic pathway optimization: a review. Comput Struct Biotechnol J 21: 2381–2393. 10.1016/j.csbj.2023.03.045
- ↵Codo AC, Davanzo GG, de Brito Monteiro L, de Souza GF, Muraro SP, Virgilio-da-Silva JV, Prodonoff JS, Carregari VC, de Biagi Junior CAO, Crunfli F, 2020. Elevated glucose levels favor SARS-CoV-2 infection and monocyte response through a HIF-1α/glycolysis-dependent axis. Cell Metab 32: 437–446.e5. 10.1016/j.cmet.2020.07.007
- ↵Dalman MR, Deeter A, Nimishakavi G, Duan ZH. 2012. Fold change and P-value cutoffs significantly alter microarray interpretations. BMC Bioinformatics 13: S11. 10.1186/1471-2105-13-S2-S11
- ↵Das J, Yu H. 2012. HINT: high-quality protein interactomes and their applications in understanding human disease. BMC Syst Biol 6: 92. 10.1186/1752-0509-6-92
- ↵Denecke B, Gräber S, Schäfer C, Heiss A, Wöltje M, Jahnen-Dechent W. 2003. Tissue distribution and activity testing suggest a similar but not identical function of fetuin-B and fetuin-A. Biochem J 376: 135–145. 10.1042/bj20030676
- ↵Dhamad AE, Zhou Z, Zhou J, Du Y. 2016. Systematic proteomic identification of the heat shock proteins (Hsp) that interact with estrogen receptor alpha (ERα) and biochemical characterization of the ERα-Hsp70 interaction. PLoS One 11: e0160312. 10.1371/journal.pone.0160312
- ↵Dunn WB, Broadhurst D, Begley P, Zelena E, Francis-McIntyre S, Anderson N, Brown M, Knowles JD, Halsall A, Haselden JN, 2011. Procedures for large-scale metabolic profiling of serum and plasma using gas chromatography and liquid chromatography coupled to mass spectrometry. Nat Protoc 6: 1060–1083. 10.1038/nprot.2011.335
- ↵Durante W. 2022. Targeting arginine in COVID-19-induced immunopathology and vasculopathy. Metabolites 12: 240. 10.3390/metabo12030240
- ↵Elmarakeby HA, Hwang J, Arafeh R, Crowdis J, Gang S, Liu D, AlDubayan SH, Salari K, Kregel S, Richter C, 2021. Biologically informed deep neural network for prostate cancer discovery. Nature 598: 348–352. 10.1038/s41586-021-03922-4
- ↵Fabian MR, Sonenberg N. 2012. The mechanics of miRNA-mediated gene silencing: a look under the hood of miRISC. Nat Struct Mol Biol 19: 586–593. 10.1038/nsmb.2296
- ↵Frankle J, Carbin M. 2019. The lottery ticket hypothesis: finding sparse, trainable neural networks. In 7th International Conference on Learning Representations (ICLR 2019), New Orleans, LA.
- ↵Geyer PE, Holdt LM, Teupser D, Mann M. 2017. Revisiting biomarker discovery by plasma proteomics. Mol Syst Biol 13: 942. 10.15252/msb.20156297
- ↵Golub TR, Slonim DK, Tamayo P, Huard C, Gaasenbeek M, Mesirov JP, Coller H, Loh ML, Downing JR, Caligiuri MA, 1999. Molecular classification of cancer: class discovery and class prediction by gene expression monitoring. Science 286: 531–537. 10.1126/science.286.5439.531
- ↵Guo D, Yang D, Zhang H, Song J, Wang P, Zhu Q, Xu R, Zhang R, Ma S, Bi X, 2025. DeepSeek-R1 incentivizes reasoning in LLMs through reinforcement learning. Nature 645: 633–638. 10.1038/s41586-025-09422-z
- ↵Guo Y, Yao A, Chen Y. 2016. Dynamic network surgery for efficient DNNs. In 30th Conference on Neural Information Processing Systems (NIPS 2016), Barcelona, Spain (ed. Lee D, ), pp. 1379–1387. Curran Associates, Red Hook, NY.
- ↵Gupta G. 2022. The lactate and the lactate dehydrogenase in inflammatory diseases and major risk factors in COVID-19 patients. Inflammation 45: 2091–2123. 10.1007/s10753-022-01680-7
- ↵Han S, Pool J, Tran J, Dally WJ. 2015. Learning both weights and connections for efficient neural networks. In 29th Conference on Neural Information Processing Systems (NIPS 2015), Montreal, Canada (ed. Cortes C, ), pp. 1135–1143. Curran Associates, Red Hook, NY.
- ↵Hartman E, Scott AM, Karlsson C, Mohanty T, Vaara ST, Linder A, Malmström L, Malmström J. 2023. Interpreting biologically informed neural networks for enhanced proteomic biomarker discovery and pathway analysis. Nat Commun 14: 5359. 10.1038/s41467-023-41146-4
- ↵He K, Zhang X, Ren S, Sun J. 2016. Deep residual learning for image recognition. In 2016 IEEE Conference on Computer Vision and Pattern Recognition (CVPR), Las Vegas, NV, pp. 770–778. IEEE, Piscataway, NJ.
- ↵Hornik K. 1991. Approximation capabilities of multilayer feedforward networks. Neural Netw 4: 251–257. 10.1016/0893-6080(91)90009-T
- ↵Hu H, Peng R, Tai YW, Tang CK. 2016. Network trimming: a data-driven neuron pruning approach towards efficient deep architectures. arXiv:1607.03250 [cs.NE]. 10.48550/arXiv.1607.03250
- ↵Hu J, Li X, Coleman K, Schroeder A, Ma N, Irwin DJ, Lee EB, Shinohara RT, Li M. 2021. SpaGCN: integrating gene expression, spatial location and histology to identify spatial domains and spatially variable genes by graph convolutional network. Nat Methods 18: 1342–1351. 10.1038/s41592-021-01255-8
- ↵Kammerer S, Sokolowski A, Hackl H, Platzer D, Jahn SW, El-Heliebi A, Schwarzenbacher D, Stiegelbauer V, Pichler M, Rezania S, 2016. KCNJ3 is a new independent prognostic marker for estrogen receptor positive breast cancer patients. Oncotarget 7: 84705–84717. 10.18632/oncotarget.13224
- ↵Kanehisa M, Goto S. 2000. KEGG: Kyoto Encyclopedia of Genes and Genomes. Nucleic Acids Res 28: 27–30. 10.1093/nar/28.1.27
- ↵Karagiannis F, Peukert K, Surace L, Michla M, Nikolka F, Fox M, Weiss P, Feuerborn C, Maier P, Schulz S, 2022. Impaired ketogenesis ties metabolism to T cell dysfunction in COVID-19. Nature 609: 801–807. 10.1038/s41586-022-05128-8
- ↵Karczewski KJ, Snyder MP. 2018. Integrative omics for health and disease. Nat Rev Genet 19: 299–310. 10.1038/nrg.2018.4
- ↵Khatri P, Sirota M, Butte AJ. 2012. Ten years of pathway analysis: current approaches and outstanding challenges. PLoS Comput Biol 8: e1002375. 10.1371/journal.pcbi.1002375
- ↵Kim SW, Choi JW, Lee DS, Yun JW. 2014. Sex hormones regulate hepatic fetuin expression in male and female rats. Cell Physiol Biochem 34: 554–564. 10.1159/000363022
- ↵Kingma DP, Ba J. 2015. Adam: a method for stochastic optimization. In 3rd International Conference on Learning Representations (ICLR 2015), San Diego, CA.
- ↵Kong Y, Yu T. 2018. A graph-embedded deep feedforward network for disease outcome classification and feature selection using gene expression data. Bioinformatics 34: 3727–3737. 10.1093/bioinformatics/bty429
- ↵Kuleshov MV, Jones MR, Rouillard AD, Fernandez NF, Duan Q, Wang Z, Koplev S, Jenkins SL, Jagodnik KM, Lachmann A, 2016. Enrichr: a comprehensive gene set enrichment analysis web server 2016 update. Nucleic Acids Res 44: W90–W97. 10.1093/nar/gkw377
- ↵Lahusen T, Henke RT, Kagan BL, Wellstein A, Riegel AT. 2009. The role and regulation of the nuclear receptor co-activator AIB1 in breast cancer. Breast Cancer Res Treat 116: 225–237. 10.1007/s10549-009-0405-2
- ↵Langfelder P, Horvath S. 2008. WGCNA: an R package for weighted correlation network analysis. BMC Bioinformatics 9: 559. 10.1186/1471-2105-9-559
- ↵Leek JT, Johnson WE, Parker HS, Jaffe AE, Storey JD. 2012. The sva package for removing batch effects and other unwanted variation in high-throughput experiments. Bioinformatics 28: 882–883. 10.1093/bioinformatics/bts034
- ↵Li JV, Chien CD, Garee JP, Xu J, Wellstein A, Riegel AT. 2013. Transcriptional repression of AIB1 by FoxG1 leads to apoptosis in breast cancer cells. Mol Endocrinol 27: 1113–1127. 10.1210/me.2012-1353
- ↵Liu Z, Wang Y, Vaidya S, Ruehle F, Halverson J, Soljačić M, Hou TY, Tegmark M. 2025. KAN: Kolmogorov–Arnold networks. In 13th International Conference on Learning Representations (ICLR 2025), Singapore.
- ↵Louie MC, Zou JX, Rabinovich A, Chen HW. 2004. ACTR/AIB1 functions as an E2F1 coactivator to promote breast cancer cell proliferation and antiestrogen resistance. Mol Cell Biol 24: 5157–5171. 10.1128/MCB.24.12.5157-5171.2004
- ↵Love MI, Huber W, Anders S. 2014. Moderated estimation of fold change and dispersion for RNA-seq data with DESeq2. Genome Biol 15: 550. 10.1186/s13059-014-0550-8
- ↵Maghsoudi Z, Nguyen H, Tavakkoli A, Nguyen T. 2022. A comprehensive survey of the approaches for pathway analysis using multi-omics data integration. Brief Bioinform 23: bbac435. 10.1093/bib/bbac435
- ↵Molchanov P, Tyree S, Karras T, Aila T, Kautz J. 2017. Pruning convolutional neural networks for resource efficient inference. In 5th International Conference on Learning Representations (ICLR 2017), Toulon, France.
- ↵Nagarajan S, Rao SV, Sutton J, Cheeseman D, Dunn S, Papachristou EK, Prada JEG, Couturier DL, Kumar S, Kishore K, 2020. ARID1A influences HDAC1/BRD4 activity, intrinsic proliferative capacity and breast cancer treatment response. Nat Genet 52: 187–197. 10.1038/s41588-019-0541-5
- ↵Naragoni S, Sankella S, Harris K, Gray WG. 2009. Phytoestrogens regulate mRNA and protein levels of guanine nucleotide-binding protein, beta-1 subunit (GNB1) in MCF-7 cells. J Cell Physiol 219: 584–594. 10.1002/jcp.21699
- ↵Neckers L, Workman P. 2012. Hsp90 molecular chaperone inhibitors: are we there yet? Clin Cancer Res 18: 64–76. 10.1158/1078-0432.CCR-11-1000
- ↵Oh AS, Lahusen JT, Chien CD, Fereshteh MP, Zhang X, Dakshanamurthy S, Xu J, Kagan BL, Wellstein A, Riegel AT. 2008. Tyrosine phosphorylation of the nuclear receptor coactivator AIB1/SRC-3 is enhanced by Abl kinase and is required for its activity in cancer cells. Mol Cell Biol 28: 6580–6593. 10.1128/MCB.00118-08
- ↵Olden JD, Jackson DA. 2002. Illuminating the “black box”: a randomization approach for understanding variable contributions in artificial neural networks. Ecol Modell 154: 135–150. 10.1016/S0304-3800(02)00064-9
- ↵Paszke A, Gross S, Massa F, Lerer A, Bradbury J, Chanan G, Killeen T, Lin Z, Gimelshein N, Antiga L, 2019. PyTorch: an imperative style, high-performance deep learning library. In Advances in Neural Information Processing Systems 32, Vancouver, Canada (ed. Wallach HM, ), pp. 8024–8035. Curran Associates, Red Hook, NY.
- ↵Patti GJ, Yanes O, Siuzdak G. 2012. Metabolomics: the apogee of the omics trilogy. Nat Rev Mol Cell Biol 13: 263–269. 10.1038/nrm3314
- ↵Pietzke M, Meiser J, Vazquez A. 2020. Formate metabolism in health and disease. Mol Metab 33: 23–37. 10.1016/j.molmet.2019.05.012
- ↵Place RF, Li LC, Pookot D, Noonan EJ, Dahiya R. 2008. MicroRNA-373 induces expression of genes with complementary promoter sequences. Proc Natl Acad Sci 105: 1608–1613. 10.1073/pnas.0707594105
- ↵Prince TL, Lang BJ, Okusha Y, Eguchi T, Calderwood SK. 2023. Cdc37 as a co-chaperone to Hsp90. Subcell Biochem 101: 141–158. 10.1007/978-3-031-14740-1_5
- ↵Raiborg C, Stenmark H. 2009. The ESCRT machinery in endosomal sorting of ubiquitylated membrane proteins. Nature 458: 445–452. 10.1038/nature07961
- ↵Ricciotti E, FitzGerald GA. 2011. Prostaglandins and inflammation. Arterioscler Thromb Vasc Biol 31: 986–1000. 10.1161/ATVBAHA.110.207449
- ↵Roberts I, Wright Muelas M, Taylor JM, Davison AS, Xu Y, Grixti JM, Gotts N, Sorokin A, Goodacre R, Kell DB. 2022. Untargeted metabolomics of COVID-19 patient serum reveals potential prognostic markers of both severity and outcome. Metabolomics 18: 6. 10.1007/s11306-021-01859-3
- ↵Robinson MD, McCarthy DJ, Smyth GK. 2010. edgeR: a Bioconductor package for differential expression analysis of digital gene expression data. Bioinformatics 26: 139–140. 10.1093/bioinformatics/btp616
- ↵Rouzier R, Rajan R, Wagner P, Hess KR, Gold DL, Stec J, Ayers M, Ross JS, Zhang P, Buchholz TA, 2005. Microtubule-associated protein tau: a marker of paclitaxel sensitivity in breast cancer. Proc Natl Acad Sci 102: 8315–8320. 10.1073/pnas.0408974102
- ↵Ru Y, Kechris KJ, Tabakoff B, Hoffman P, Radcliffe RA, Bowler R, Mahaffey S, Rossi S, Calin GA, Bemis L, 2014. The multiMiR R package and database: integration of microRNA–target interactions along with their disease and drug associations. Nucleic Acids Res 42: e133. 10.1093/nar/gku631
- ↵Russo M, Russo GL, Daglia M, Kasi PD, Ravi S, Nabavi SF, Nabavi SM. 2016. Understanding genistein in cancer: the “good” and the “bad” effects: a review. Food Chem 196: 589–600. 10.1016/j.foodchem.2015.09.085
- ↵Saleh J, Peyssonnaux C, Singh K, Edeas M. 2020. Mitochondria and microbiota dysfunction in COVID-19 pathogenesis. Mitochondrion 54: 1–7. 10.1016/j.mito.2020.06.008
- ↵Shen B, Yi X, Sun Y, Bi X, Du J, Zhang C, Quan S, Zhang F, Sun R, Qian L, 2020. Proteomic and metabolomic characterization of COVID-19 patient sera. Cell 182: 59–72.e15. 10.1016/j.cell.2020.05.032
- ↵Sindelar M, Stancliffe E, Schwaiger-Haber M, Anbukumar DS, Adkins-Travis K, Goss CW, O'Halloran JA, Mudd PA, Liu WC, Albrecht RA, 2021. Longitudinal metabolomics of human plasma reveals prognostic markers of COVID-19 disease severity. Cell Rep Med 2: 100369. 10.1016/j.xcrm.2021.100369
- ↵Sørlie T, Tibshirani R, Parker J, Hastie T, Marron JS, Nobel A, Deng S, Johnsen H, Pesich R, Geisler S, 2003. Repeated observation of breast tumor subtypes in independent gene expression data sets. Proc Natl Acad Sci 100: 8418–8423. 10.1073/pnas.0932692100
- ↵Tamayo P, Steinhardt G, Liberzon A, Mesirov JP. 2016. The limitations of simple gene set enrichment analysis assuming gene independence. Stat Methods Med Res 25: 472–487. 10.1177/0962280212460441
- ↵The Cancer Genome Atlas Network. 2012. Comprehensive molecular portraits of human breast tumours. Nature 490: 61–70. 10.1038/nature11412
- ↵Thomas T, Stefanoni D, Reisz JA, Nemkov T, Bertolone L, Francis RO, Hudson KE, Zimring JC, Hansen KC, Hod EA, 2020. COVID-19 infection alters kynurenine and fatty acid metabolism, correlating with IL-6 levels and renal status. JCI Insight 5: e140327. 10.1172/jci.insight.140327
- ↵Tian L, Yu T. 2023. An integrated deep learning framework for the interpretation of untargeted metabolomics data. Brief Bioinform 24: bbad244. 10.1093/bib/bbad244
- ↵Trepel J, Mollapour M, Giaccone G, Neckers L. 2010. Targeting the dynamic HSP90 complex in cancer. Nat Rev Cancer 10: 537–549. 10.1038/nrc2887
- ↵Want EJ, Wilson ID, Gika H, Theodoridis G, Plumb RS, Shockcor J, Holmes E, Nicholson JK. 2010. Global metabolic profiling procedures for urine using UPLC–MS. Nat Protoc 5: 1005–1018. 10.1038/nprot.2010.50
- ↵Wu D, Shu T, Yang X, Song JX, Zhang M, Yao C, Liu W, Huang M, Yu Y, Yang Q, 2020. Plasma metabolomic and lipidomic alterations associated with COVID-19. Natl Sci Rev 7: 1157–1168. 10.1093/nsr/nwaa086
- ↵Xu W, Neckers L. 2012. The double edge of the HSP90-CDC37 chaperone machinery: opposing determinants of kinase stability and activity. Future Oncol 8: 939–942. 10.2217/fon.12.80
- ↵Yosinski J, Clune J, Nguyen A, Fuchs T, Lipson H. 2015. Understanding neural networks through deep visualization. arXiv:1506.06579 [cs.CV]. 10.48550/arXiv.1506.06579
- ↵Youm YH, Nguyen KY, Grant RW, Goldberg EL, Bodogai M, Kim D, D'agostino D, Planavsky N, Lupfer C, Kanneganti TD, 2015. The ketone metabolite β-hydroxybutyrate blocks NLRP3 inflammasome–mediated inflammatory disease. Nat Med 21: 263–269. 10.1038/nm.3804
- ↵Yu T, Park Y, Johnson JM, Jones DP. 2009. apLCMS—adaptive processing of high-resolution LC/MS data. Bioinformatics 25: 1930–1936. 10.1093/bioinformatics/btp291
- ↵Zhan K, Liu R, Tong H, Gao S, Yang G, Hossain A, Li T, He W. 2020. Fetuin B overexpression suppresses proliferation, migration, and invasion in prostate cancer by inhibiting the PI3K/AKT signaling pathway. Biomed Pharmacother 131: 110689. 10.1016/j.biopha.2020.110689
- ↵Zhang Y, Guo R, Kim SH, Shah H, Zhang S, Liang JH, Fang Y, Gentili M, Leary CNO, Elledge SJ, 2021. SARS-CoV-2 hijacks folate and one-carbon metabolism for viral replication. Nat Commun 12: 1676. 10.1038/s41467-021-21903-z