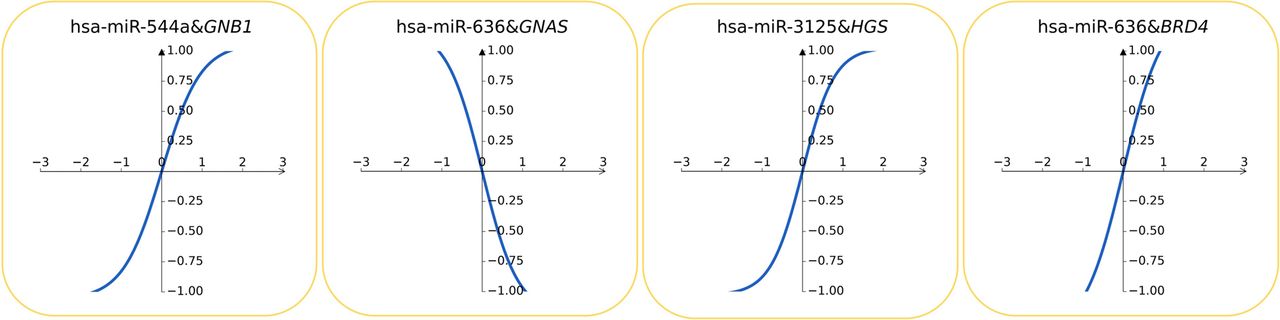
Figure 3.
Selected miRNA–gene regulatory reaction sketches. The title of each plot identifies the miRNA and its target gene. The functional curves retain the original feature scales; steeper curves indicate larger learned per-unit associations on those scales, not larger unexplained residuals.