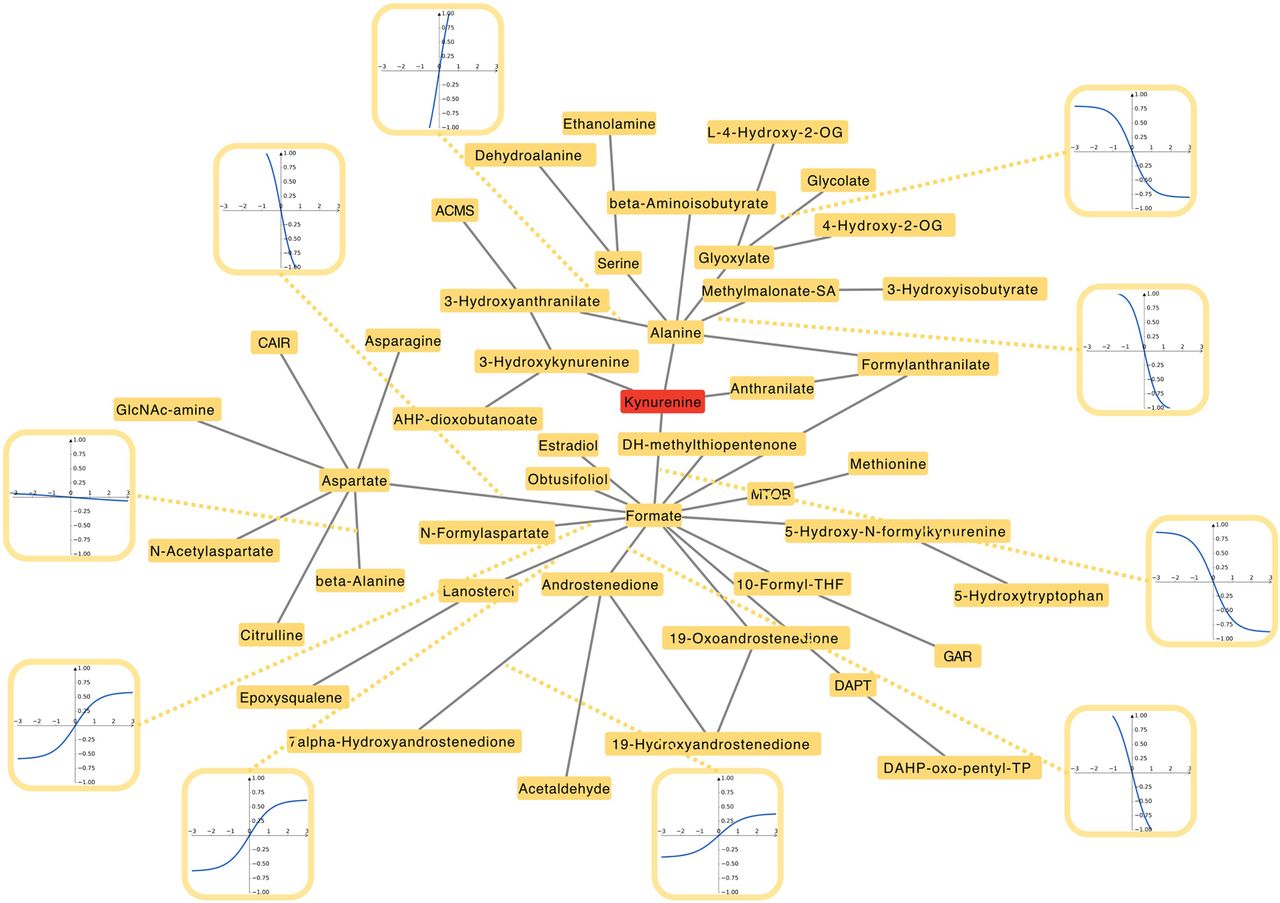
Figure 4.
Representative retained COVID-19 metabolomic subnetwork centered on the tryptophan/kynurenine and one-carbon/amino acid neighborhood. Each node represents a metabolite, and each edge denotes a retained KEGG-constrained model connection after pruning. Node labels are shown as metabolite names rather than KEGG identifiers. To preserve readability, only a subset of representative edge-specific functional curves are displayed with consistent panel dimensions. The functional curves retain the original feature scales; steeper curves indicate larger learned per-unit associations on those scales, not larger unexplained residuals. An edge without a curve inset is still retained, whereas pruned edges are not drawn in the subnetwork.