Abstract
Understanding how genomic divergence drives biodiversity remains a central question in evolutionary biology. The nematodes Caenorhabditis briggsae and its sister species Caenorhabditis nigoni provide an ideal model system to address this question, as they exhibit extensive genomic divergence with limited gene flow from C. briggsae to C. nigoni. Despite previous comparative genomic studies, a comprehensive analysis of both conspecific and interspecific variations, and their potential impact on hybrid incompatibility, remains lacking. Here, we present a pangenome study of populations from both species, revealing that C. nigoni consistently possesses larger genomes and higher gene counts than C. briggsae. This difference primarily results from markedly larger interspecific unaligned regions in C. nigoni, which overlap significantly with C. nigoni intraspecific unaligned segments that are also substantially larger than those in C. briggsae. Moreover, the increased gene number in C. nigoni is largely owing to the expansion of species-specific dispensable gene families. Notably, both the inter- and intraspecific unaligned regions and the expanded dispensable genes in C. nigoni show a significant enrichment in rapidly evolving genes encoding Cullin-E3 ubiquitin-ligase adaptors, particularly F-box proteins, which are speculated to mediate immune and stress responses in nematodes. A detailed examination of a recently evolved F-box gene family (fbxn family), which includes a speciation gene Cni-neib-1, demonstrates extensive polymorphism among populations, which may contribute to hybrid incompatibility. Collectively, our findings underscore the significance of fast-evolving ubiquitination and protein degradation pathways in driving genomic divergence, and suggest a potential link between incompatible immunity and speciation.
Genomes undergo continuous variations, thereby enabling organisms to adapt to dynamic shifts in both extrinsic and intrinsic environments throughout evolution (Taylor and Larson 2019). Species must strike a delicate balance between preserving genetic stability and generating sufficient variability to both maintain species identity and respond to environmental changes. This equilibrium in genome evolution underpins the unique genetic identity of each species, such that mixing genomes from different species or even populations can lead to catastrophic consequences, frequently manifesting as compromised fitness exemplified by hybrid incompatibility (HI) (Coyne and Orr 2004; Moran et al. 2021). Yet, how species achieve this balance, specifically, how adaptive genome evolution and divergence precipitate HI and ultimately establish reproductive barriers, remains largely unknown. Despite decades of research into the genetic basis of speciation, only a very limited number of genes responsible for HI have been cloned (Maheshwari and Barbash 2011). Concurrently, comparative genomic analyses have become increasingly imperative for inferring HI mechanisms (Moran et al. 2021; Mohan et al. 2024). On one hand, HIs are predominantly polygenic (Nosil et al. 2021), requiring whole-genome approaches to unravel subtle, interconnected effects that traditional genetic studies may overlook. On the other hand, analyses of genomic variation frequently reveal a complex interplay among sequence changes, including single-nucleotide polymorphisms (SNPs) and structural variations (SVs), which are associated with altered gene expression and phenotypic traits (Collins et al. 2020; Jiao et al. 2025). These interactions often fuel hybrid genomic conflicts. Short-read sequencing technologies have struggled to resolve such complexities owing to inherent limitations in genome assembly. In contrast, the advent of long-read sequencing technologies, such as of Pacific Biosciences (PacBio) and Oxford Nanopore Technologies (ONT), has markedly enhanced both the efficiency and accuracy of genomic studies (Sedlazeck et al. 2018). These technological advances have also propelled pangenome analyses. Initially developed for bacterial studies (Sherman and Salzberg 2020), the pangenome approach has now gained prominence across diverse species (Sirén et al. 2021; Liao et al. 2023). By analyzing gene repertoires across populations within a species, pangenome studies capture the full spectrum of genetic diversity, often emphasizing unique haplotypes and sequence variations (Todesco et al. 2020; Sirén et al. 2021; Bredemeyer et al. 2023). This approach is particularly valuable for speciation research, as it can screen for critical elements that drive the transition from genetically partially isolated populations to completely separated species (Cutter 2023), thereby unveiling key contributors to speciation that might be overlooked in traditional pairwise comparative analyses relying on a single reference genome per population or species.
The nematode species pair Caenorhabditis briggsae and Caenorhabditis nigoni has emerged as a powerful model for dissecting the genetic and genomic bases of speciation. Although both species are closely related to the model organism Caenorhabditis elegans (Li et al. 2016; Ren et al. 2018), the androdioecious C. briggsae possesses a markedly smaller genome (∼106 Mb) compared with the dioecious C. nigoni (∼129 Mb). Despite these differences, the two species are able to interbreed and produce partially viable hybrids (Woodruff et al. 2010; Kozlowska et al. 2012). Notably, gene flow is unidirectional under laboratory conditions, occurring from C. briggsae to C. nigoni: backcrossing F1 female hybrids to C. briggsae leads to complete embryonic lethality, whereas backcrossing to C. nigoni yields viable progeny of both sexes (Woodruff et al. 2010; Xie et al. 2022, 2024). This parallel asymmetry in genome sizes and gene flow suggests that unique genomic components in C. nigoni underlie the numerous HI phenotypes observed between these species (Bi et al. 2015, 2019; Xie et al. 2024). Transcriptomic analyses have indeed uncovered key C. nigoni–specific elements associated with these HI phenotypes (Li et al. 2016; Ren et al. 2018; Sánchez-Ramírez et al. 2021; Xie et al. 2022). More importantly, we recently cloned a speciation gene pair, comprising a newly evolved C. nigoni–specific F-box gene Cni-neib-1, that specifically disrupts an essential phosphoglucomutase (PGM) from C. briggsae, leading to hybrid embryonic lethality (Xie et al. 2024). These findings underscore the disproportionate role of C. nigoni genomic elements in establishing reproductive barriers. Given that Cni-neib-1 has undergone rapid birth-and-death evolution among C. nigoni wild isolates, it is plausible that many additional C. nigoni–specific elements have experienced similar dynamics and contributed to HI between the two species. Nevertheless, the identities of these factors and how they contribute to the genetic and genome divergences between the populations of the two nematodes, driving their incompatibilities, remain elusive.
Here we performed a comparative pangenome analysis across populations of C. briggsae and C. nigoni to elucidate the genomic divergences underlying their speciation. We generated high-quality genome assemblies and annotations for seven C. briggsae strains and nine C. nigoni strains, including both reference strains. Through comparative pan-genomic analyses of both nematode species, we aim to identify the critical structural and genetic variations that drive intra- and interspecific genome evolution, ultimately leading to speciation.
Results
C. nigoni strains consistently carry larger genomes with higher gene counts compared with C. briggsae strains
Previous studies, including our own, have shown that C. nigoni possesses a considerably larger genome and a higher gene count than C. briggsae (Yin et al. 2018; Xie et al. 2024). Specifically, the C. nigoni reference strain JU1421 exhibits approximately a 22% increase in genome size and a 35% higher gene number compared with the C. briggsae reference strain AF16 (Fig. 1; Xie et al. 2024). This disparity is consistent with the observed unidirectional gene flow from C. briggsae to C. nigoni but not vice versa (Woodruff et al. 2010; Kozlowska et al. 2012; Xie et al. 2022, 2024). To investigate the mechanisms underlying this unidirectional gene flow and its association with asymmetric genome sizes and gene numbers, we conducted a pangenome analysis of geographically diverse populations of both species. Specifically, we selected eight C. nigoni and six C. briggsae wild isolates for genome assembly and annotation (Supplemental Fig. S1). For C. nigoni, we performed genome assembly using a combination of ONT long-read sequencing and Illumina high-throughput sequencing for eight newly collected wild isolates (Xie et al. 2024). For C. briggsae, we utilized previously published genome data, refining the long-read assembled scaffolds (Widen et al. 2023) into chromosomal-level assemblies or directly leveraging chromosomal-level scaffolds (for strain details, see Methods) (Stevens et al. 2022). Through primary assembly, read correction, polishing, and reference-based scaffolding using high-quality chromosomal-level genomes of JU1421 (C. nigoni) or AF16 (C. briggsae; see Methods) (Xie et al. 2023), we generated chromosomal-level genomes with scaffold N50 values ranging from 17.08 Mb to 17.30 Mb for C. briggsae isolates and from 19.17 Mb to 21.01 Mb for C. nigoni isolates (Supplemental Table S1). These values are comparable to those of the high-quality reference genomes that we de novo assembled (Supplemental Table S1; Xie et al. 2023). The quality of the assembled genomes was further validated using Benchmarking Universal Single-Copy Orthologs (BUSCO) scores, which ranged from 96.5% to 96.9% for C. briggsae isolates and from 98.3% to 99.2% for C. nigoni ones, suggesting that the quality is on par with that of the reference genomes (Supplemental Table S1). To ensure consistency and minimize potential biases in gene family comparisons, we applied a uniform gene prediction pipeline across all wild isolates, mirroring the approach used for the reference strains (see Methods). This standardized pipeline enabled the prediction of protein-coding genes without masking species-specific expanded gene families. Using this approach, we estimate gene numbers ranging from 28,076 to 30,675 for C. nigoni and from 22,830 to 23,282 for C. briggsae isolates (Fig. 1A,B; Supplemental Table S1).
Comparative genome analysis reveals larger genome sizes and higher gene numbers in C. nigoni strains relative to C. briggsae strains. (Left) Phylogenetic relationships of eight C. nigoni and six C. briggsae wild isolates, along with their corresponding reference strains, namely, JU1421 and AF16 (highlighted in bold), respectively. The phylogenetic tree was constructed using concatenated protein sequences of orthologous genes based on the maximum likelihood method. (Right) Comparative genomic features between interspecific and intraspecific strains, including genome sizes (A), gene numbers (B), repeat content as a percentage of the genome (C), proportions of repeat types among total repeats (D), gene length distributions (E), and coding DNA sequence (CDS) length distributions (F). (Retro TE) Retrotransposon, (RC TE) rolling circle transposon.
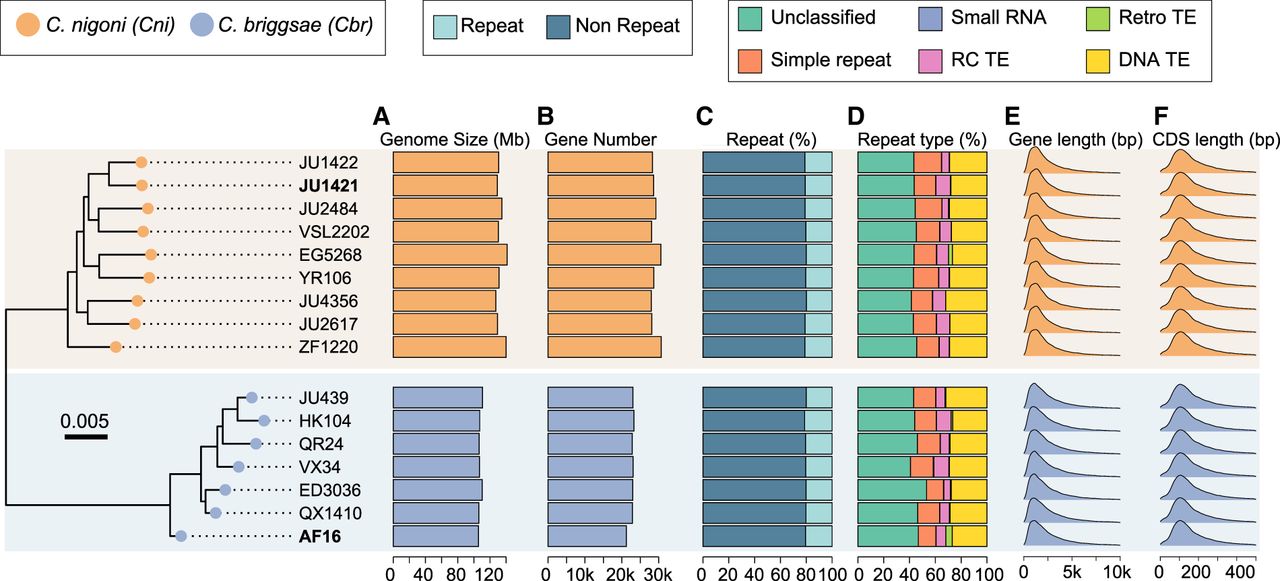
We subsequently examined both inter- and intraspecific variations in genome sizes and protein-coding gene numbers. C. nigoni wild isolates consistently exhibited genome sizes ∼20%–33% larger than those of C. briggsae reference strain AF16, whereas the genome sizes of all C. briggsae wild isolates were comparable to to those of AF16 (∼106 Mb) (Fig. 1A; Supplemental Table S1). Similarly, C. nigoni wild isolates invariably displayed higher gene numbers compared with C. briggsae strains (Fig. 1B; Supplemental Table S1). We observed substantially greater variation in both genome sizes and gene numbers among C. nigoni strains compared with C. briggsae strains. For instance, the coefficient of variation (CV) for genome size and gene number in C. nigoni strains is 0.0373 and 0.0360, respectively, with corresponding mean values of 132.60 Mb and 28,916. In contrast, C. briggsae exhibits lower CVs of 0.0058 for genome size and 0.0304 for gene number, with mean values of 106.46 Mb and 22,739, respectively. Moreover, the correlation between genome size and gene number is markedly stronger in C. nigoni than in C. briggsae (Fig. 1A,B; Supplemental Fig. S2). These findings suggest a higher degree of sequence and gene number divergence in the obligate outcrossing C. nigoni compared with the self-fertilizing C. briggsae, consistent with previous findings (Yin et al. 2018; Teterina et al. 2023). Notably, species-specific expansions of repetitive sequences do not explain the larger genome sizes in C. nigoni, nor do they account for intraspecies variations, because both species exhibited similar proportions of total and individual repeat types (Fig. 1C,D; Supplemental Table S2). Similarly, the lengths of genes and coding DNA sequences (CDSs) were indistinguishable among strains of the two species (Fig. 1E,F; Supplemental Table S2). Taken together, these results demonstrate consistently larger genome sizes and higher gene numbers in C. nigoni populations compared with those of C. briggsae, with greater variations observed in C. nigoni.
Genome size variation between C. nigoni and C. briggsae is primarily driven by differences in unalignable regions
We next investigated the sequence divergences underpinning the larger genome sizes of C. nigoni strains relative to C. briggsae strains. To this end, we leveraged the genomic variation detection tool SyRI (Goel et al. 2019), which systematically identifies and categorizes both large-scale SVs and small-scale sequence variations based on pairwise genome alignments. Genomic regions that cannot be properly aligned in a one-to-one correspondence within the existing high-quality genome (excluding cases in which absence of alignments arise from incomplete assembly) are classified as unaligned regions, whereas those that align are further categorized as syntenic or rearranged regions, serving as the basis for subsequent characterization of both large-scale SVs and small-scale variations. Large-scale SVs were classified into categories as inversion, translocation, duplication, and inverted translocation/duplication, whereas small-scale variations included SNPs, tandem duplications, copy number gains or losses, and insertions and deletions (indels) (Goel et al. 2019). Notably, although both small and large indels were characterized (see Methods), those <100 bp predominated between the two species (Supplemental Table S3). Initial comparisons between the reference strains JU1421 (C. nigoni) and AF16 (C. briggsae) revealed that small-scale sequence variations contributed negligibly to genome size differences (Supplemental Fig. S3A). Comparable small-scale sequence variations are observed when each wild isolate is compared to the reference strain of the alternate species (Supplemental Fig. S3B). Both species exhibited similar sizes of SVs, with inversions being the predominant type (Fig. 2A). Additionally, the sizes of syntenic regions, which largely encompass the intronic regions of orthologous genes, were comparable between the two species (∼62 Mb for AF16 vs. ∼65.5 Mb for JU1421). In contrast, unaligned regions, particularly those of large sizes, account for the bulk of the genome size divergence (∼30.9 Mb for AF16 vs. ∼49.6 Mb for JU1421) (Fig. 2A; Supplemental Fig. S3C), consistent with previous findings (Yin et al. 2018). Comparable proportions of syntenic and unaligned regions were also observed when each wild isolate was compared with the reference strain of the counterpart species. (Supplemental Fig. S3D).
Genome size variations between C. nigoni and C. briggsae strains are predominantly attributed to the unalignable regions. (A) Stacked bar plot showing the composition of interspecific genome structural variation (SV) types in the reference strain of C. briggsae (AF16; left) and C. nigoni (JU1421; right) by pairwise comparison of the two. The sizes of the unaligned and syntenic regions are indicated within the bars. (B) Stacked bar plot showing the composition of intraspecific genome SV types among the wild isolates of C. nigoni (left) or C. briggsae (right) by comparing each wild isolate to its corresponding reference strain. The sizes of the unaligned and syntenic regions are labeled. (C) Circos plot (Krzywinski et al. 2009) showing the genome-wide distribution of SVs between C. nigoni and C. briggsae reference strains, as described in panel A. Each variation type is color-coded the same as in panel A. (D,E) Circos plot showing the genome-wide distribution of all the SVs for the wild isolates of C. nigoni (D) and C. briggsae (E) as described in panel B. Distribution of phyloP scores across the chromosomes is also indicated. (C. nigoni a to h) EG5268, JU1422, JU2484, JU2617, JU4356, VSL2202, YR106, and ZF1220; (C. briggsae a to f) ED3036, HK104, JU439, QR24, QX1410, and VX34. (F,G) Coverage of intraspecific and interspecific unaligned regions >100 kb chromosomal intervals in C. nigoni (F) and C. briggsae (G). Cumulative coverage of intraspecific unaligned regions is also shown. Venn diagrams on the right illustrate the sizes (in megabases) of shared unaligned regions between interspecific and cumulative intraspecific divergent regions for each species.
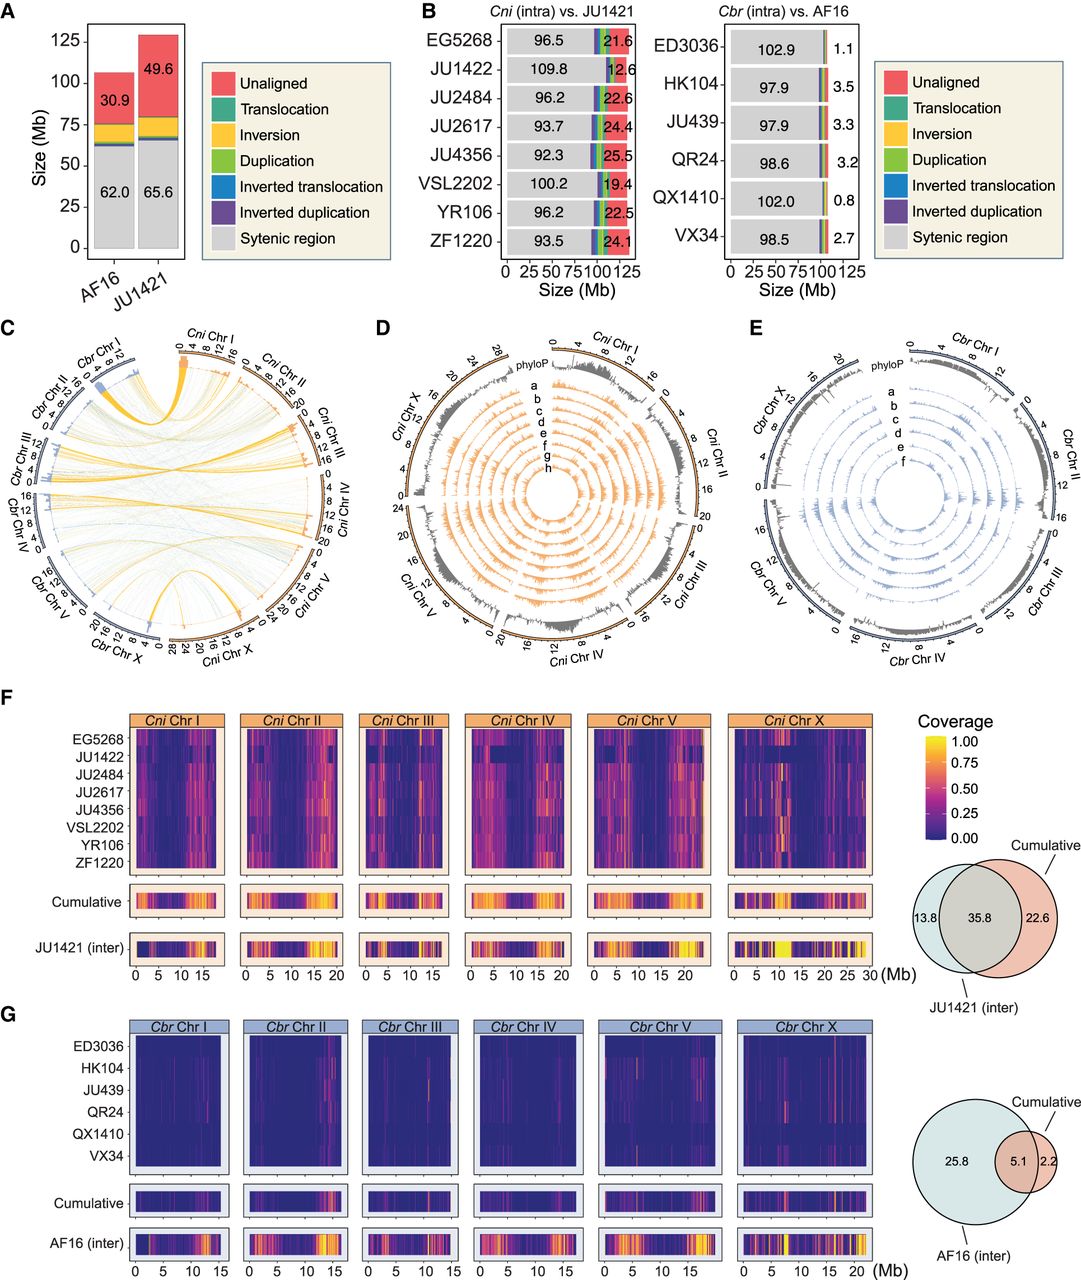
To assess to what extent the observed interspecific genome divergences correlate with intraspecific variability, we performed pairwise genome alignments between each wild isolate and its respective reference strain. We first observed a significantly higher proportion of SNPs among C. nigoni wild isolates compared with C. briggsae isolates (Supplemental Fig. S3E). This finding aligns with a previous study that reported nearly a 10-fold increase in nucleotide divergence in the obligate outcrossing Caenorhabditis remanei relative to the self-fertilizing C. elegans (Teterina et al. 2023). We then observed a striking difference in the size of intraspecific unaligned regions (Fig. 2B). C. nigoni populations exhibited substantially larger unaligned regions, ranging from ∼12.6 Mb to ∼25.5 Mb, whereas those in C. briggsae were much smaller, ranging from ∼0.8 Mb to ∼3.5 Mb (Fig. 2B). These results demonstrate that unaligned regions dominate both intra- and interspecific genome divergence.
We next examined the chromosomal distribution of inter- and intraspecific SVs and their impacts on nucleotide-level divergence. Consistent with previous findings (Ren et al. 2018; Yin et al. 2018), interspecific SVs between JU1421 (C. nigoni) and AF16 (C. briggsae) were predominantly localized to chromosomal arms, including a previously unidentified large inversion on the left arm of Chr I (Fig. 2C). This distribution pattern was also observed in wild isolates of both C. nigoni and C. briggsae, which is opposite to the pattern of nucleotide conservation along chromosomes (Fig. 2D,E). For instance, phylogenetic P-value (phyloP) conservation scores, which measure nucleotide site conservation (values > 0 indicate higher conservation, whereas values < 0 indicate higher divergence; see Methods), were consistently lower on chromosomal arms and higher in chromosomal centers (Fig. 2D,E). These results indicate that SVs are associated with both intra- and interspecific nucleotide-level divergence, although they do not play a major role in genome size differences.
To determine how intraspecific unaligned regions contribute to interspecific genome divergence, we finally analyzed the genomic distribution of both intra- and interspecific unaligned regions. Despite the highly strain-specific nature of intraspecific unaligned regions, with minimal overlap between strains (Supplemental Fig. S4), the cumulative intraspecific unaligned regions in C. nigoni were largely shared with interspecific ones. Specifically, ∼35.8 Mb (61% of the total ∼58.4 Mb) of the aggregated intraspecific unaligned regions in C. nigoni overlapped with 72% of the interspecific unaligned regions (∼35.8 Mb out of ∼49.6 Mb) (Fig. 2F). In contrast, C. briggsae contributed far less to interspecific unaligned regions, with only ∼5.1 Mb (61% of the total ∼7.3 Mb) of its aggregated intraspecific unaligned regions corresponding to 17% of the interspecific unaligned ones (∼5.1 Mb out of ∼30.9 Mb) (Fig. 2G). These findings suggest that regions with extensive intraspecific divergence among C. nigoni strains substantially contribute to the interspecific genome divergence between these two species.
Gene-based pangenome analysis reveals disproportionate expansions of dispensable gene families between C. nigoni and C. briggsae
To understand intra- and interspecific divergences at the gene family level, we classified orthologous gene families in the two species using OrthoFinder (Emms and Kelly 2019). We identified a total of 24,690 orthologous gene families in the C. nigoni strains, of which 69% (17,095) were classified as core genome (shared by all strains), leaving 7595 gene families categorized as dispensable (shared by some but not all strains) (Fig. 3A). In contrast, these numbers drop to 21,657 (pan), 16,198 (core), and 5459 (dispensable) in C. briggsae (Fig. 3A), consistent with the lower total number of genes in C. briggsae relative to C. nigoni. To assess the completeness of the current pangenomes, we modeled variations in pan-gene and core-gene family numbers using the combinations of different genome numbers (ranging from one to seven for C. briggsae and one to nine for C. nigoni) (Fig. 3A). In both species, the number of gene families approached a plateau (Fig. 3A), indicating that the current pangenomes are largely representative and that the inclusion of additional genomes is unlikely to significantly alter the sizes of the pangenome or core-genome.
Gene-based pangenome analysis reveals the distinction of species-specific dispensable gene families between C. nigoni and C. briggsae. (A) Gene-based pangenome (red) and core-genome (black) accumulation curves for all possible combinations of genomes within each species. Genome numbers range from one to nine for C. nigoni (triangles) and one to seven for C. briggsae (circles), respectively. (B) Presence (dark blue) and absence (light gray) matrix of all gene families across strains of both species. Gene families are classified into six categories: shared core (red), C. nigoni–unique core (purple), C. briggsae–unique core (yellow), dispensable (gray), C. nigoni–specific (green), and C. briggsae–specific (blue). The presence (pink) and absence (light green) of each gene family in the outgroup species are shown as bars at the top. (C) Pie chart showing the number and proportion of each type of gene family as shown in panel B. The histogram shows the counts and types of gene families shared across different numbers of genomes. (D) Proportion and counts of genes belonging to each gene family group (as shown in panel B) for each strain of C. nigoni and C. briggsae. (E) Box plot comparing the mean values of nucleotide sequence diversity (π nucleotide) of C. nigoni (left) or C. briggsae (right) genes belonging to each gene family group. Wilcoxon rank-sum tests were performed to evaluate significant differences. (F) Box plot comparing the mean values of Tajima's D for C. nigoni genes belonging to each gene family group. Wilcoxon rank-sum tests were performed to evaluate significant differences. (G,H) Gene Ontology (GO) enrichment analysis of biological processes for C. nigoni–specific dispensable genes (H) and C. briggsae–specific dispensable genes (G). The most significantly enriched category for C. nigoni–specific dispensable genes, namely, innate immune response, is highlighted in red.
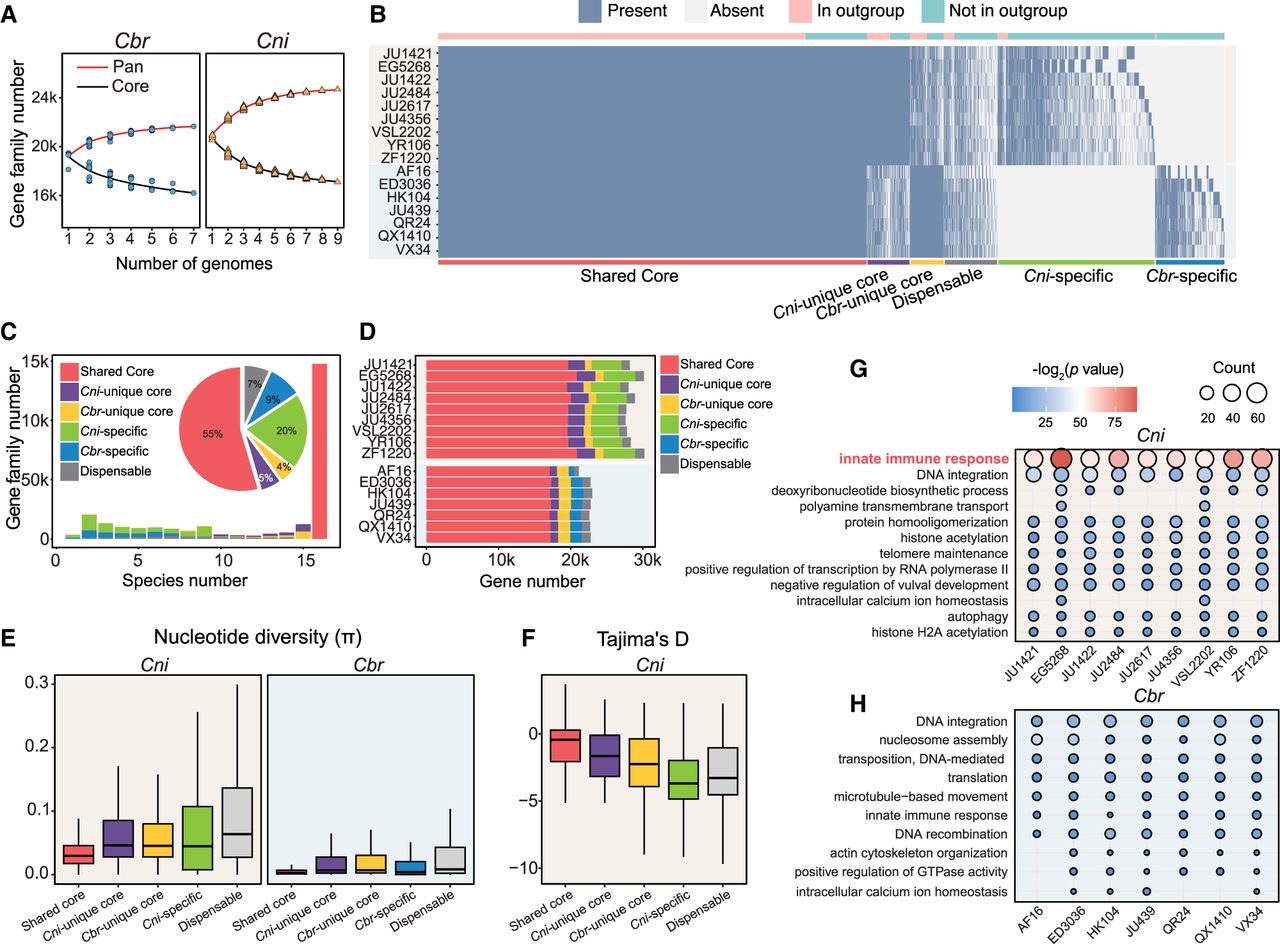
To facilitate comparison, we combined the two pangenomes and categorized each gene family based on its presence or absence across all strains into six distinct groups: Shared core gene families are present in all strains of both species, whereas species-unique core gene families exist in all strains of only one species (denoted as Cni-unique and Cbr-unique) (Fig. 3B; Supplemental Table S4). Similarly, dispensable gene families present in some strains of one species but absent in the other were classified as species-specific dispensable families (denoted as Cni-specific and Cbr-specific), whereas dispensable gene families shared across both species were categorized as commonly dispensable (denoted simply as dispensable) (Fig. 3B; Supplemental Table S4). Out of 27,083 total gene families identified across all strains, 14,773 (55%) are shared core families, whereas species-unique core families constitute only 4% and 5% (1476 in C. nigoni and 1168 in C. briggsae, respectively) (Fig. 3B,C; Supplemental Table S4). Notably, 5426 (20%) of the gene families are C. nigoni–specific dispensable families, in contrast to 2393 (9%) for C. briggsae-specific ones (Fig. 3B,C), highlighting the substantial expansion of C. nigoni–specific dispensable gene families. Consistent with this, although ∼86% (12,661 out of 14,773), 54% (801 out of 1476), and 51% (590 out of 1168) of shared core, C. nigoni–unique core, and C. briggsae–unique core gene families are also present in at least one outgroup nematode (C. elegans, C. remanei, and Caenorhabditis brenneri; see Methods), only 5% (294 out of 5426) and 2.5% (60 out of 2393) of C. nigoni–specific and C. briggsae–specific dispensable genes, respectively, are shared with these outgroups (Fig. 3B; Supplemental Table S4). This suggests that these gene families have evolved under distinct, species-specific selection pressures. Moreover, we observed lower expression levels of species-specific dispensable genes compared with core genes in mixed-stage worms of both C. nigoni and C. briggsae (Supplemental Fig. S5), suggesting potential stage-specific or cell-specific expression patterns for these dispensable genes. We then assessed the gene numbers within each gene family type. Although shared core and C. nigoni–unique core genes exhibit some copy number expansions, the number of C. nigoni–specific dispensable genes (ranging from 3698 to 4416) is significantly higher than that of C. briggsae (ranging from 796 to 1708) across strains (Fig. 3D). This disproportionate expansion of C. nigoni–specific dispensable genes largely explains the higher total gene numbers observed in C. nigoni populations.
To investigate whether different gene family groups exhibit varying levels of polymorphism, we calculated the mean nucleotide diversity (π) for genes within each family type in both C. nigoni and C. briggsae. We observed that species-specific dispensable genes exhibit significantly higher genetic variation compared with shared core genes in both nematodes (P < 0.0001, Wilcoxon rank-sum test) (Fig. 3E; Supplemental Fig. S6). Similarly, the nucleotide conservation (phyloP score) of flanking genomic regions is also reduced in species-specific genes (Supplemental Fig. S6). Notably, C. nigoni–specific dispensable genes display significantly higher nucleotide diversity relative to C. briggsae–specific ones (P < 0.0001, Wilcoxon rank-sum test), consistent with the higher extent of SNP variation observed among C. nigoni populations (Fig. 3E). To explore the selective pressures acting on species-specific dispensable genes, we further calculated Tajima's D values for different gene categories in both species. C. nigoni–specific dispensable genes exhibit significantly lower Tajima's D values compared with other gene groups (P < 0.0001, Wilcoxon rank-sum test), a trend that is not observed for C. briggsae genes (Fig. 3F; Supplemental Fig. S7). These results suggest that C. nigoni–specific dispensable genes are likely subject to strong and species-specific positive selection, driving their elevated sequence divergence compared with C. briggsae.
To investigate differences in gene types among species-specific dispensable genes, we performed Gene Ontology (GO) analysis of biological processes for all C. briggsae–specific and C. nigoni–specific dispensable gene families. The top enriched biological processes differed substantially between the two species (Fig. 3G,H). Notably, although the gene families associated with the innate immune response were enriched in both species-specific dispensable gene families, the number of such gene families was drastically higher in C. nigoni strains (45 to 69) (Fig. 3G) compared with C. briggsae strains (one to four) (Fig. 3H). In fact, innate immune response genes are the most significantly enriched across all the C. nigoni strains (Fig. 3G). These findings suggest that C. nigoni populations may experience substantially higher selection pressure from pathogens in their native environments compared with C. briggsae populations.
Genes encoding Cullin-E3 ubiquitin-ligase-adaptors are major contributors to both gene family and genomic sequence divergence between C. nigoni and C. briggsae
Given the significant enrichment of immune response genes among C. nigoni–specific dispensable genes, we next investigated whether genes encoding specific protein domains are selectively enriched. To address this, we performed domain enrichment analysis on C. nigoni–specific dispensable genes from all C. nigoni strains. F-box, BTB/POZ, and MATH emerged as the top three most significantly enriched domains, all of which can be essential domains for Cullin-E3 ubiquitin-ligase adaptors (Fig. 4A). These adaptor proteins mediate substrate binding during poly-ubiquitination of Cullin-E3 ubiquitin-ligase complexes. Additionally, domains associated with F-box genes, such as the FOG-2 Homology (FTH) domain, were also highly enriched (Fig. 4A). Genes containing these domains typically undergo rapid birth-and-death evolution and are speculated to play critical roles in innate immune responses in nematodes (Thomas 2006). These findings suggest that C. nigoni populations are likely to experience some stronger selection pressures such as pathogen exposure compared with C. briggsae, driving the species-specific expansion and evolution of the ubiquitin-ligase-adaptor genes.
E3 ubiquitin-ligase-adaptor genes contribute to both gene family and genomic sequence divergence between C. nigoni and C. briggsae. (A–C) Bubble plot showing protein domain enrichment analysis for genes belonging to C. nigoni–specific dispensable gene families (as shown in Fig. 3B; A), genes located within interspecific unalignable regions of C. nigoni (as shown in Fig. 2A; B), and genes located within intraspecific divergent regions of C. nigoni wild isolates (as shown in Fig. 2B; C). The most significantly enriched domains, namely, F-box, BTB/POZ, and MATH, are highlighted. (D) Gene family expansion and contraction analysis across five Caenorhabditis nematodes. The predicted number of expanded (red) and contracted (green) gene families are indicated for each species as well as the ancestral node. (Cre) C. remanei; (Cbn) C. brenneri; (Cel) C. elegans. (E) Predicted numbers of expanded (red) and contracted (green) gene families encoding F-box, BTB/POZ, and MATH domain-containing proteins in each of the five nematode species as shown in panel D. (F–H) Chromosomal distribution of genes encoding proteins with F-box domains (F), BTB/POZ domains (G), and MATH domains (H) across all the C. nigoni strains. Relative chromosomal positions are used to account for differences in chromosome lengths across the strains.
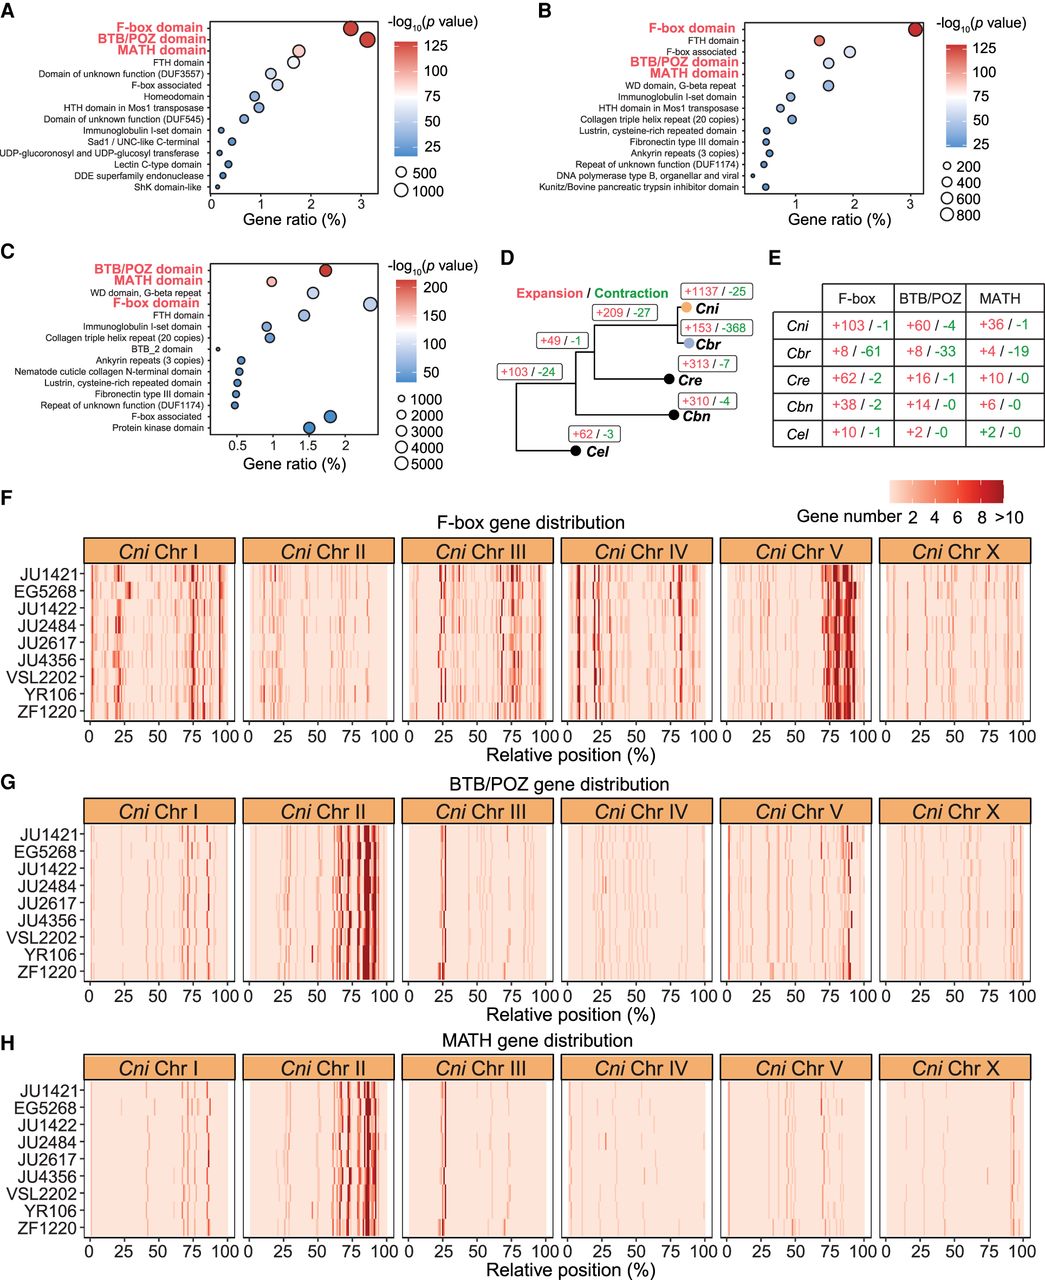
Given the C. nigoni–specific abundance of unaligned regions and dispensable genes (Figs. 2, 3), we hypothesized that the E3 ubiquitin-ligase-adaptor genes may primarily arise from both intra- and interspecific genomic sequence divergence. To test this, we conducted a similar domain enrichment analysis on genes located within the interspecific unaligned regions of JU1421 (as shown in Fig. 2A) and aggregated intraspecific unaligned regions across C. nigoni populations (as shown in Fig. 2B). As expected, domains associated with ubiquitin-ligase adaptors were similarly enriched in these regions (Fig. 4B,C). Moreover, both the upstream and downstream 2 kb sequences, as well as the gene bodies of genes encoding these domains, exhibited significantly lower levels of nucleotide conservation (decreased phyloP score) compared with other genes in C. nigoni (Supplemental Fig. S8). Taken together, these results demonstrate the critical role of ubiquitination and protein degradation–related genes in driving both C. nigoni–specific dispensable gene family expansions and intra- and interspecific sequence divergence between the two nematodes.
The results are also consistent with previous findings that the same three domains (F-box, BTB/POZ, and MATH) are among the most significantly enriched in the JU1421 strain compared with AF16 across all genes (Yin et al. 2018; Xie et al. 2024). Similar domain enrichments were observed across all C. nigoni wild isolates relative to C. briggsae wild isolates (Supplemental Fig. S9), indicating a general expansion of genes encoding these E3 ubiquitin-ligase-adaptor domains in C. nigoni. To systematically analyze the expansion trajectory of these gene families, we employed CAFE5 (Mendes et al. 2020), a computational tool designed to evaluate the evolution of gene families using phylogenetic data. Using C. nigoni and C. briggsae reference strains (JU1421 and AF16), along with three outgroup nematodes (C. elegans, C. remanei, and C. brenneri), we identified 1137 significantly expanded and 368 significantly contracted gene families in C. nigoni and C. briggsae, respectively (Fig. 4D). GO enrichment analysis of biological processes further confirmed that both expanded and contracted gene families were significantly enriched for immune response genes (Supplemental Fig. S10). We then focused on gene families encoding the enriched ubiquitin-ligase-adaptor domains identified earlier. We observed a consistently higher number of expanded gene families in outcrossing species, with C. nigoni showing the most pronounced expansion across all three domains (Fig. 4E). In contrast, C. briggsae exhibits a contraction in gene families containing these domains (Fig. 4E). Taken together, these results suggest a presumably differential selection pressure imposed by pathogens or other stresses between the two species.
Previous studies demonstrated that fast-evolving genes tend to be located on the autosomal arms, whereas conserved ones are predominantly found in the centers (Rockman and Kruglyak 2009). To determine whether the enriched ubiquitin-ligase-adaptor genes show any chromosomal distribution bias, we analyzed their genomic locations across C. nigoni strains. Although these genes were broadly distributed across all chromosomes, we observed a striking clustering of F-box genes on the right arm of Chr V in all C. nigoni strains (Fig. 4F). Genes encoding the BTB/POZ and MATH domains were predominantly located on the right arm of Chr II (Fig. 4G,H), which may be because nearly half of the BTB/POZ domain–containing genes also encode a MATH domain. Similar distribution patterns were observed in C. briggsae strains, albeit in a less pronounced manner (Supplemental Fig. S11). These results suggest that these genes might have already undergone local gene duplications in the common ancestor of the two species.
F-box genes have undergone a remarkable expansion in C. nigoni compared with C. briggsae
Given the substantial expansion and the largest numerical differences in F-box genes between C. nigoni and C. briggsae, we conducted an in-depth analysis of these genes in both species. Using previous CAFE5 results, we examined the expansion and contraction of 212 F-box gene families identified across five species (C. nigoni, C. briggsae, C. remanei, C. brenneri, and C. elegans) (Fig. 5A; Supplemental Table S5). In C. nigoni, 49% (103 families) expanded, whereas <1% (one family) contracted (Fig. 5A; Supplemental Table S5). In contrast, in C. briggsae only 4% (8 families) expanded and 29% (61 families) contracted (Fig. 5A; Supplemental Table S5), indicating substantial divergence in F-box family evolution during or after their speciation. Notably, 93 families expanded exclusively in C. nigoni, a pattern not observed even in the outcrossing species C. remanei and C. brenneri (Fig. 5A; Supplemental Table S5). This suggests that the expansion may reflect adaptations to specific environmental challenges only encountered by C. nigoni populations. Furthermore, we observed that a subset of F-box gene families (mostly large in size) underwent expansion in the common ancestor of the two species but subsequently contracted in C. briggsae, implying that reduced selection pressure in C. briggsae contributed to the loss of these genes after its speciation with C. nigoni (Fig. 5A).
F-box genes are remarkably expanded in C. nigoni compared with C. briggsae. (A) Heatmap showing the differential expansion (pink) and contraction (blue) of F-box gene families across five Caenorhabditis species (as shown in Fig. 4D) and their ancestral node. Gene families are arranged by their total size across all five species. F-box gene families without significant changes are labeled in white. The total numbers of expanded (red) and contracted (green) F-box gene families are also shown. (B, left) Schematic representation of F-box gene types based on the domains they contain. (Right) Bubble plot showing the numbers of each type of F-box gene across all strains of C. nigoni and C. briggsae. (C) The physical and phylogenetic distances of the F-box genes are largely correlated. (Top) Protein phylogenetic tree of all FBA2-containing F-box genes (as shown in panel B) in the C. nigoni reference strain (JU1421) based on the maximum likelihood method. Genes are color-coded by their chromosomal locations. (Bottom) Pairwise chromosomal distances between F-box genes. Note that the physical and phylogenetical distances of the genes are largely positively corelated. (D,E) Comparison of expression levels (log2(FKPM + 1)) for F-box genes (D) and non-F-box genes (E) in adults versus embryonic stages of the C. nigoni reference strain (JU1421). P-values were calculated using two-sided Wilcoxon rank-sum test.
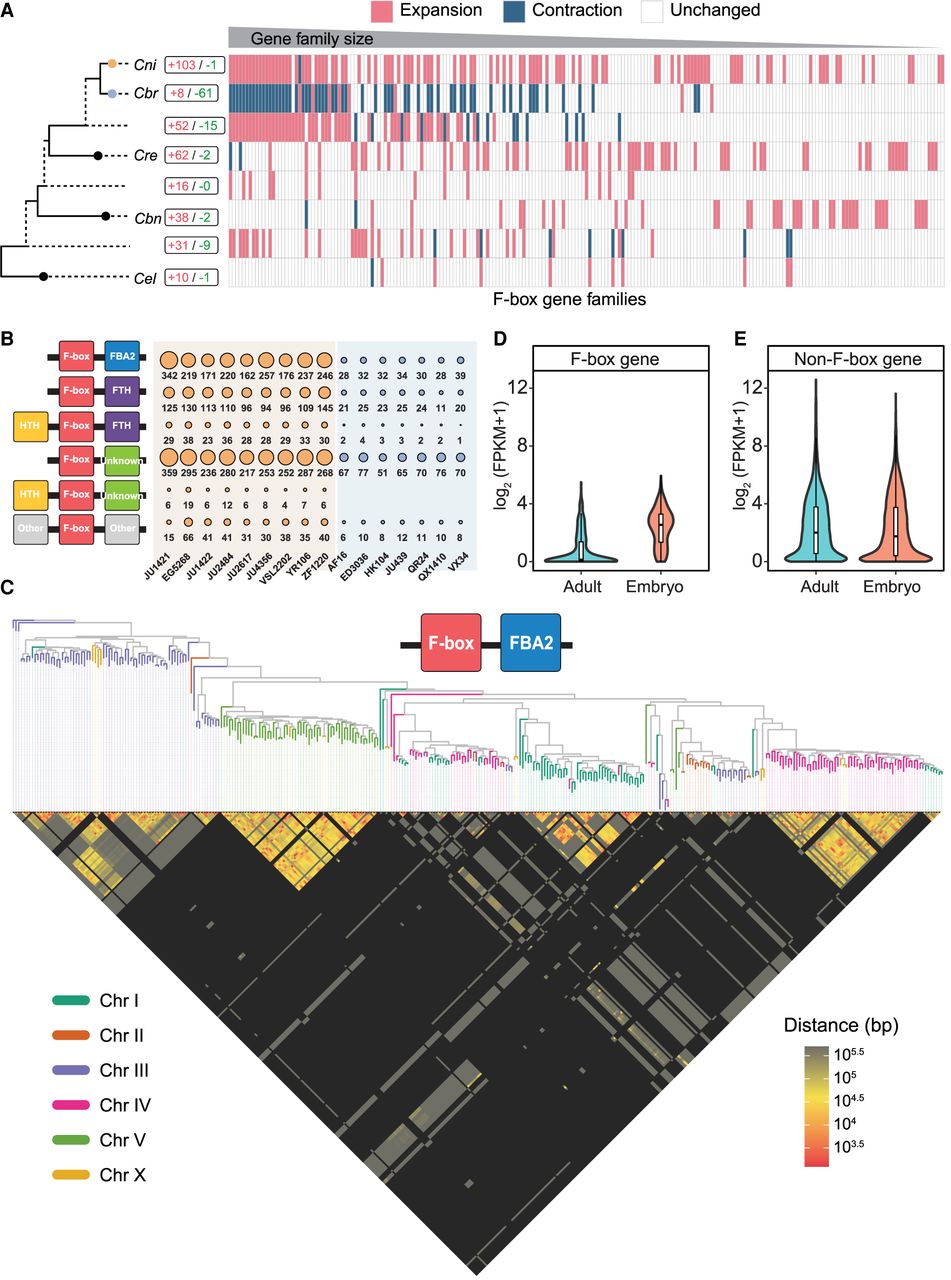
F-box domains are frequently found in combination with other functional domains to participate in diverse cellular pathways (Kipreos and Pagano 2000). To investigate whether the expansion of F-box genes is biased toward specific domain associations, we classified F-box genes into distinct types based on their coassociated domains. In C. elegans, F-box proteins typically harbor a C-terminal F-box-associated domain and a dispensable N-terminal domain, often derived from transposons (Thomas 2006; Wang et al. 2021). In C. nigoni and C. briggsae, the common F-box-associated domains include F-box Associated Domain 2 (FBA2), FTH, and several uncharacterized (“Unknown”) domains (Fig. 5B). Notably, a subset of FTH-containing and Unknown domain—containing F-box proteins also possesses a helix–turn–helix (HTH) domain derived from the TC1/Mariner transposon, similar to those identified in C. elegans (Thomas 2006; Almeida et al. 2025). Based on these, we partitioned all F-box genes in C. nigoni and C. briggsae into six types, as illustrated in Figure 5B. Although the abundance of each type is consistent among strains within each species, every F-box gene type is more prevalent in C. nigoni than in C. briggsae, indicating a general expansion in C. nigoni (Fig. 5B). Notably, F-box genes carrying the HTH + F-box + Unknown domain combination are exclusive to C. nigoni strains (Fig. 5B), suggesting their recent C. nigoni–specific evolution. Further analysis revealed a strong correlation between the phylogenetic and physical distances among C. nigoni F-box genes within individual types. For example, closely related F-box genes tend to cluster on the same chromosome, with pairwise distances decreasing as sequence identity increases, particularly in the three largest groups (genes containing FBA2, FTH, or Unknown domains) in JU1421 (Fig. 5B,C; Supplemental Fig. S12). These findings strongly support the hypothesis that the extensive expansion of F-box genes in C. nigoni is largely driven by local tandem duplication, likely through unequal crossover.
In C. elegans, F-box genes are predominantly expressed during embryogenesis (Ma et al. 2024; Almeida et al. 2025). We observed a similar expression pattern in C. nigoni: In the JU1421 strain, most F-box genes were significantly upregulated during the embryonic stage compared with the adult stage (Fig. 5D; Supplemental Fig. S13). In contrast, this trend was not evident among non-F-box genes (Fig. 5E; Supplemental Fig. S13). Collectively, these findings suggest a broad and drastic expansion of F-box genes in C. nigoni relative to C. briggsae, likely driven by species-specific pathogenic pressures.
The fbxn gene family is highly polymorphic across C. nigoni populations
We recently discovered the first HI gene pair between C. nigoni (JU1421) and C. briggsae (AF16), comprising a PGM-encoding gene, Cbr-shls-1 in C. briggsae, and a C. nigoni–specific F-box gene, Cni-neib-1 (Xie et al. 2024). Cni-NEIB-1 selectively targets Cbr-SHLS-1 for degradation, leading to hybrid embryonic lethality, which is consistent with a two-gene Dobzhansky–Muller incompatibility (DMI) model (Fig. 6A). Notably, Cni-neib-1 does not target its own PGM (Cni-SHLS-1), thereby allowing Cni-shls-1 to compensate for PGM deficiency and mask the DMI effect in wild-type F1 hybrids (Fig. 6A). We further demonstrated that Cni-neib-1 is a member of a C. nigoni–specific F-box gene family, the fbxn family, which has undergone extensive expansion and constitutes the largest C. nigoni–specific F-box gene family at least in JU1421 (Xie et al. 2024). We wondered whether the species-specific expansion of the fbxn gene family is conserved across C. nigoni populations.
The fbxn gene family is highly polymorphic across C. nigoni populations. (A) Schematics illustrating the two-gene Dobzhansky–Muller incompatibility (DMI) between the F-box gene Cni-neib-1 and the phosphoglucomutase (PGM)-encoding gene Cbr-shls-1. The presence of Cni-shls-1 masks the DMI in F1 hybrids of the two species. (B) Chromosomal locations of Cni-neib-1 and all the other fbxn genes across C. nigoni strains. Gene models flanking Cni-neib-1 or the gene cluster containing other fbxn genes are shown on top. phyloP score distributions per 100 kb along Chr IV are also shown. C. elegans gene names except Cni-neib-1 and Cni-shls-1 are used for simplicity. (C) Gene models within the region containing the fbxn gene cluster in C. nigoni strains. The total number of fbxn genes and the strand (Watson or Crick) on which Cni-shls-1 is located are indicated. Genes are color-coded as follows: fbxn genes (red); conserved genes orthologous to those in other Caenorhabditis species including F21D5.3 (yellow), Cni-shls-1 (light green), otub-3 (dark blue), and klp-11 (light blue); and other remaining genes (white). All regions and gene models are shown to scale. (D) Schematic comparison of gene orders for the four orthologous genes (as shown in panel C) across Caenorhabditis ancestors, all C. briggsae strains, and all C. nigoni strains. Red boxes highlight differences in gene orders. Note that Cni-shls-1 and otub-3 are inverted only in C. nigoni wild isolate VSL2202 and ZF1220 compared with C. briggsae strains. (E) Heatmap showing cDNA sequence identity of Cni-shls-1 (top), Cni-otub-3 (middle), and Cni-neib-1 (bottom) across all C. nigoni strains. Note that Cni-neib-1 sequences are 100% identical across all strains. (F) Gene models flanking Cni-neib-1 in C. nigoni strains. Genes are color-coded as follows: Cni-neib-1 (red); conserved genes orthologous to those in other Caenorhabditis species including slc-25A18.2 (yellow) and pycr-4 (light green); histone genes (dark blue); a Cni-shls-1 paralog (brown); F55G1.1 (pink) and egas-4 (light blue); and other remaining genes (white). DNA sequence similarity among strains is also indicated. Note that only ZF1220 lacks the entire sequence containing Cni-neib-1 located between the histone genes. Sequence synteny (light gray) with similarity scores is also indicated. (G) Schematics showing the crossing strategy to evaluate potential negative interactions between Cni-neib-1 and Cni-shls-1 from ZF1220. (Left) F1 hybrids from the cross between Cni-shls-1−/− mutant (C. nigoni JU1421) and C. briggsae (AF16) are completely lethal owing to the incidental targeting of Cbr-shls-1 by Cni-neib-1. (Right) Intraspecific hybrid progeny from the cross between Cni-shls-1−/− mutant (JU1421) and ZF1220 are also expected to be lethal if Cni-neib-1 targets Cni-shls-1 from ZF1220. (H) Comparison of F1 hybrid hatching percentages between crosses of Cni-shls-1−/− fathers with C. briggsae mothers or C. nigoni (ZF1220) mothers. (****) P < 0.0001, Fisher's exact test. Error bars, 95% CI. (I) Comparison of progeny hatching rates of C. nigoni (ZF1220) injected with control buffer versus amplified Cni-neib-1 sequences. P = 0.2636, Fisher's exact test. Error bars, 95% CI.
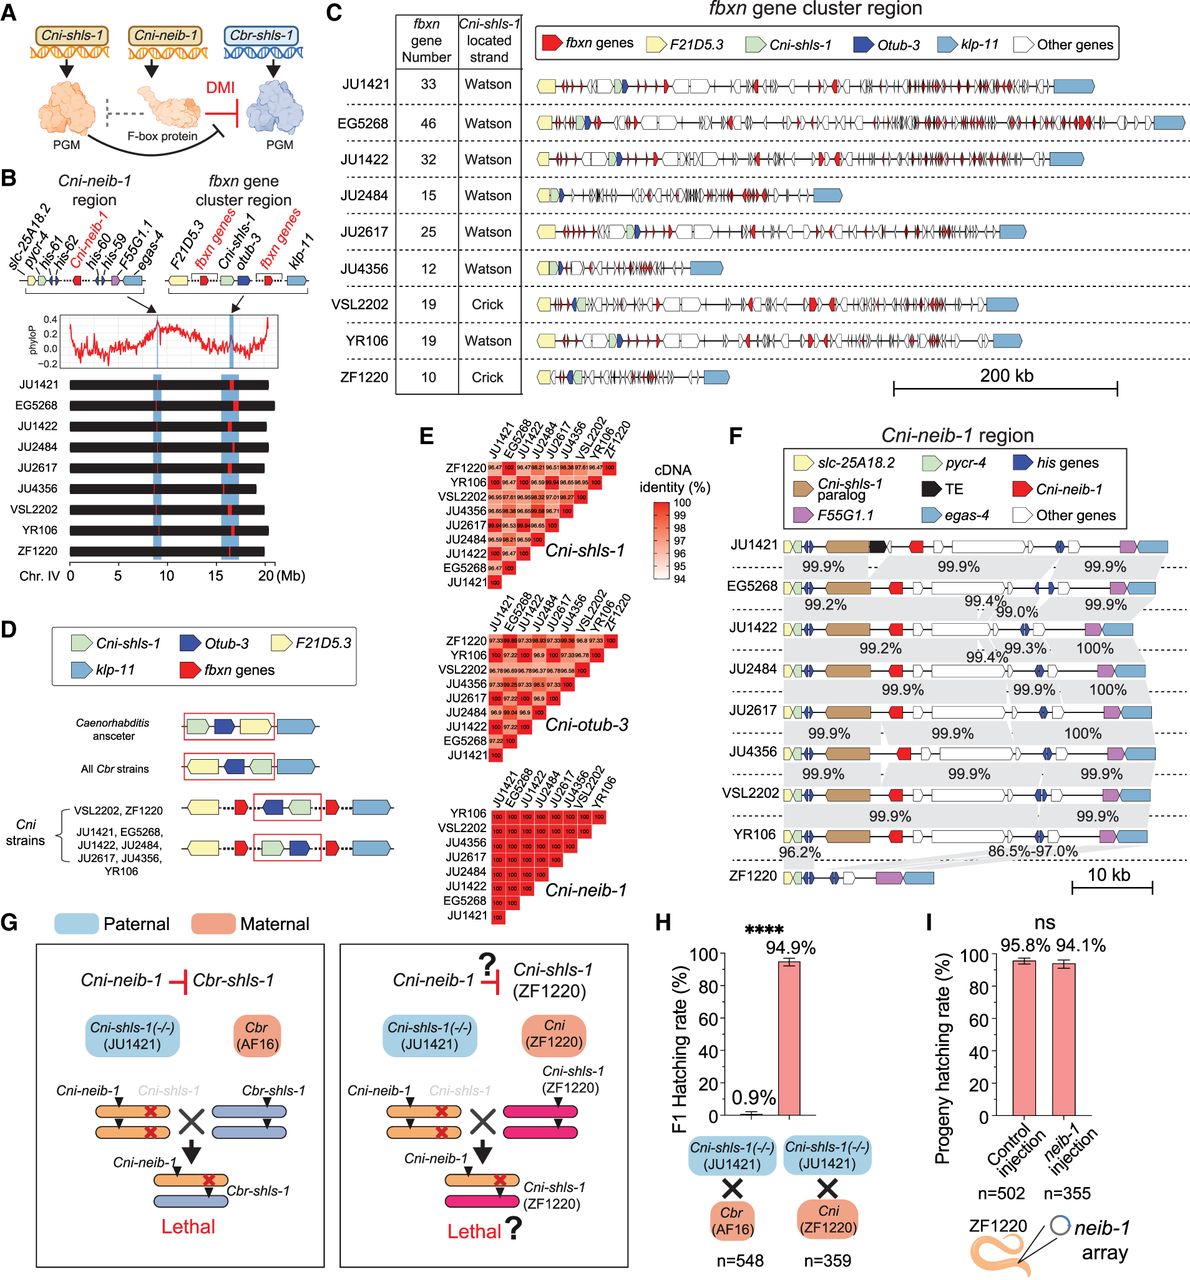
We found that all C. nigoni strains possess the fbxn gene family, which is similarly located on the right arm of Chr IV (Fig. 6B). In accordance with our previous findings in JU1421, all Cni-neib-1 loci are centrally positioned on Chr IV, except in ZF1220, which lacks a Cni-neib-1 gene locus (Fig. 6B; Xie et al. 2024). The remaining fbxn genes form a cluster on the right arm of Chr IV (Fig. 6B). Although the genomic regions surrounding this gene cluster show lower conservation (i.e., reduced phyloP scores) than those flanking Cni-neib-1, the syntenic genes bordering both regions remain conserved (Fig. 6B). This conservation suggests that the fbxn family evolved in the common ancestor of C. nigoni populations rather than arising independently in specific strains. We further examined the fbxn gene cluster delimited by Cni-F21D5.3 and Cni-klp-11 (Fig. 6C). We observed substantial variation in both cluster length and fbxn gene count (Fig. 6C). For example, strain EG5268 contains 46 fbxn genes spanning ∼546 kb, whereas ZF1220 has only 10 fbxn genes covering 144 kb, and JU4356 harbors 12 fbxn genes spanning 134 kb. Moreover, although strains such as JU2617, VSL2202, and YR106 maintain a cluster length comparable to that of JU1421, their fbxn counts (25, 19, and 19, respectively) are lower than JU1421's 33 genes (Fig. 6C). These findings indicate a highly dynamic evolutionary pattern of the fbxn gene cluster region across C. nigoni populations. Supporting this notion, we detected extensive sequence rearrangements in specific fbxn genes within JU1421, likely resulting from either tandem duplications and/or transposon-mediated sequence reshuffling (Supplemental Fig. S14).
To further elucidate the mechanism underlying the rapid evolution of fbxn genes, we analyzed additional genes within the fbxn gene cluster region. Although most of these genes are C. nigoni specific and exhibit variable conservation across strains, two nematode orthologs, namely, Cni-shls-1 and Cni-otub-3, are consistently present in this region (Fig. 6C,D). Interestingly, along with the polymorphism observed in the fbxn family, we detected gene rearrangements involving these orthologs. Specifically, although both genes are located on Watson's strand in most strains, their orientations are reversed in the strains VSL2202 and ZF1220 (Fig. 6C,D). We previously demonstrated that the gene order of F21D5.3, shls-1, and otub-3 is conserved across all Caenorhabditis nematodes, with an inversion occurring only in the ancestor of C. briggsae and C. nigoni (Xie et al. 2024). This inversion is maintained in all C. briggsae strains analyzed in this study, yet additional inversions affecting Cni-shls-1 and Cni-otub-3 are observed in only certain C. nigoni strains, likely driven by the expansion of fbxn genes (Fig. 6D). Furthermore, the pairwise cDNA sequence identity (wild isolates vs. JU1421) of Cni-shls-1 and Cni-otub-3 is relatively lower in VSL2202 and ZF1220 than in other strains (Fig. 6E). Consistent with this, single-copy orthologous genes located within C. nigoni intraspecific unaligned regions exhibit markedly reduced cDNA sequence identity compared with those located outside these regions (Supplemental Fig. S15). Taken together, these results demonstrate that the evolution of fbxn genes influences both the orientation and sequence conservation of adjacent conserved genes, presumably via accelerated recombination during fbxn gene duplication, thereby reinforcing genetic divergence among populations and between species.
An unusually conserved genomic region is identified surrounding Cni-neib-1
Given the highly dynamic nature of fbxn genes across C. nigoni populations and the translocation of one of its members, Cni-neib-1, to the center of Chr IV (Xie et al. 2024), we initially anticipated that the genomic region encompassing Cni-neib-1 would also exhibit rapid evolution. Unexpectedly, the ∼40 kb region surrounding Cni-neib-1 is invariant (>99% sequence identity) across both the cDNA sequences of the resident genes and the intergenic regions (Fig. 6F). The cDNA sequences of Cni-neib-1 are 100% identical across all strains (Fig. 6E,F). Interestingly, in ZF1220, which lacks the Cni-neib-1 locus, an ∼30 kb C. nigoni–specific sequence that normally flanks Cni-neib-1 is also absent (Fig. 6F), and this absence is accompanied by a reduction in sequence identity of the surrounding syntenic region to ∼86.5%–97% (Fig. 6F). Collectively, these observations suggest that exceptional selection force acts on the region harboring Cni-neib-1. Whether the loss of the 30 kb flanking sequence is directly related to the observed reduced conservation of adjacent sequences warrants further investigation.
Cni-neib-1 appears to have been lost in ZF1220 during its lineage-specific evolution
We finally investigated whether Cni-neib-1 failed to evolve in ZF1220 or was initially present but subsequently lost. The structural and sequence conservation of Cni-neib-1 in eight of the nine C. nigoni wild isolates suggests its loss in ZF1220 (Fig. 6F). We previously demonstrated that the presumable coevolution of Cni-shls-1 with Cni-neib-1 prevents accidental negative interactions between the two (Xie et al. 2024). However, in the absence of Cni-neib-1 and with a consequent relaxation of selection pressure in C. briggsae, Cbr-shls-1 is inadvertently targeted (Xie et al. 2024). Based on this assumption, we reasoned that if ZF1220 had never evolved Cni-neib-1, its Cni-shls-1 would also be susceptible to targeting by Cni-neib-1 (Fig. 6G). To test this, we crossed Cni-shls-1−/− homozygous mutant males from JU1421 with females from both AF16 and ZF1220. In contrast to the nearly complete lethality observed in the JU1421 (Cni-shls-1−/−) × AF16 cross, only ∼5% lethality occurred in the JU1421 (Cni-shls-1−/−) × ZF1220 cross (Fig. 6H), indicating that Cni-neib-1 does not target the Cni-shls-1 allele from ZF1220. To further validate this, we introduced the amplified JU1421 Cni-neib-1 genomic sequence into ZF1220, a sequence previously shown to be functionally expressed in both JU1421 and AF16 (Xie et al. 2024). Consistently, no significant difference in hatching rates was observed between embryos from the Cni-neib-1 injection and the control injection (Fig. 6I). Collectively, these results support the conclusion that Cni-neib-1 was recently lost in strain ZF1220 and that Cni-shls-1 in this strain has already evolved to avoid mistargeting by Cni-neib-1.
Discussion
How conspecific and interspecific genomic variation leads to reproductive isolation remains poorly understood. In this study, we performed a comprehensive pan-genome analysis in order to understand the intra- and interspecific genome evolution among closely related nematode species, C. briggsae and C. nigoni, between which widespread reproductive isolation is observed although they can still produce partially viable hybrid progeny. We generated the first genomic representations for eight wild isolates of C. nigoni using both ONT long reads and Illumina high-throughput short reads and for six chromosomal-level genomes of C. briggsae using previously established contigs (Widen et al. 2023). These assemblies provide an excellent complement to the genomes of wild isolates previously reconstructed mainly from short-read data (Thomas et al. 2015; Yin et al. 2018). We compared both intraspecific variations within C. nigoni and C. briggsae populations and interspecific differences between the two species. Our analyses reveal novel insights into inter- and intraspecific genomic divergences that may ultimately drive speciation. Notably, we identified substantially larger unaligned genomic regions among C. nigoni populations compared with C. briggsae populations, which account for the significant genome size difference between the two species (Fig. 2). We also observed a disproportionate expansion of C. nigoni–specific dispensable genes, which represent the major source of interspecific gene content variation (Fig. 3). These findings culminated in the identification of E3 ubiquitin-ligase-adaptor genes, particularly F-box genes, as major contributors to these genomic variations (Figs. 4, 5). In addition, our pangenome analysis revealed elevated divergence (e.g., more unaligned regions) and increased nucleotide variation (e.g., more abundant SNPs) among C. nigoni populations compared with C. briggsae, consistent with the hypothesis that outcrossing worms harbor greater extremely divergent regions than do androdiecious ones (Teterina et al. 2023). These findings suggest that the dioecious C. nigoni may adapt more rapidly to environmental stress through genome evolution than the primarily self-fertilizing C. briggsae. The results also underscore the power of long-read sequencing in pangenome analysis, which provides unprecedented insights into genomic diversity and the evolutionary processes driving speciation. For example, recent studies on C. elegans wild isolates have significantly advanced our understanding of evolutionary trajectories in geographically isolated populations and the mechanisms of incipient speciation (Boocock et al. 2021; Crombie et al. 2024). We anticipate that further refinements of pan-genomic methodologies, such as graph-based approaches, will deepen our understanding of genomic variation and its role in speciation.
A striking finding of this study is the pronounced disparity in unaligned regions between C. nigoni and C. briggsae (Fig. 2). These regions closely mirror the punctuated hyperdivergent regions previously identified in C. elegans (Thompson et al. 2015; Lee et al. 2021) and parasitic nematodes (Stevens et al. 2023). Genes enriched in punctuated hyperdivergent regions are also frequently associated with environmental and immune responses (Thompson et al. 2015; Lee et al. 2021). We therefore anticipate that hyperdivergent/unaligned regions in C. nigoni and C. briggsae are similarly maintained by balancing selection as observed in other nematodes (Lee et al. 2021; Stevens et al. 2023), thereby preserving genetic variation. Marked by extensive gene and sequence variability, these regions may participate in host–pathogen arms races, analogous to those observed in parasitic nematodes, albeit with nematodes acting as pathogens rather than hosts (Stevens et al. 2023). Similarly, hyperdivergent regions in vertebrates also frequently carry genes enriched for host–pathogen interactions (Leffler et al. 2013), and human MHC loci are also located within highly dynamic genomic regions (Raymond et al. 2005).
In addition to mediating immune responses, C. nigoni–specific genes appear to participate in various additional biological processes, as indicated by the significant enrichment of multiple gene families beyond those associated with immunity (Fig. 4B). The relatively larger hyperdivergent/unaligned regions in C. nigoni likely reflect differential selection pressures from environmental or pathogenic challenges, driving the rapid evolution of immune-related or other stress-related genes. As to the expansion of protein degradation pathway genes such as F-box ones, this dynamic is expected to increase the risk of mistargeting essential proteins, thereby accelerating the chance of negative epistatic interactions between C. nigoni and C. briggsae, which we refer to as incompatible immunity. In support of this notion, we recently identified one of these fast-evolving genes encoding an F-box gene in C. nigoni, Cni-neib-1, which functions as an adaptor for E3 ligase–mediated protein ubiquitylation and degradation (Xie et al. 2024). The recent birth of this gene blocks gene flow from C. nigoni to C. briggsae by specifically targeting the C. briggsae essential and conserved gene Cbr-shls-1, ultimately resulting in hybrid embryonic lethality in the absence of C. nigoni’s SHLS-1. Presumably, C. nigoni's shls-1 acquires some new mutations, which prevents the autoimmunity-like self-targeting by Cni-neib-1. Therefore, in complement to the previous findings that HI gene hotspots are often located in regions with inversions (Noor et al. 2001), our results demonstrate that hyperdivergent/unaligned regions may also frequently harbor HI genes.
We demonstrated a significant expansion of genes encoding for Cullin-E3 ubiquitin-ligase complex adaptors, especially F-box genes of all types (including novel variants with specific domains) in C. nigoni compared with C. briggsae (Fig. 5). This asymmetrical expansion may stem from differential turnover rates of F-box genes, as observed in other nematodes (Ma et al. 2021; Wang et al. 2021; Adams et al. 2023). The dynamic evolution of F-box genes facilitates their co-option for novel functions (Nayak et al. 2005; Guo et al. 2009) and the acquisition of new domains (Almeida et al. 2025), potentially reflecting species-specific immune responses or responses to environmental changes. Supporting this, pathogen exposure induces the upregulation of F-box genes (Bakowski et al. 2014), and C. briggsae but not C. nigoni exhibits susceptibility to infection by the intracellular microsporidian pathogen, Nematocida parisii (Wadi et al. 2023). Moreover, the highly clustered arrangement of F-box genes frequently flanked by various repeats, such as those in the fbxn gene family and other ubiquitin-ligase-adaptor gene families, a pattern also observed in previous studies (e.g., the case of the Cbr-she-1 paralogs) (Guo et al. 2009), reflects their rapid turnover, likely driven by unequal crossover. This rapid evolution not only facilitates polymorphism but also induces local sequence rearrangements that accelerate the divergence of adjacent conserved genes. These rearrangements, such as inversions that suppress local recombination and trigger gene divergence, may contribute to the lineage-specific evolution of speciation genes (Noor et al. 2001). Similarly, Arabidopsis HI loci (e.g., DM gene clusters) are typically associated with lineage-specific expansions and contractions accompanied by local genomic rearrangements (Calvo-Baltanás et al. 2021). Furthermore, although DMI can be triggered by F-box genes like Cni-neib-1, other HIs such as a toxin–antidote (TA) model can also be associated with ubiquitination and protein degradation–related gene families. Supporting this, F-box genes and their variants have been identified within TA-containing punctuated divergent regions (Noble et al. 2021) and have been confirmed to encode antidotes in TA pairs in nematodes (Seidel et al. 2008; Ben-David et al. 2017; Tikanova et al. 2025) and rice (You et al. 2023). Given the extensive expanded repertoire of F-box genes in nematodes, we anticipate that additional F-box genes or their functional analogs may play similar roles in pathogen defense or other stress responses, inadvertently establishing new or enforcing existing reproductive barriers as a byproduct. Notably, we also demonstrated that the high turnover rate of F-box genes is not necessarily associated with population-level variation. For example, the exceptional 100% sequence identity of Cni-neib-1 (Fig. 6F) and the striking similarity of its flanking regions suggest the action of some strong selection forces across all C. nigoni populations, potentially driven by a common pathogen (e.g., an intracellular one). Alternatively, this pattern could result from genomic hitchhiking of other linked elements that maintain linkage disequilibrium.
Finally, our finding here is consistent with our “creation by degradation” hypothesis (Xie et al. 2024), which emphasizes the role of differential protein degradation between populations or species, particularly that related to immune responses, in driving/enforcing speciation. The highly polymorphic nature of immune-related genes or genomic regions renders them particularly prone to mistargeting, potentially triggering autoimmune-like responses, namely, incompatible immunity. The fbxn gene family exemplifies this process, as the dynamic evolution of F-box genes is analogous to the high divergence observed in immune response genes among plants (Chae et al. 2014; Van de Weyer et al. 2019) or human populations (Nielsen et al. 2017; Browning et al. 2018). Notably, the remarkable dynamics of F-box genes in C. nigoni largely resemble those of plant nucleotide-binding leucine-rich repeat (NLR) genes, whose expansion and extensive polymorphism not only ensure broad target recognition against diverse pathogens but are also frequently linked to hybrid necrosis (Calvo-Baltanás et al. 2021). In mammals, this diversity is further amplified by a combination of both somatic modifications and heritable genetic variations, as evidenced by recent findings showing that germline variations substantially contribute to the human antibody repertoire (Rodriguez et al. 2023). We anticipate that the speciation mechanism driven by incompatible immunity, which involves differential protein degradation extends well beyond nematode species.
Methods
Worm maintenance and strains used
All worms were cultured at 25°C on nematode growth medium (NGM) plates with twice the standard agar concentration to avoid worm burrowing. JU1421 and AF16 were used as the reference strains for C. nigoni and C. briggsae, respectively. Wild isolates of C. nigoni included JU1422 as well as seven recently collected strains: EG5268, JU2484, JU2617, JU4356, VSL2202, YR106, and ZF1220 (Supplemental Fig. S1; Xie et al. 2024). Wild isolates of C. briggsae included ED3036, HK104, JU439, QR24, QX1410, and VX34.
RNA extraction and sequencing
Worms from two 90 mm plates containing mixed-stage populations for each C. nigoni wild isolate were washed and collected prior to total RNA extraction using TRIzol reagent (Invitrogen), following the manufacturer's protocol. mRNA was subsequently purified and sequenced by Novogene, using the Illumina TruSeq stranded mRNA library preparation method on a HiSeq instrument (paired-end, 150 bp).
Genomic DNA sequencing
Starved worms from at least six 90 mm plates were collected and washed for genomic DNA library preparation. High-molecular-weight (HMW) genomic DNA was extracted using the MasterPure complete DNA and RNA purification kit (Biosearch Technologies) following a worm-optimized protocol from the ONT community. For long-read sequencing, 4 µg of genomic DNA was processed using R10.4.1 flow cells (FLO-MIN114) with the ligation sequencing kit (SQK-LSK114). Sequencing and basecalling were performed on an ONT GridION device using default settings in MinKNOW software (v5.9.18), and only passed reads were retained for downstream analysis. Short-read genomic DNA sequencing was performed by Novogene on an Illumina HiSeq platform with paired-end reads (150 bp).
Genome assembly, gene prediction, and annotation of C. nigoni and C. briggsae strains
Genome assemblies for the reference strains of C. briggsae (AF16) and C. nigoni (JU1421) were previously generated using ONT long-read DNA sequencing in combination with chromatin conformation capture (Hi-C) data (Xie et al. 2023). Genome assembly for wild isolates of C. nigoni and C. briggsae were constructed by either assembling new contigs from raw reads or aligning existing contigs to the corresponding reference genomes, thereby achieving chromosomal-level assemblies. Ab initio protein-coding gene prediction was then performed with AUGUSTUS (v3.5.0) (Stanke and Morgenstern 2005). Detailed genome assembly processes are outlined in the Supplemental Methods.
Sequence rearrangement detection and analysis
To analyze sequence rearrangements between the two reference strains and among wild isolates of C. nigoni and C. briggsae, pairwise alignments were performed. The two reference genomes were aligned against each other, and each wild isolate was aligned to its corresponding reference (C. nigoni JU1421 or C. briggsae AF16) using the NUCmer tool from the MUMmer suite with the parameters ““‐‐mum ‐‐mincluster 100 ‐‐maxgap 300.” The alignment files were then imported into SyRI (v1.7.0) (Goel et al. 2019) to detect unaligned regions, syntenic blocks, and sequence rearrangements. Detailed classification of sequence rearrangement types by SyRI are outlined in the Supplemental Methods.
Gene-based pangenome analysis
Orthologous gene families were inferred from the proteomes of nine C. nigoni strains, seven C. briggsae strains, and three outgroup Caenorhabditis species, namely, C. elegans (N2), C. remanei (PX506), and C. brenneri (PB2801) (obtained from the NCBI BioProject database [https://www.ncbi.nlm.nih.gov/bioproject/] under accession numbers PRJNA13758, PRJNA577507, and PRJNA20035, respectively). Orthologous clustering was performed using OrthoFinder (v2.15) (for the orthogroup tables, see Supplemental Table S6; Emms and Kelly 2019) with the arguments “-M msa -A muscle -T iqtree,” which utilized MUSCLE (v5.1) for sequence alignment and IQ-TREE (v2.1.2) (Nguyen et al. 2015) for phylogenetic inference. Proteomes for the outgroup species were retrieved from WormBase (WS280). For each gene, only the longest isoform was retained, extracted using the agat_sp_keep_longest_isoform.pl script from the AGAT toolkit (v1.0.0). Core gene families were defined as those present in every strain within a species, whereas dispensable genes were those found in only a subset of conspecific strains. To simulate the dynamics of pan- and core-genome sizes as a function of genome sampling, various combinations of strains were extracted from the previously generated orthologous table, and the corresponding genome sizes were inferred. A LOESS regression was applied using the geom_smooth function from the ggplot2 package (v3.5.1) to model changes in pan- and core-genome sizes.
Multiple-genome alignment and phyloP calculation
To assess evolutionary conservation at single-nucleotide resolution, reference-free whole-genome alignments of all C. nigoni or C. briggsae strains were performed using Progressive Cactus (v2.6.9-20.04) (Armstrong et al. 2020). The single-sequence alignments of each chromosome, along with the phylogenetic tree models for intraspecific strains (see Phylogeny Analysis), were then analyzed using phyloFit from the Phylogenetic Analysis with Space/Time Models (PHAST) software package (v1.6; http://compgen.cshl.edu/phast/). The detailed parameters for the analysis are listed in the Supplemental Methods.
Population genetics calculation
CDS sequences from all genomes were extracted using the agat_sp_extract_sequences.pl from the AGAT toolkit (v1.0.0) to facilitate the calculation of π nucleotide and Tajima's D values. Specifically, CDS sequences for each gene family were aligned using MAFFT (v7.525); π nucleotide and Tajima's D values were then calculated using the Population and Evolutionary Genetics Analysis System (pegas) package (Paradis 2010).
Phylogeny analysis
The phylogenetic tree for all C. nigoni and C. briggsae strains (Fig. 1) was constructed using OrthoFinder, with the same parameters as described in the gene-based pangenome analysis. Phylogenetic relationships were inferred by concatenating the sequences of all single-copy orthologous genes. Similarly, the phylogenetic tree encompassing the C. nigoni and C. briggsae reference strains, along with three outgroup nematode species (C. elegans, C. remanei, and C. brenneri), was generated using OrthoFinder with parameters described in the gene family expansion and contraction analysis. The resulting trees were visualized using the ggtree (Yu et al. 2017) package. Multiple sequence alignments of all F-box protein sequences were performed using MAFFT (v7.525) (Katoh and Standley 2013), and maximum-likelihood (ML) phylogenetic trees were constructed using RAxML-NG (v1.2.1) (Kozlov et al. 2019) with the “-all” parameter, which performs both ML tree searches and automatic detection of the appropriate number of bootstrap replicates.
Gene family expansion and contraction analysis
Orthologous gene families and the phylogenetic relationships among five nematode species (C. briggsae [AF16], C. nigoni [JU1421], C. elegans, C. remanei, and C. brenneri) were predicted using OrthoFinder with the same parameters as described in the gene-based pangenome analysis (for the orthogroup tables, see Supplemental Table S7). Gene family expansion and contraction along specific lineages and ancestral nodes were analyzed with Computational Analysis of Gene Family Evolution (CAFE5; v1.1) (Mendes et al. 2020), which models the evolutionary dynamics of gene family size variation based on phylogenetic relationships. The analysis was performed using the base model with default parameters. Gene families with a P-value < 0.05 for size changes were deemed significantly expanded or contracted, whereas those with P-values > 0.05 were classified as unchanged (Supplemental Table S5).
Gene expression and enrichment analysis
Gene expression data for embryonic and adult C. nigoni (JU1421) were retrieved from our previous study (Xie et al. 2022) and from Sánchez-Ramírez et al. (2021), respectively, under NCBI BioProject accession numbers PRJNA849332 and PRJNA659254. For adult expression, data from both male and female samples were combined. Raw RNA-seq reads were trimmed using Trim Galore! (https://github.com/FelixKrueger/TrimGalore) and subsequently aligned to the JU1421 genome (CN3) using STAR (v2.7.0b) (Dobin et al. 2013). Gene counts were generated using featureCounts (v2.20.0) (Liao et al. 2014). Genes with low expression (fewer than 10 mapped reads in all three replicates) were excluded from downstream analysis. Differential expression analysis was conducted using DESeq2 (v1.40.2) (Love et al. 2014).
Functional annotation of genes across all C. nigoni and C. briggsae strains was performed by querying protein sequences of all genes against the InterPro database using InterProScan (v5.65). InterPro integrates multiple sources of protein domain and ontology information, including Pfam and GO, thereby enabling the annotation of protein domains and assignment of GO terms for each gene. GO enrichment analysis was subsequently carried out using clusterProfiler package (v3.2), and domain enrichment analysis was performed using a Fisher's exact test as described previously (Xie et al. 2024).
Characterization of F-box, BTB/POZ, or MATH domain–containing genes and the fbxn gene family
Genes containing F-box, BTB/POZ, or MATH domains were identified by extracting those annotated with Pfam IDs PF00646, PF00651, and PF00917, respectively, from the functional annotation results. F-box genes were further classified into subtypes based on the presence of additional Pfam domains, including FBA2 (PF07735), FTH (PF01827), and HTH (PF17906). F-box genes lacking any predicted C-terminal domain were categorized as carrying an “unknown” domain, whereas genes with all the other domains were assigned to the “other” category. The fbxn gene members in wild isolates of C. nigoni were identified from the orthologous table (Supplemental Table S6) predicted using OrthoFinder as described in the gene-based pangenome analysis, and their annotations were further manually verified for accuracy. Syntenic genomic regions of fbxn genes in C. nigoni strains were visualized using the gggenomes package (v1.0.1) (Hackl et al. 2024), and the sequence similarity of the genomic regions flanking Cni-neib-1 was assessed using BLASTN with default parameters.
Data access
Raw sequencing reads, including ONT long-read, Illumina short-read genomic DNA-seq, and Illumina RNA-seq data generated in this study, have been submitted to the NCBI BioProject database (https://www.ncbi.nlm.nih.gov/bioproject/) under accession number PRJNA1219697. The reference genomes CN3 and CB5, along with their annotation files have been submitted to the NCBI BioProject database under accession number PRJNA917437 and are accessible from GitHub (Xie et al. 2024; https://github.com/PikaPatch/CB-CN). The genomes and annotation files for all wild isolates of C. briggsae and C. nigoni were submitted to the European Nucleotide Archive (ENA; https://www.ebi.ac.uk/ena/) under accession number PRJEB100562 and are also available at GitHub (https://github.com/PikaPatch/F-box/tree/main/genome). All customized scripts used for data analysis and graph generation are available at GitHub (https://github.com/pikapatch/f-box/tree/main/code) and as Supplemental Code.
Competing interest statement
The authors declare no competing interests.
Acknowledgments
We thank Marie-Anne Félix, Luc Barre, Lise Frézal, Mirko Francesconi, Remy Froissart, Takao Inoue, Varsha Singh, and Henrique Teotonio for providing C. nigoni wild isolates. We thank Mr. Chung Wai Shing for his logistical support and the members of Z.Z.’s laboratory for their valuable comments. This work was supported by General Research Funds (HKBU12101520, HKBU12101522, HKBU12101323, HKBU12100024) from the Hong Kong Research Grant Council and Hong Kong Innovation and Technology Fund, GHP/176/21SZ, Environment and Conservation Fund (2023-160) from the Hong Kong Environmental Protection Department and Initiation Grant for Faculty Niche Research Areas RC-FNRA-IG /21-22/SCI/02, and Seed Funding for Collaborative Research Grants (RC-SFCRG/24-25/R1/SCI/01) from the Hong Kong Baptist University to Z.Z., and by the National Natural Science Foundation of China (32400491) to X.D. This study was supported by the Wu Jieh Yee Institute of Translational Chinese Medicine Research, HKBU.
Author contributions: X.D. and Z.Z. conceived the project. X.D., Y.P., and M.Y. performed experiments. Y.P. and X.D. analyzed data. Z.Z. coordinated the project and provided guidance and resources. X.D., Y.P., and Z.Z. wrote the manuscript.
Notes
[1] Supplementary material [Supplemental material is available for this article.]
[2] Article published online before print. Article, supplemental material, and publication date are at https://www.genome.org/cgi/doi/10.1101/gr.280885.125.
References
- ↵Adams PE, Eggers VK, Millwood JD, Sutton JM, Pienaar J, Fierst JL. 2023. Genome size changes by duplication, divergence, and insertion in Caenorhabditis worms. Mol Biol Evol 40: msad039. 10.1093/molbev/msad039
- ↵Almeida MV, Li Z, Rebelo-Guiomar P, Dallaire A, Fiedler L, Price JL, Sluka J, Liu X, Butter F, Rödelsperger C, 2025. Transposable elements drive regulatory and functional innovation of F-box genes. Mol Biol Evol 42: msaf097. 10.1093/molbev/msaf097
- ↵Armstrong J, Hickey G, Diekhans M, Fiddes IT, Novak AM, Deran A, Fang Q, Xie D, Feng S, Stiller J, 2020. Progressive cactus is a multiple-genome aligner for the thousand-genome era. Nature 587: 246–251. 10.1038/s41586-020-2871-y
- ↵Bakowski MA, Desjardins CA, Smelkinson MG, Dunbar TA, Lopez-Moyado IF, Rifkin SA, Cuomo CA, Troemel ER. 2014. Ubiquitin-mediated response to microsporidia and virus infection in C. elegans. PLoS Pathog 10: e1004200. 10.1371/journal.ppat.1004200
- ↵Ben-David E, Burga A, Kruglyak L. 2017. A maternal-effect selfish genetic element in Caenorhabditis elegans. Science 356: 1051–1055. 10.1126/science.aan0621
- ↵Bi Y, Ren X, Yan C, Shao J, Xie D, Zhao Z. 2015. A genome-wide hybrid incompatibility landscape between Caenorhabditis briggsae and C. nigoni. PLoS Genet 11: e1004993. 10.1371/journal.pgen.1004993
- ↵Bi Y, Ren X, Li R, Ding Q, Xie D, Zhao Z. 2019. Specific interactions between autosome and X chromosomes cause hybrid male sterility in Caenorhabditis species. Genetics 212: 801–813. 10.1534/genetics.119.302202
- ↵Boocock J, Sadhu MJ, Durvasula A, Bloom JS, Kruglyak L. 2021. Ancient balancing selection maintains incompatible versions of the galactose pathway in yeast. Science 371: 415–419. 10.1126/science.aba0542
- ↵Bredemeyer KR, Hillier L, Harris AJ, Hughes GM, Foley NM, Lawless C, Carroll RA, Storer JM, Batzer MA, Rice ES, 2023. Single-haplotype comparative genomics provides insights into lineage-specific structural variation during cat evolution. Nat Genet 55: 1953–1963. 10.1038/s41588-023-01548-y
- ↵Browning SR, Browning BL, Zhou Y, Tucci S, Akey JM. 2018. Analysis of human sequence data reveals two pulses of archaic Denisovan admixture. Cell 173: 53–61.e9. 10.1016/j.cell.2018.02.031
- ↵Calvo-Baltanás V, Wang J, Chae E. 2021. Hybrid incompatibility of the plant immune system: an opposite force to heterosis equilibrating hybrid performances. Front Plant Sci 11: 576796. 10.3389/fpls.2020.576796
- ↵Chae E, Bomblies K, Kim S-T, Karelina D, Zaidem M, Ossowski S, Martín-Pizarro C, Laitinen RA, Rowan BA, Tenenboim H, 2014. Species-wide genetic incompatibility analysis identifies immune genes as hot spots of deleterious epistasis. Cell 159: 1341–1351. 10.1016/j.cell.2014.10.049
- ↵Collins RL, Brand H, Karczewski KJ, Zhao X, Alföldi J, Francioli LC, Khera AV, Lowther C, Gauthier LD, Wang H, 2020. A structural variation reference for medical and population genetics. Nature 581: 444–451. 10.1038/s41586-020-2287-8
- ↵Coyne J, Orr H. 2004. Speciation. Sinauer Associates, Sunderland, MA.
- ↵Crombie TA, McKeown R, Moya ND, Evans Kathryn S, Widmayer Samuel J, LaGrassa V, Roman N, Tursunova O, Zhang G, Gibson Sophia B, 2024. CaeNDR, the Caenorhabditis natural diversity resource. Nucleic Acids Res 52: D850–D858. 10.1093/nar/gkad887
- ↵Cutter AD. 2023. Speciation and development. Evol Dev 25: 289–327. 10.1111/ede.12454
- ↵Dobin A, Davis CA, Schlesinger F, Drenkow J, Zaleski C, Jha S, Batut P, Chaisson M, Gingeras TR. 2013. STAR: ultrafast universal RNA-seq aligner. Bioinformatics 29: 15–21. 10.1093/bioinformatics/bts635
- ↵Emms DM, Kelly S. 2019. OrthoFinder: phylogenetic orthology inference for comparative genomics. Genome Biol 20: 238. 10.1186/s13059-019-1832-y
- ↵Goel M, Sun H, Jiao W-B, Schneeberger K. 2019. SyRI: finding genomic rearrangements and local sequence differences from whole-genome assemblies. Genome Biol 20: 277. 10.1186/s13059-019-1911-0
- ↵Guo Y, Lang S, Ellis RE. 2009. Independent recruitment of F box genes to regulate hermaphrodite development during nematode evolution. Curr Biol 19: 1853–1860. 10.1016/j.cub.2009.09.042
- ↵Hackl T, Ankenbrand M, van Adrichem B, Wilkins D, Haslinger K. 2024. gggenomes: effective and versatile visualizations for comparative genomics. arXiv:2411.13556 [q-bio.GN]. 10.48550/arXiv.2411.13556
- ↵Jiao C, Xie X, Hao C, Chen L, Xie Y, Garg V, Zhao L, Wang Z, Zhang Y, Li T, 2025. Pan-genome bridges wheat structural variations with habitat and breeding. Nature 637: 384–393. 10.1038/s41586-024-08277-0
- ↵Katoh K, Standley DM. 2013. MAFFT multiple sequence alignment software version 7: improvements in performance and usability. Mol Biol Evol 30: 772–780. 10.1093/molbev/mst010
- ↵Kipreos ET, Pagano M. 2000. The F-box protein family. Genome Biol 1: reviews3002.1. 10.1186/gb-2000-1-5-reviews3002
- ↵Kozlov AM, Darriba D, Flouri T, Morel B, Stamatakis A. 2019. RAxML-NG: a fast, scalable and user-friendly tool for maximum likelihood phylogenetic inference. Bioinformatics 35: 4453–4455. 10.1093/bioinformatics/btz305
- ↵Kozlowska JL, Ahmad AR, Jahesh E, Cutter AD. 2012. Genetic variation for postzygotic reproductive isolation between Caenorhabditis briggsae and Caenorhabditis sp. 9. Evolution 66: 1180–1195. 10.1111/j.1558-5646.2011.01514.x
- ↵Krzywinski M, Schein J, Birol I, Connors J, Gascoyne R, Horsman D, Jones SJ, Marra MA. 2009. Circos: an information aesthetic for comparative genomics. Genome Res 19: 1639–1645. 10.1101/gr.092759.109
- ↵Lee D, Zdraljevic S, Stevens L, Wang Y, Tanny RE, Crombie TA, Cook DE, Webster AK, Chirakar R, Baugh LR, et al. 2021. Balancing selection maintains hyper-divergent haplotypes in Caenorhabditis elegans. Nat Ecol Evol 5: 794–807. 10.1038/s41559-021-01435-x
- ↵Leffler EM, Gao Z, Pfeifer S, Ségurel L, Auton A, Venn O, Bowden R, Bontrop R, Wall JD, Sella G, 2013. Multiple instances of ancient balancing selection shared between humans and chimpanzees. Science 339: 1578–1582. 10.1126/science.1234070
- ↵Li R, Ren X, Bi Y, Ho VW, Hsieh CL, Young A, Zhang Z, Lin T, Zhao Y, Miao L, 2016. Specific down-regulation of spermatogenesis genes targeted by 22G RNAs in hybrid sterile males associated with an X-chromosome introgression. Genome Res 26: 1219–1232. 10.1101/gr.204479.116
- ↵Liao Y, Smyth GK, Shi W. 2014. featureCounts: an efficient general purpose program for assigning sequence reads to genomic features. Bioinformatics 30: 923–930. 10.1093/bioinformatics/btt656
- ↵Liao W-W, Asri M, Ebler J, Doerr D, Haukness M, Hickey G, Lu S, Lucas JK, Monlong J, Abel HJ, 2023. A draft human pangenome reference. Nature 617: 312–324. 10.1038/s41586-023-05896-x
- ↵Love MI, Huber W, Anders S. 2014. Moderated estimation of fold change and dispersion for RNA-seq data with DESeq2. Genome Biol 15: 550. 10.1186/s13059-014-0550-8
- ↵Ma F, Lau CY, Zheng C. 2021. Large genetic diversity and strong positive selection in F-box and GPCR genes among the wild isolates of Caenorhabditis elegans. Genome Biol Evol 13: evab048. 10.1093/gbe/evab048
- ↵Ma F, Lau CY, Zheng C. 2024. Young duplicate genes show developmental stage- and cell type-specific expression and function in Caenorhabditis elegans. Cell Genom 4: 100467. 10.1016/j.xgen.2023.100467
- ↵Maheshwari S, Barbash DA. 2011. The genetics of hybrid incompatibilities. Annu Rev Genet 45: 331–355. 10.1146/annurev-genet-110410-132514
- ↵Mendes FK, Vanderpool D, Fulton B, Hahn MW. 2020. CAFE 5 models variation in evolutionary rates among gene families. Bioinformatics 36: 5516–5518. 10.1093/bioinformatics/btaa1022
- ↵Mohan AV, Escuer P, Cornet C, Lucek K. 2024. A three-dimensional genomics view for speciation research. Trends Genet 40: 638–641. 10.1016/j.tig.2024.05.009
- ↵Moran BM, Payne C, Langdon Q, Powell DL, Brandvain Y, Schumer M. 2021. The genomic consequences of hybridization. eLife 10: e69016. 10.7554/eLife.69016
- ↵Nayak S, Goree J, Schedl T. 2005. fog-2 and the evolution of self-fertile hermaphroditism in Caenorhabditis. PLoS Biol 3: e6. 10.1371/journal.pbio.0030006
- ↵Nguyen LT, Schmidt HA, von Haeseler A, Minh BQ. 2015. IQ-TREE: a fast and effective stochastic algorithm for estimating maximum-likelihood phylogenies. Mol Biol Evol 32: 268–274. 10.1093/molbev/msu300
- ↵Nielsen R, Akey JM, Jakobsson M, Pritchard JK, Tishkoff S, Willerslev E. 2017. Tracing the peopling of the world through genomics. Nature 541: 302–310. 10.1038/nature21347
- ↵Noble LM, Yuen J, Stevens L, Moya N, Persaud R, Moscatelli M, Jackson JL, Zhang G, Chitrakar R, Baugh LR, 2021. Selfing is the safest sex for Caenorhabditis tropicalis. eLife 10: e62587. 10.7554/eLife.62587
- ↵Noor MAF, Grams KL, Bertucci LA, Reiland J. 2001. Chromosomal inversions and the reproductive isolation of species. Proc Natl Acad Sci 98: 12084–12088. 10.1073/pnas.221274498
- ↵Nosil P, Feder JL, Gompert Z. 2021. How many genetic changes create new species? Science 371: 777–779. 10.1126/science.abf6671
- ↵Paradis E. 2010. pegas: an R package for population genetics with an integrated–modular approach. Bioinformatics 26: 419–420. 10.1093/bioinformatics/btp696
- ↵Raymond CK, Kas A, Paddock M, Qiu R, Zhou Y, Subramanian S, Chang J, Palmieri A, Haugen E, Kaul R, 2005. Ancient haplotypes of the HLA class II region. Genome Res 15: 1250–1257. 10.1101/gr.3554305
- ↵Ren X, Li R, Wei X, Bi Y, Ho VWS, Ding Q, Xu Z, Zhang Z, Hsieh C-L, Young A, et al. 2018. Genomic basis of recombination suppression in the hybrid between Caenorhabditis briggsae and C. nigoni. Nucleic Acids Res 46: 1295–1307. 10.1093/nar/gkx1277
- ↵Rockman MV, Kruglyak L. 2009. Recombinational landscape and population genomics of Caenorhabditis elegans. PLoS Genet 5: e1000419. 10.1371/journal.pgen.1000419
- ↵Rodriguez OL, Safonova Y, Silver CA, Shields K, Gibson WS, Kos JT, Tieri D, Ke H, Jackson KJL, Boyd SD, 2023. Genetic variation in the immunoglobulin heavy chain locus shapes the human antibody repertoire. Nat Commun 14: 4419. 10.1038/s41467-023-40070-x
- ↵Sánchez-Ramírez S, Weiss JG, Thomas CG, Cutter AD. 2021. Widespread misregulation of inter-species hybrid transcriptomes due to sex-specific and sex-chromosome regulatory evolution. PLoS Genet 17: e1009409. 10.1371/journal.pgen.1009409
- ↵Sedlazeck FJ, Lee H, Darby CA, Schatz MC. 2018. Piercing the dark matter: bioinformatics of long-range sequencing and mapping. Nat Rev Genet 19: 329–346. 10.1038/s41576-018-0003-4
- ↵Seidel HS, Rockman MV, Kruglyak L. 2008. Widespread genetic incompatibility in C. elegans maintained by balancing selection.Science 319: 589–594. 10.1126/science.1151107
- ↵Sherman RM, Salzberg SL. 2020. Pan-genomics in the human genome era. Nat Rev Genet 21: 243–254. 10.1038/s41576-020-0210-7
- ↵Sirén J, Monlong J, Chang X, Novak AM, Eizenga JM, Markello C, Sibbesen JA, Hickey G, Chang P-C, Carroll A, 2021. Pangenomics enables genotyping of known structural variants in 5202 diverse genomes. Science 374: abg8871. 10.1126/science.abg8871
- ↵Stanke M, Morgenstern B. 2005. AUGUSTUS: a web server for gene prediction in eukaryotes that allows user-defined constraints. Nucleic Acids Res 33: W465–W467. 10.1093/nar/gki458
- ↵Stevens L, Moya ND, Tanny RE, Gibson SB, Tracey A, Na H, Chitrakar R, Dekker J, Walhout AJM, Baugh LR, 2022. Chromosome-level reference genomes for two strains of Caenorhabditis briggsae: an improved platform for comparative genomics. Genome Biol Evol 14: evac042. 10.1093/gbe/evac042
- ↵Stevens L, Martínez-Ugalde I, King E, Wagah M, Absolon D, Bancroft R, Gonzalez de la Rosa P, Hall JL, Kieninger M, Kloch A, 2023. Ancient diversity in host-parasite interaction genes in a model parasitic nematode. Nat Commun 14: 7776. 10.1038/s41467-023-43556-w
- ↵Taylor SA, Larson EL. 2019. Insights from genomes into the evolutionary importance and prevalence of hybridization in nature. Nat Ecol Evol 3: 170–177. 10.1038/s41559-018-0777-y
- ↵Teterina AA, Willis JH, Lukac M, Jovelin R, Cutter AD, Phillips PC. 2023. Genomic diversity landscapes in outcrossing and selfing Caenorhabditis nematodes. PLoS Genet 19: e1010879. 10.1371/journal.pgen.1010879
- ↵Thomas JH. 2006. Adaptive evolution in two large families of ubiquitin-ligase adapters in nematodes and plants. Genome Res 16: 1017–1030. 10.1101/gr.5089806
- ↵Thomas CG, Wang W, Jovelin R, Ghosh R, Lomasko T, Trinh Q, Kruglyak L, Stein LD, Cutter AD. 2015. Full-genome evolutionary histories of selfing, splitting, and selection in Caenorhabditis. Genome Res 25: 667–678. 10.1101/gr.187237.114
- ↵Thompson OA, Snoek LB, Nijveen H, Sterken MG, Volkers RJ, Brenchley R, Van't Hof A, Bevers RP, Cossins AR, Yanai I, 2015. Remarkably divergent regions punctuate the genome assembly of the Caenorhabditis elegans Hawaiian strain CB4856. Genetics 200: 975–989. 10.1534/genetics.115.175950
- ↵Tikanova P, Ross JJ, Hagmüller A, Pühringer F, Pliota P, Krogull D, Stefania V, Hunold M, Koreshova A, Koller A, 2025. Recurrent evolution of selfishness from an essential tRNA synthetase in Caenorhabditis tropicalis. Nat Ecol Evol 9: 2374–2390. 10.1038/s41559-025-02894-2
- ↵Todesco M, Owens GL, Bercovich N, Légaré JS, Soudi S, Burge DO, Huang K, Ostevik KL, Drummond EBM, Imerovski I, 2020. Massive haplotypes underlie ecotypic differentiation in sunflowers. Nature 584: 602–607. 10.1038/s41586-020-2467-6
- ↵Van de Weyer AL, Monteiro F, Furzer OJ, Nishimura MT, Cevik V, Witek K, Jones JDG, Dangl JL, Weigel D, Bemm F. 2019. A species-wide inventory of NLR genes and alleles in Arabidopsis thaliana. Cell 178: 1260–1272.e14. 10.1016/j.cell.2019.07.038
- ↵Wadi L, El Jarkass HT, Tran TD, Islah N, Luallen RJ, Reinke AW. 2023. Genomic and phenotypic evolution of nematode-infecting microsporidia. PLoS Pathog 19: e1011510. 10.1371/journal.ppat.1011510
- ↵Wang A, Chen W, Tao S. 2021. Genome-wide characterization, evolution, structure, and expression analysis of the F-box genes in Caenorhabditis. BMC Genomics 22: 889. 10.1186/s12864-021-08189-7
- ↵Widen SA, Bes IC, Koreshova A, Pliota P, Krogull D, Burga A. 2023. Virus-like transposons cross the species barrier and drive the evolution of genetic incompatibilities. Science 380: eade0705. 10.1126/science.ade0705
- ↵Woodruff GC, Eke O, Baird SE, Félix M-A, Haag ES. 2010. Insights into species divergence and the evolution of hermaphroditism from fertile interspecies hybrids of Caenorhabditis nematodes. Genetics 186: 997–1012. 10.1534/genetics.110.120550
- ↵Xie D, Ye P, Ma Y, Li Y, Liu X, Sarkies P, Zhao Z. 2022. Genetic exchange with an outcrossing sister species causes severe genome-wide dysregulation in a selfing Caenorhabditis nematode. Genome Res 32: 2015–2027. 10.1101/gr.277205.122
- ↵Xie D, Gu B, Liu Y, Ye P, Ma Y, Wen T, Song X, Zhao Z. 2023. Efficient targeted recombination with CRISPR/Cas9 in hybrids of Caenorhabditis nematodes with suppressed recombination. BMC Biol 21: 203. 10.1186/s12915-023-01704-0
- ↵Xie D, Ma Y, Ye P, Liu Y, Ding Q, Huang G, Félix MA, Cai Z, Zhao Z. 2024. A newborn F-box gene blocks gene flow by selectively degrading phosphoglucomutase in species hybrids. Proc Natl Acad Sci 121: e2418037121. 10.1073/pnas.2418037121
- ↵Yin D, Schwarz EM, Thomas CG, Felde RL, Korf IF, Cutter AD, Schartner CM, Ralston EJ, Meyer BJ, Haag ES. 2018. Rapid genome shrinkage in a self-fertile nematode reveals sperm competition proteins. Science 359: 55–61. 10.1126/science.aao0827
- ↵You S, Zhao Z, Yu X, Zhu S, Wang J, Lei D, Zhou J, Li J, Chen H, Xiao Y, 2023. A toxin-antidote system contributes to interspecific reproductive isolation in rice. Nat Commun 14: 7528. 10.1038/s41467-023-43015-6
- ↵Yu G, Smith DK, Zhu H, Guan Y, Lam TTY, McInerny G. 2017. ggtree: an R package for visualization and annotation of phylogenetic trees with their covariates and other associated data. Methods Ecol Evol 8: 28–36. 10.1111/2041-210X.12628