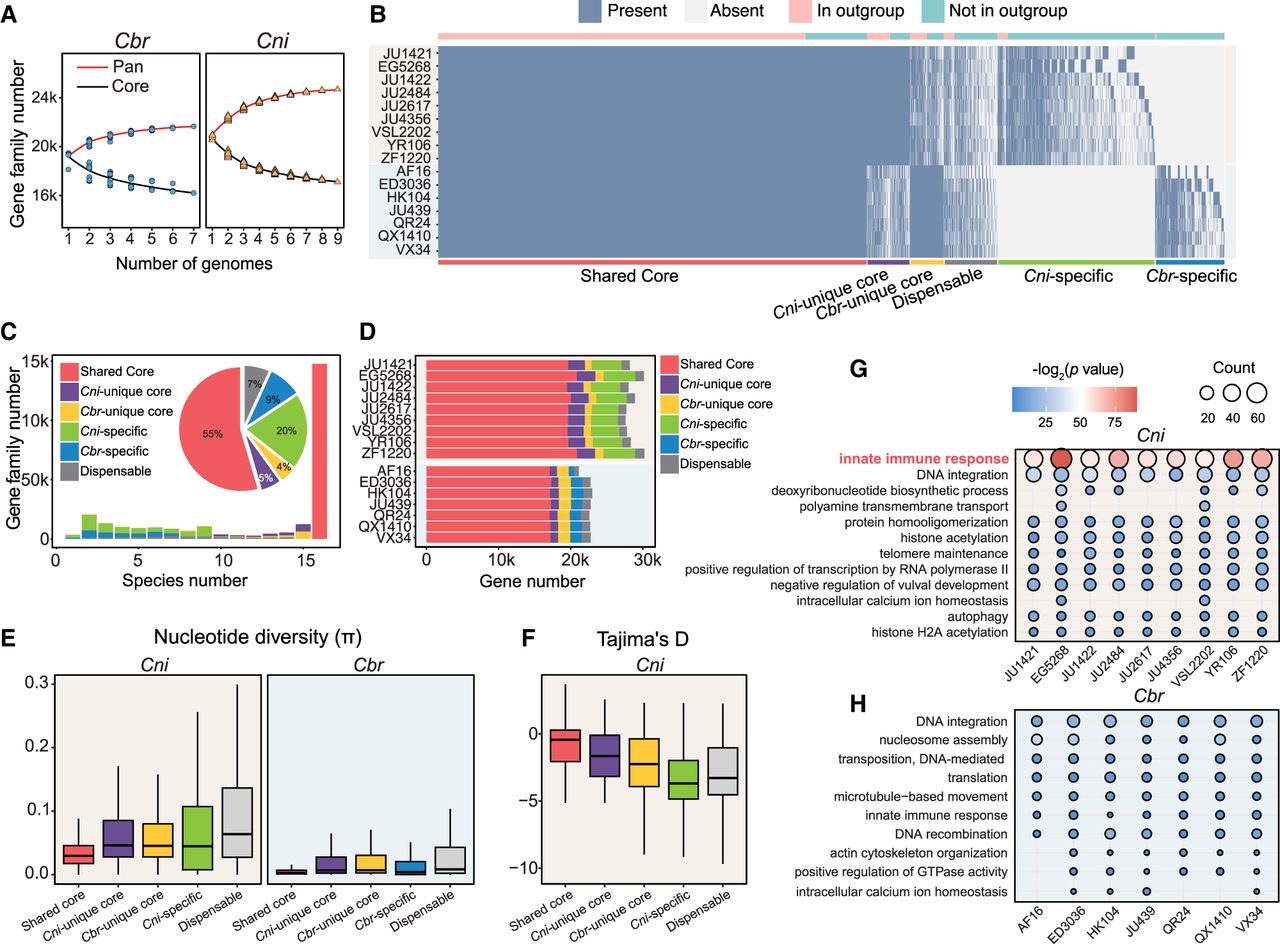
Gene-based pangenome analysis reveals the distinction of species-specific dispensable gene families between C. nigoni and C. briggsae. (A) Gene-based pangenome (red) and core-genome (black) accumulation curves for all possible combinations of genomes within each species. Genome numbers range from one to nine for C. nigoni (triangles) and one to seven for C. briggsae (circles), respectively. (B) Presence (dark blue) and absence (light gray) matrix of all gene families across strains of both species. Gene families are classified into six categories: shared core (red), C. nigoni–unique core (purple), C. briggsae–unique core (yellow), dispensable (gray), C. nigoni–specific (green), and C. briggsae–specific (blue). The presence (pink) and absence (light green) of each gene family in the outgroup species are shown as bars at the top. (C) Pie chart showing the number and proportion of each type of gene family as shown in panel B. The histogram shows the counts and types of gene families shared across different numbers of genomes. (D) Proportion and counts of genes belonging to each gene family group (as shown in panel B) for each strain of C. nigoni and C. briggsae. (E) Box plot comparing the mean values of nucleotide sequence diversity (π nucleotide) of C. nigoni (left) or C. briggsae (right) genes belonging to each gene family group. Wilcoxon rank-sum tests were performed to evaluate significant differences. (F) Box plot comparing the mean values of Tajima's D for C. nigoni genes belonging to each gene family group. Wilcoxon rank-sum tests were performed to evaluate significant differences. (G,H) Gene Ontology (GO) enrichment analysis of biological processes for C. nigoni–specific dispensable genes (H) and C. briggsae–specific dispensable genes (G). The most significantly enriched category for C. nigoni–specific dispensable genes, namely, innate immune response, is highlighted in red.