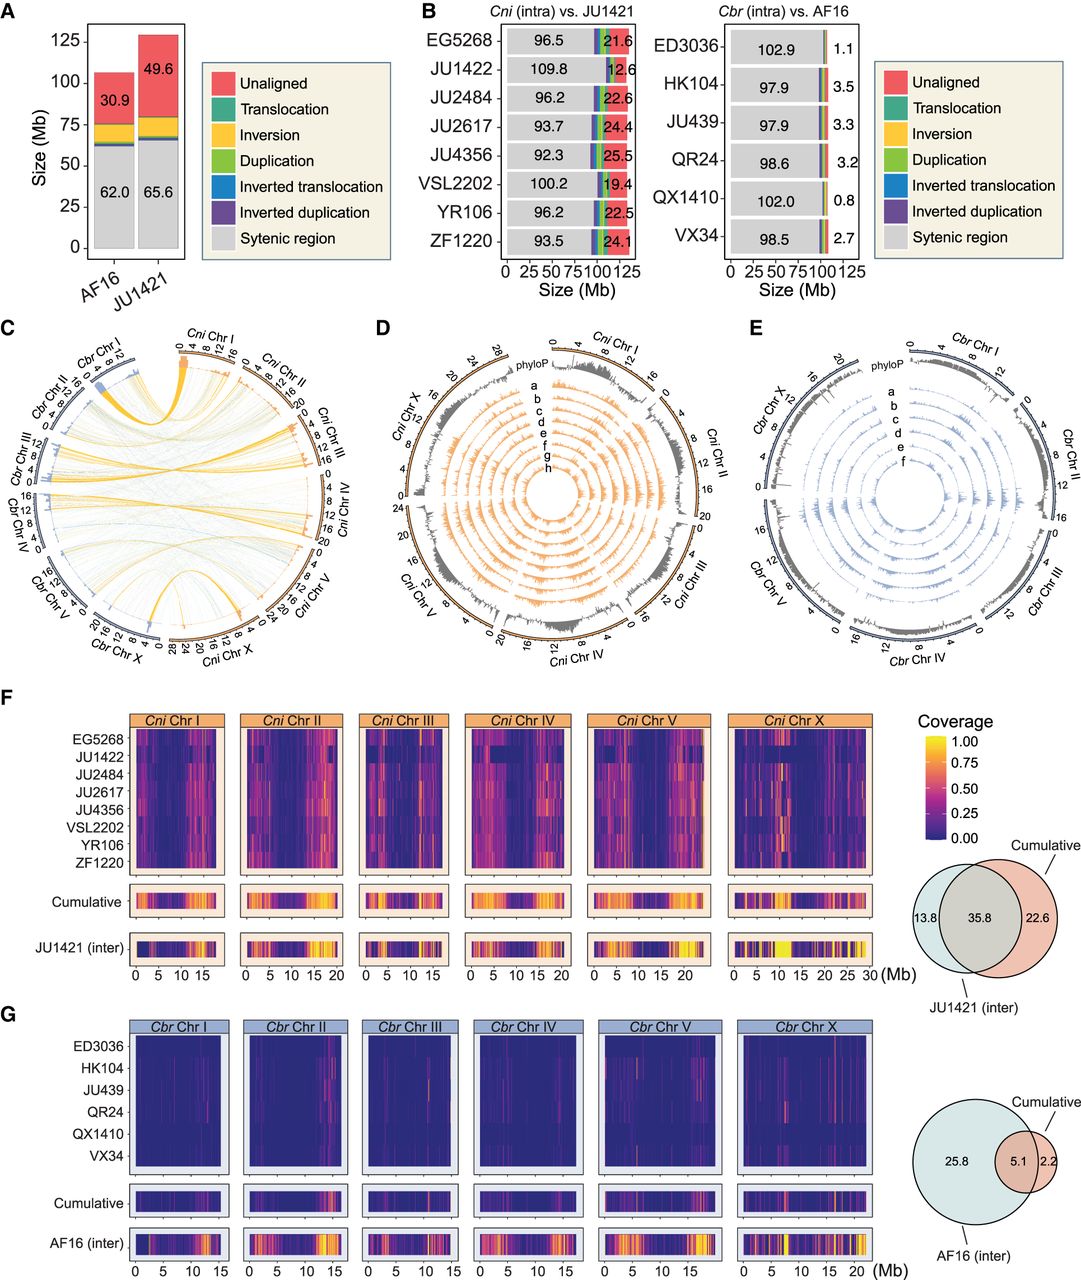
Genome size variations between C. nigoni and C. briggsae strains are predominantly attributed to the unalignable regions. (A) Stacked bar plot showing the composition of interspecific genome structural variation (SV) types in the reference strain of C. briggsae (AF16; left) and C. nigoni (JU1421; right) by pairwise comparison of the two. The sizes of the unaligned and syntenic regions are indicated within the bars. (B) Stacked bar plot showing the composition of intraspecific genome SV types among the wild isolates of C. nigoni (left) or C. briggsae (right) by comparing each wild isolate to its corresponding reference strain. The sizes of the unaligned and syntenic regions are labeled. (C) Circos plot (Krzywinski et al. 2009) showing the genome-wide distribution of SVs between C. nigoni and C. briggsae reference strains, as described in panel A. Each variation type is color-coded the same as in panel A. (D,E) Circos plot showing the genome-wide distribution of all the SVs for the wild isolates of C. nigoni (D) and C. briggsae (E) as described in panel B. Distribution of phyloP scores across the chromosomes is also indicated. (C. nigoni a to h) EG5268, JU1422, JU2484, JU2617, JU4356, VSL2202, YR106, and ZF1220; (C. briggsae a to f) ED3036, HK104, JU439, QR24, QX1410, and VX34. (F,G) Coverage of intraspecific and interspecific unaligned regions >100 kb chromosomal intervals in C. nigoni (F) and C. briggsae (G). Cumulative coverage of intraspecific unaligned regions is also shown. Venn diagrams on the right illustrate the sizes (in megabases) of shared unaligned regions between interspecific and cumulative intraspecific divergent regions for each species.