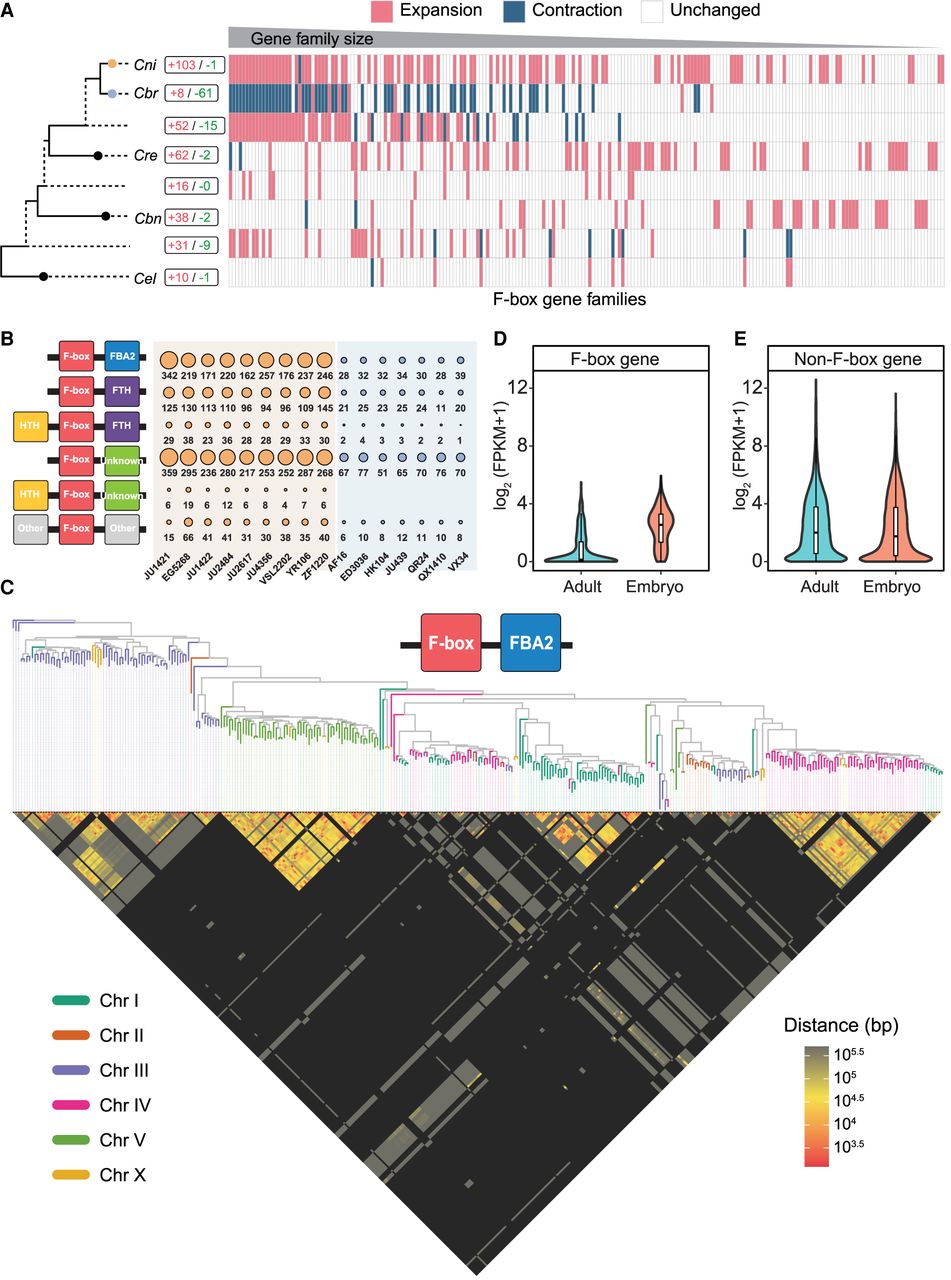
F-box genes are remarkably expanded in C. nigoni compared with C. briggsae. (A) Heatmap showing the differential expansion (pink) and contraction (blue) of F-box gene families across five Caenorhabditis species (as shown in Fig. 4D) and their ancestral node. Gene families are arranged by their total size across all five species. F-box gene families without significant changes are labeled in white. The total numbers of expanded (red) and contracted (green) F-box gene families are also shown. (B, left) Schematic representation of F-box gene types based on the domains they contain. (Right) Bubble plot showing the numbers of each type of F-box gene across all strains of C. nigoni and C. briggsae. (C) The physical and phylogenetic distances of the F-box genes are largely correlated. (Top) Protein phylogenetic tree of all FBA2-containing F-box genes (as shown in panel B) in the C. nigoni reference strain (JU1421) based on the maximum likelihood method. Genes are color-coded by their chromosomal locations. (Bottom) Pairwise chromosomal distances between F-box genes. Note that the physical and phylogenetical distances of the genes are largely positively corelated. (D,E) Comparison of expression levels (log2(FKPM + 1)) for F-box genes (D) and non-F-box genes (E) in adults versus embryonic stages of the C. nigoni reference strain (JU1421). P-values were calculated using two-sided Wilcoxon rank-sum test.