
Abstract
We conducted a genome-wide survey of Saccharomyces cerevisiae retrotransposons and identified a total of 331 insertions, including 217 Ty1, 34 Ty2, 41 Ty3, 32 Ty4, and 7 Ty5 elements. Eighty-five percent of insertions were solo long terminal repeats (LTRs) or LTR fragments. Overall, retrotransposon sequences constitute >377 kb or 3.1% of the genome. Independent evolution of retrotransposon sequences was evidenced by the identification of a single-base pair insertion/deletion that distinguishes the highly similar Ty1 and Ty2 LTRs and the identification of a distinct Ty1 subfamily (Ty1′). Whereas Ty1, Ty2, and Ty5 LTRs displayed a broad range of sequence diversity (typically ranging from 70%–99% identity), Ty3 and Ty4 LTRs were highly similar within each element family (most sharing >96% nucleotide identity). Therefore, Ty3 and Ty4 may be more recent additions to the S. cerevisiae genome and perhaps entered through horizontal transfer or past polyploidization events. Distribution of Ty elements is distinctly nonrandom: 90% of Ty1, 82% of Ty2, 95% of Ty3, and 88% of Ty4 insertions were found within 750 bases of tRNA genes or other genes transcribed by RNA polymerase III. tRNA genes are the principle determinant of retrotransposon distribution, and there is, on average, 1.2 insertions per tRNA gene. Evidence for recombination was found near many Ty elements, particularly those not associated with tRNA gene targets. For these insertions, 5′- and 3′-flanking sequences were often duplicated and rearranged among multiple chromosomes, indicating that recombination between retrotransposons can influence genome organization. S. cerevisiae offers the first opportunity to view organizational and evolutionary trends among retrotransposons at the genome level, and we hope our compiled data will serve as a starting point for further investigation and for comparison to other, more complex genomes.
The retrotransposons are ubiquitous components of eukaryotic genomes and have played an important role in shaping the genetic material. Like the retroviruses, retrotransposons replicate through reverse transcription of an mRNA intermediate (Boeke and Sandmeyer 1991). The cDNA product that results from reverse transcription integrates into new sites in the genome and can influence genome evolution by generating mutations in coding or transcriptional control sequences. Over time, reiterative rounds of replication can also lead to significant genome expansion. For example, the human LINE1 retrotransposons make up ∼17% of the human genome (Smit et al. 1995), and in total, retrotransposons comprise >50% of the genome of maize (SanMiguel et al. 1996). The sheer bulk of retrotransposon sequences likely has important consequences for chromosome replication, recombination, and pairing.
A pervasive group of retrotransposons are those flanked by long terminal repeats (LTRs). These LTR-retrotransposons encode proteins with homology to the Gag and Pol proteins of retroviruses (Boeke and Sandmeyer 1991). Two distinct groups of LTR-retrotransposons are found throughout eukaryotes, which are distinguished by the organization of their pol genes and similarities among their encoded reverse transcriptases (Xiong and Eickbush 1990). These groups are referred to as the Ty1–copia elements and the Ty3–gypsyelements. The genomes of most organisms harbor multiple distinct Ty1–copia and Ty3–gypsy retrotransposons. A given retrotransposon family can vary substantially in copy number among individuals or isolates, which probably reflects episodes of element amplification and extinction over the course of genome evolution.
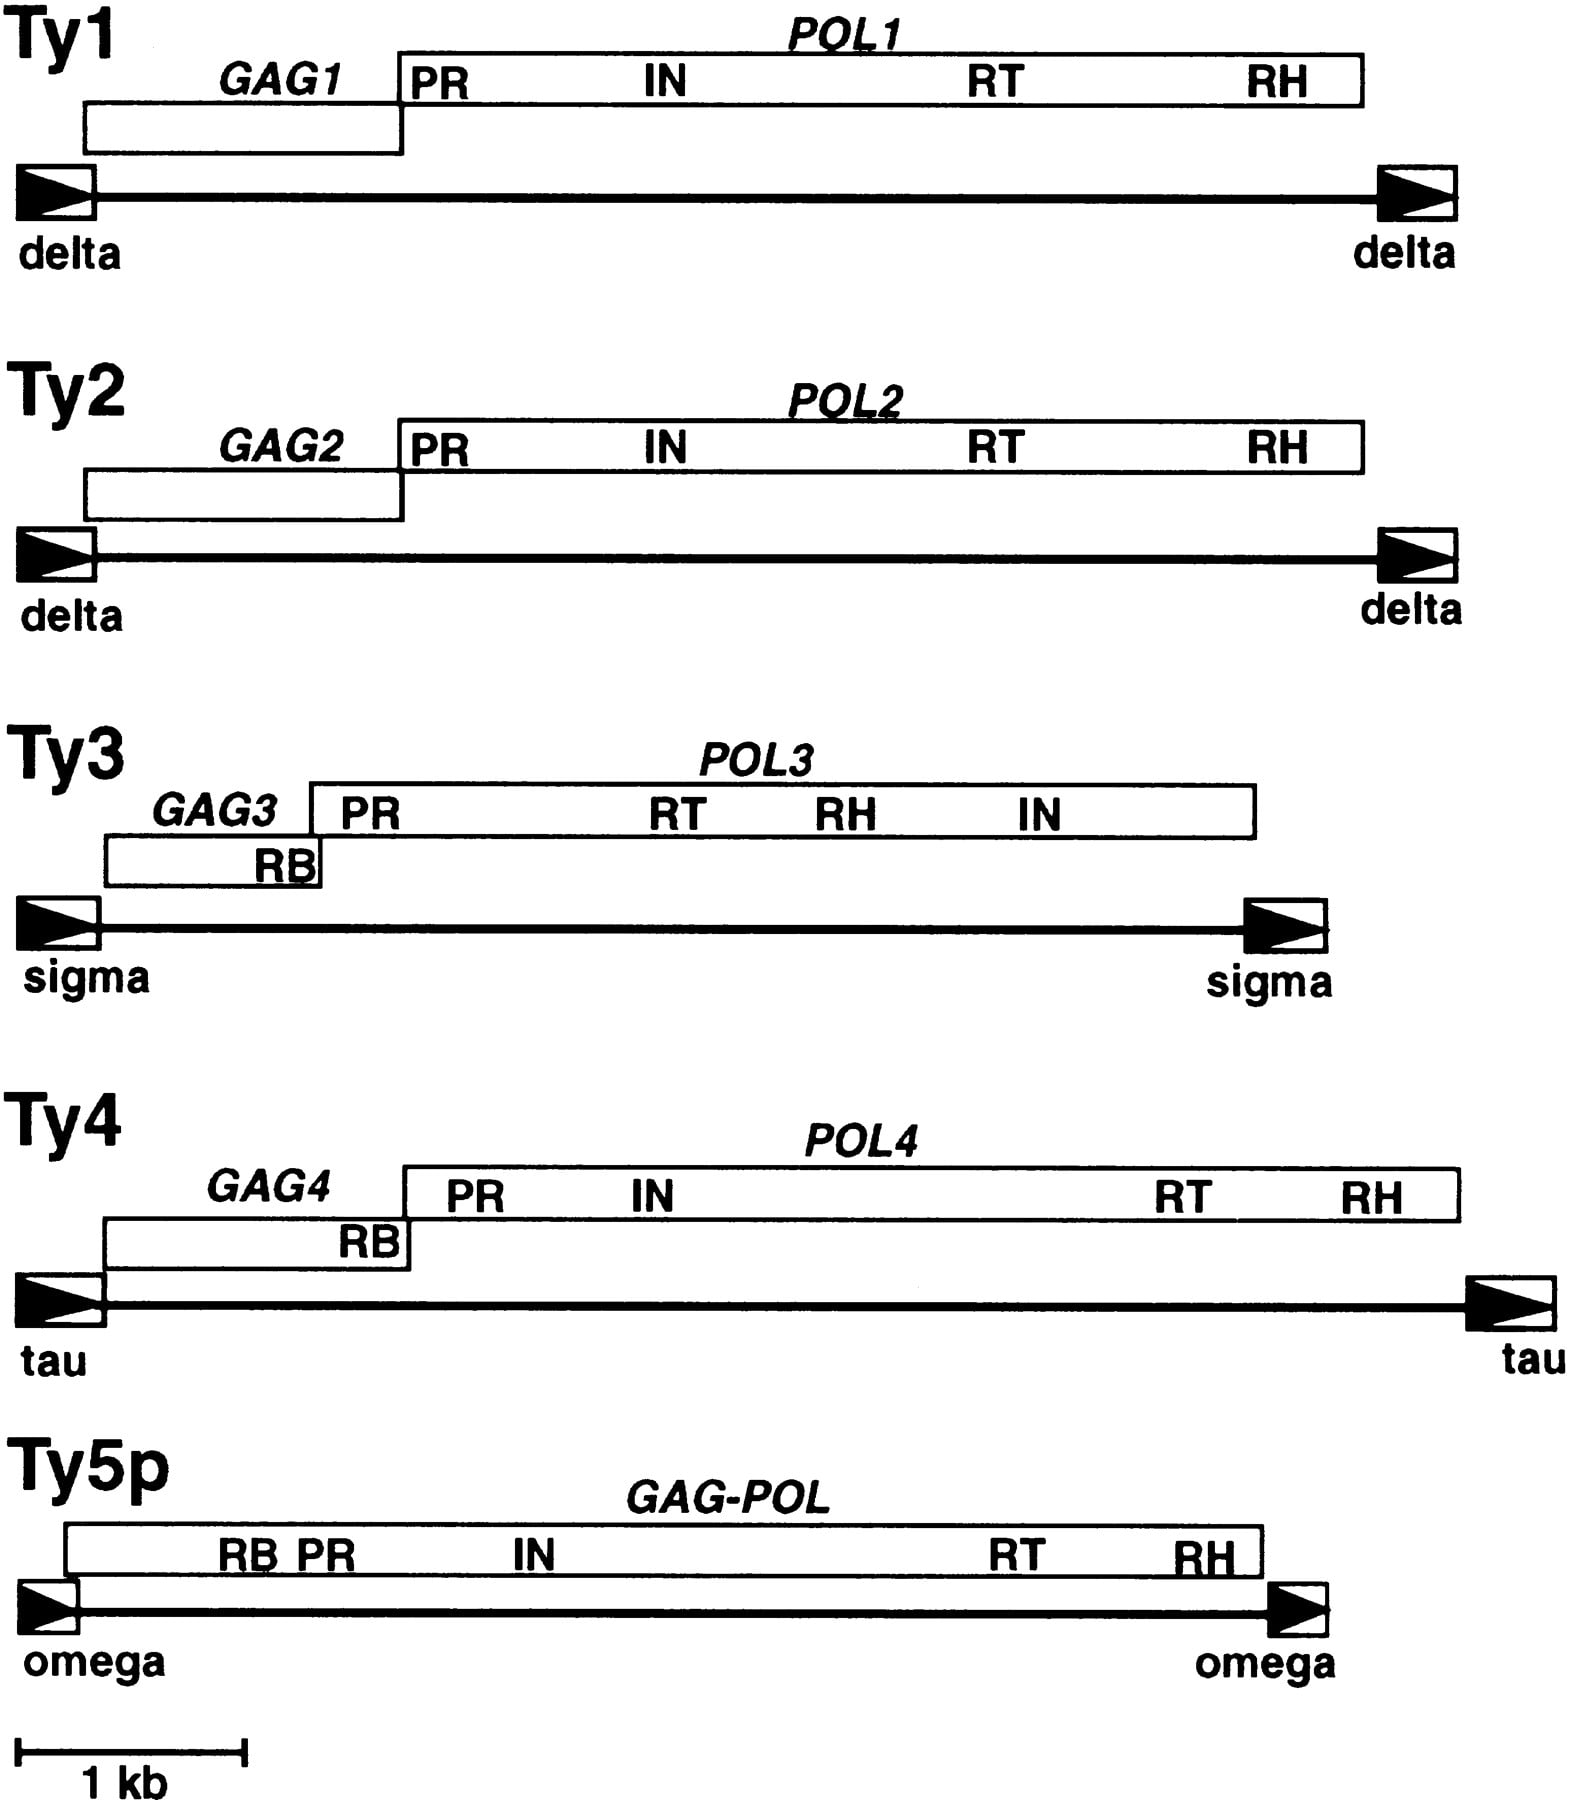
The yeast Saccharomyces cerevisiae is an important model organism used to address questions in LTR-retrotransposon biology (Boeke and Sandmeyer 1991). S. cerevisiae has five distinct retrotransposon families, designated Ty1–Ty5 (Fig.1). Ty1, Ty2, Ty4, and Ty5 are Ty1–copiagroup elements, whereas Ty3 is the sole representative of the Ty3–gypsy retrotransposons. The study of Ty elements has provided insight into the manner in which retrotransposons can influence genome organization. For example, Ty elements have been well-documented as causal agents of mutation and as mediators of genome rearrangement through recombination (Boeke and Sandmeyer 1991). In addition, the paucity of introns in S. cerevisiae genes has been ascribed to the presence of Ty elements; cDNA generated through aberrant reverse transcription of cellular mRNAs can recombine with genomic homologs resulting in intron loss (Fink 1987; Derr and Strathern 1993).
Genomic organization of the S. cerevisiae Ty elements. Open boxes with arrowheads depict LTRs, which are labeled with their Greek letter designation. Boxes between LTRs denote open reading frames, and they are offset to indicate that they are separated by a +1 frameshift. Conserved coding domains within each open reading frame are as follows: (RB) RNA binding; (PR) protease; (IN) integrase; (RT) reverse transcriptase; (RH) RNase H.
Mutations, rearrangements, and cDNA recombination, however, are rather rare consequences of Ty element replication. Experiments have shown that Ty1, Ty3, and Ty5 integrate into specific chromosomal sites. The preferred targets for Ty1 and essentially the only targets for Ty3 are regions upstream of RNA polymerase III (Pol III) transcription (Chalker and Sandmeyer 1992; Devine and Boeke 1996). It is thought that integration is directed to these sites through interactions between the retrotransposon integration complex and a component of the Pol III transcription apparatus. Ty5 prefers to integrate near telomeres, and its integration complex recognizes a component of telomeric chromatin (Zou and Voytas 1997).
The complete nucleotide sequence of the S. cerevisiae genome offers the first opportunity to comprehensively evaluate the role of retrotransposons in genome organization. In addition, evolutionary trends among all insertions of a given retrotransposon family can be comprehensively assessed for the first time. The ubiquity of retrotransposons among eukaryotes indicates that they are highly efficient genomic parasites. It is very likely that the organization and diversity of the S. cerevisiae elements will provide a general framework for understanding how these elements have adapted to life in chromosomes.
RESULTS
A Comprehensive Survey of S. cerevisiae Retrotransposons
As a basis from which to conduct studies on retrotransposon evolution and the role of retrotransposons in genome organization, we cataloged all insertions for each of the five S. cerevisiaeretrotransposon families. This end was accomplished by screening the entire genome sequence with Ty1–Ty5 LTR sequences. The query sequences used in the searches were 5′ LTRs from previously characterized, and, in the case of Ty1 and Ty3, transpositionally competent, elements. On the basis of our selection criteria (see Methods), a total of 331 insertions was identified. These insertions typically share >70% nucleotide identity to the query sequences. Most insertions (85%) are either LTR fragments or solo LTRs and are referred to by their standard Greek letter designation (δ for Ty1 and Ty2; σ for Ty3 and τ for Ty4; see Fig. 1). To maintain consistency with this nomenclature, solo Ty5 LTRs were designated as θ elements. Full-length retrotransposons with their two flanking LTRs were considered single insertions, as were LTRs segmented by another element. Each insertion was assigned a name to reflect its genomic location and orientation relative to the chromosome sequence (see Methods). A summary of our findings is presented in Table 1. A comprehensive table with information for each of the 331 Ty insertions is available at our website (http://www.public.iastate.edu/~voytas/).
Distribution of Ty Elements by Chromosome
| Chr. no. | Number of insertions[i] | Total Ty insertions on chromosome | ||||
| Ty1 | Ty2 | Ty3 | Ty4 | Ty5 | ||
| I | 6 (1) | 1 | 1 | 0 | 0 | 8 |
| II | 13 (2) | 2 (1) | 1 | 2 | 0 | 18 |
| III | 11 | 2 (1) | 0 | 1 | 2 (1) | 16 |
| IV | 20 (5) | 3 (3) | 6 | 2 | 0 | 31 |
| V | 18 (2) | 5 | 4 | 3 | 2 | 32 |
| VI | 8 | 1 (1) | 0 | 1 | 0 | 10 |
| VII | 25 (3) | 2 (2) | 6 (1) | 4 | 1 | 38 |
| VIII | 14 (1) | 1 | 3 | 3 (1) | 1 | 22 |
| IX | 5 | 1 | 2 (1) | 1 | 0 | 9 |
| X | 14 (2) | 4 | 1 | 3 (1) | 0 | 22 |
| XI | 11 | 1 | 1 | 0 | 1 | 14 |
| XII | 18 (4) | 3 (2) | 4 | 1 | 0 | 26 |
| XIII | 15 (4) | 2 | 0 | 3 | 0 | 20 |
| XIV | 5 (2) | 1 (1) | 4 | 3 | 0 | 13 |
| XV | 18 (2) | 3 (2) | 4 | 2 | 0 | 27 |
| XVI | 16 (4) | 2 | 4 | 3 (1) | 0 | 25 |
| Genome | ||||||
| total | 217 (32) | 34 (13) | 41 (2) | 32 (3) | 7 (1) | 331 |
[i] Insertions include full-length elements, solo LTRs, and LTR fragments. Numbers of full-length elements are shown in parentheses.
Ty1 and Ty2
Ty1 and Ty2 elements are closely related and show a high degree of sequence similarity. They are distinguished primarily by theirGAG sequences (40.9% amino acid sequence identity) and a hypervariable region in POL corresponding to the carboxyl terminus of integrase. The remainder of POL shares ∼90% amino acid identity. No sequence differences have been previously reported to distinguish Ty1 and Ty2 LTRs. We identified a total of 251 Ty1/Ty2 insertions with our query sequence, the 5′ LTR of the well-studied Ty1–H3 element (Table 1). Of these, 45 were full-length elements, including 32 Ty1 and 13 Ty2 insertions.
Sequence diversity and relationships among the Ty1 and Ty2 insertions were evaluated by alignment of all full-size LTRs and construction of a neighbor-joining tree (Fig. 2). Both LTRs from full-length elements were included in the alignments, and degenerate LTRs with <70% nucleotide identity to the query sequence were excluded. The final data set used for tree construction consisted of 180 LTRs representing 130 Ty1 and Ty2 insertions (72% of the total). The LTR sequences separated into seven clusters (Fig. 2). LTRs from full-length Ty2 elements fell exclusively into clusters 3 and 4. The significance of this topology was assessed by construction of a second tree with only LTR sequences from full-length elements (data not shown). The separation of Ty1 and Ty2 elements was supported among 99% of 500 bootstrap replicates of this smaller data set (Fig. 2). Analysis of the LTR sequence alignments revealed a single-base deletion common to all full-length Ty2 elements. This deletion corresponds to base 284 of the query Ty1–H3 LTR. We have designated all solo LTRs with this deletion as Ty2 LTRs. Using this LTR marker for classification and the more obvious coding sequence differences among full-length elements, we have identified a total of 217 Ty1 and 34 Ty2 insertions (Table 1).
Neighbor-joining tree of full-size Ty1 and Ty2 LTR sequences (δ elements). Clusters of related sequences are labeled. Bootstrap values (500 replicates) are provided for major branchpoints; these values were obtained from analysis of LTRs from full-length elements (see Methods). (Arrow) LTR sequences duplicated between chromosomes I and VIII (see Fig. 5).
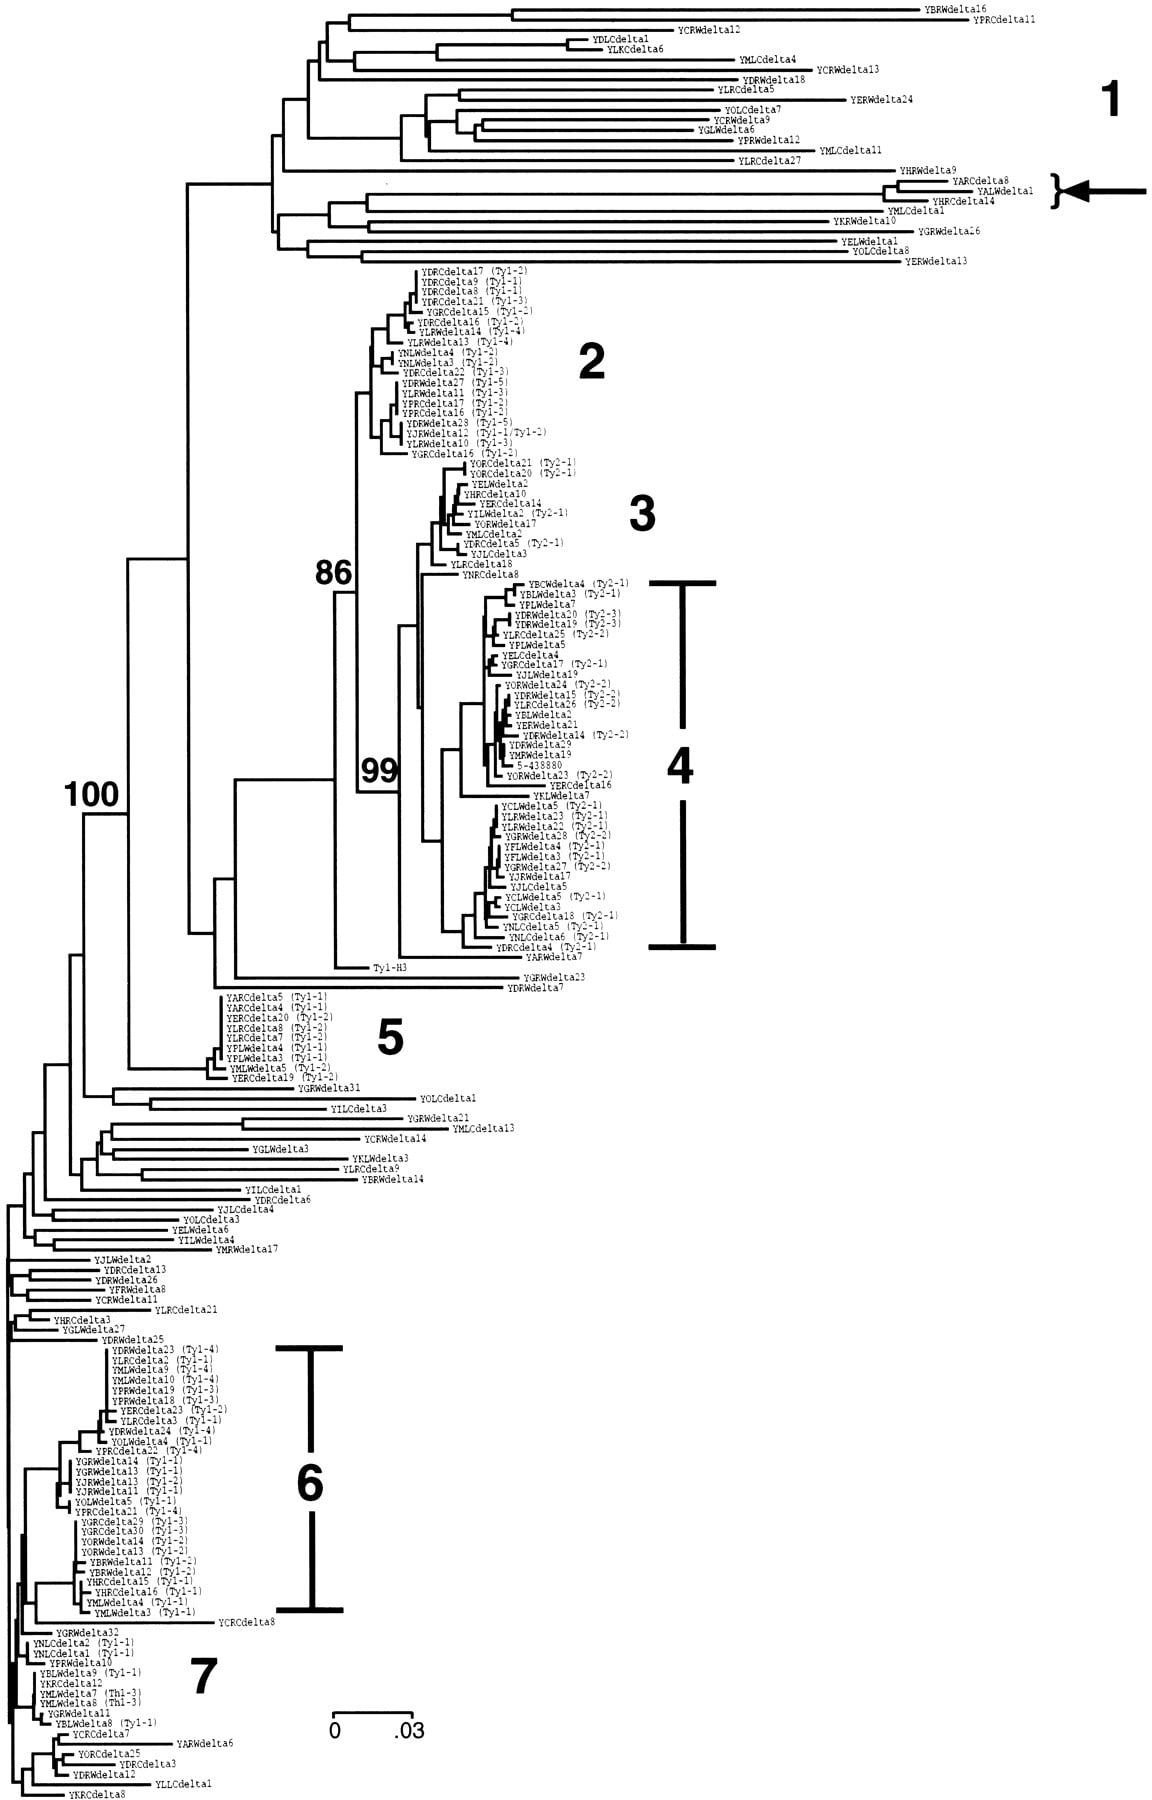
Six of the LTR sequence clusters on the tree contained LTRs from full-length elements. These LTRs typically shared >85% nucleotide identity to the query LTR. Two clusters with Ty1 elements are more closely related to the Ty2 elements (clusters 2 and 5). This separation was supported among all 500 bootstrap replicates conducted with the second data set containing only LTRs from full-length elements (Fig. 2; data not shown). A number of degenerate solo LTRs were found loosely associated with clusters 6 and 7 and are identified by their longer branch lengths. In addition, there is a separate cluster of highly degenerate LTRs associated with clusters 2–4 (cluster 1). These elements typically share from 70% to 80% identity to the reference LTR. No Ty1 element that perfectly matches the reference Ty1–H3 element is found in the complete genome sequence. This is not surprising because (1) the complete yeast genome was assembled from several related but not identical strains, and (2) Ty1–H3 was isolated as a transposition event in yet another yeast strain (JB84A, a derivative of YNN209; Boeke et al. 1985). Finally, the fact that Ty1–H3 has 6 differences between its 5′ and 3′ LTR sequences makes it likely that it is a recombinant element formed, presumably by template switching (Boeke et al. 1986), from two different parental elements (Boeke et al. 1988).
Analysis of Ty1 and Ty2 Coding Sequences: The Identification of a Ty1 Subfamily
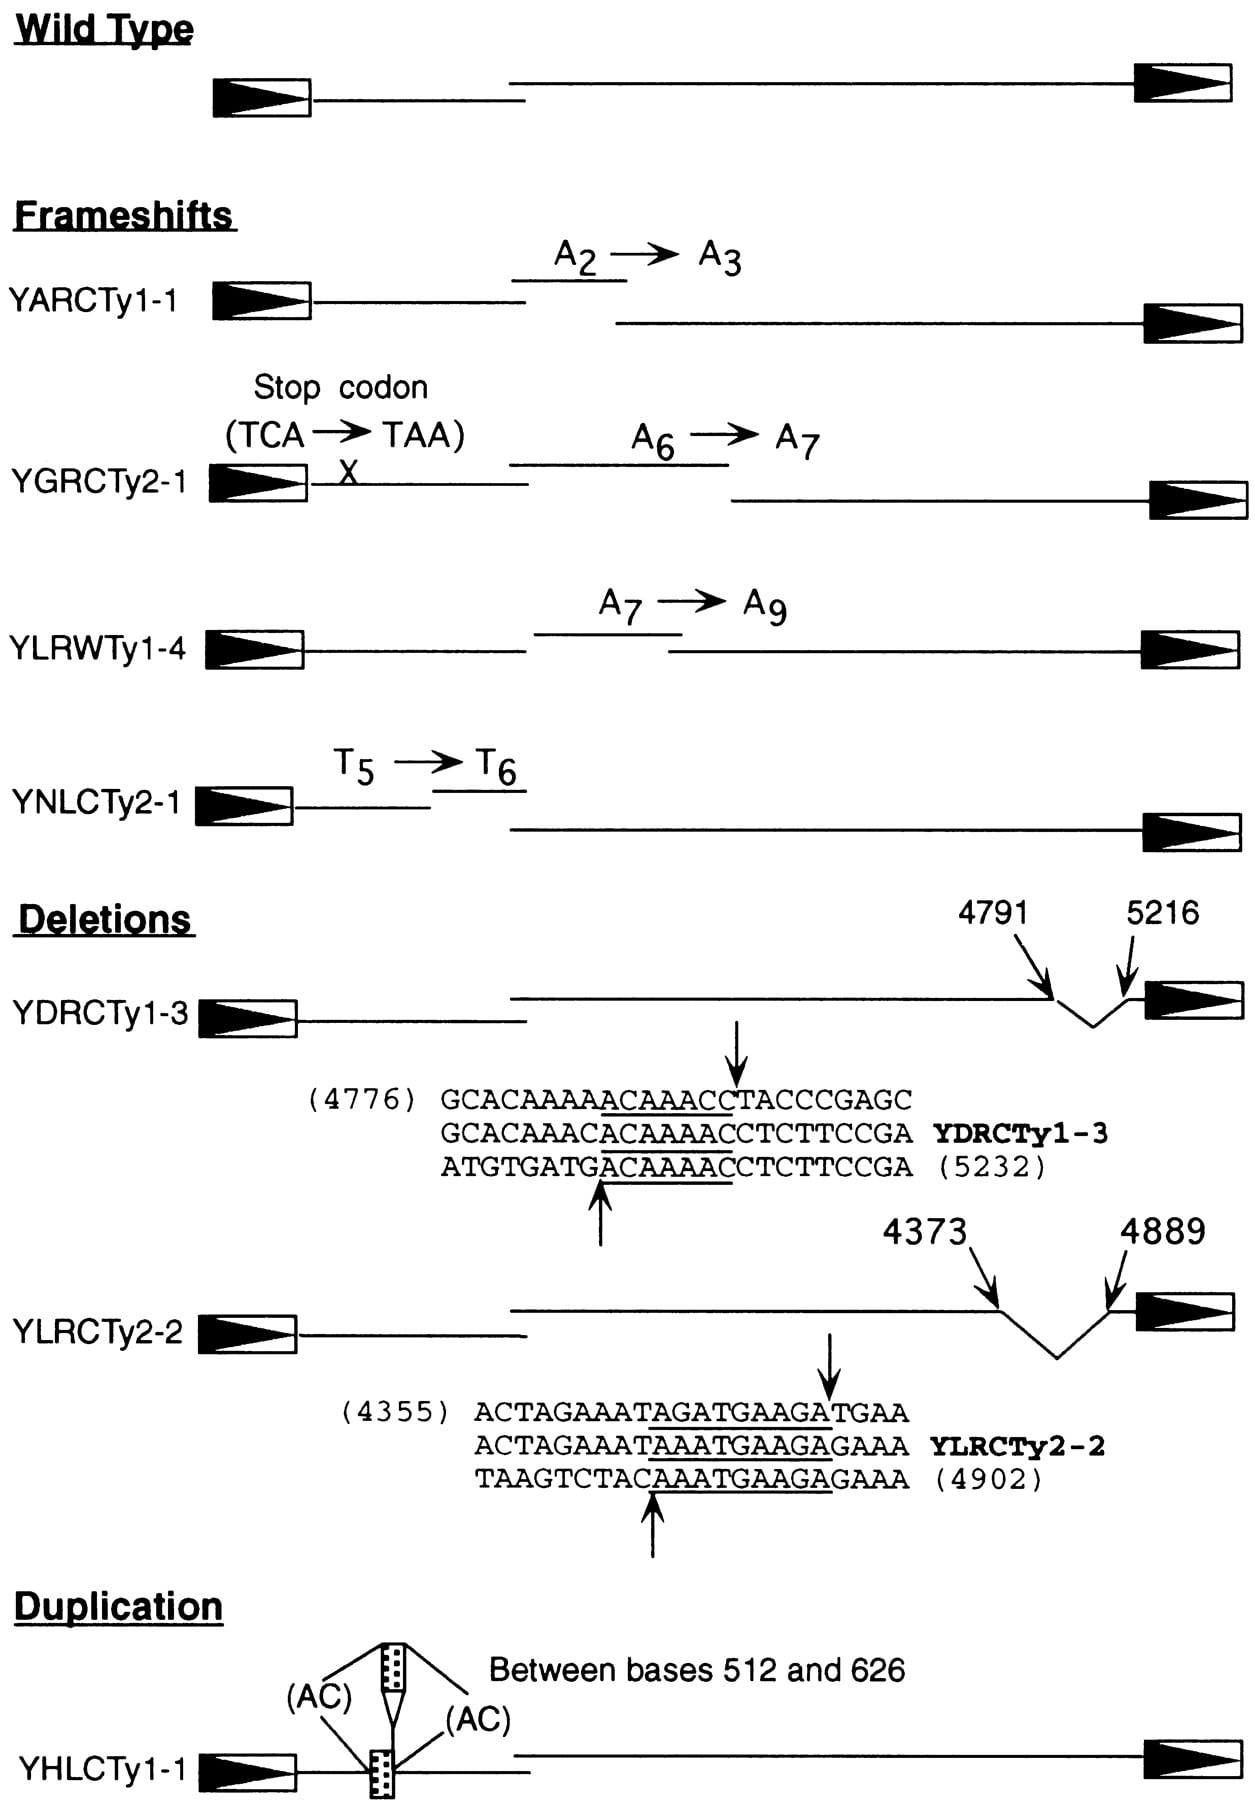
The precise coordinates for GAG and POL were determined for each full-length Ty1 and Ty2 element (data available athttp://www.public.iastate.edu/~voytas/). For 7 of the 45 full-length elements (4 Ty1 and 3 Ty2 elements), the translations revealed changes that would likely render these elements nonfunctional. As shown in Figure 3, YARCTy1-1, YGRCTy2-1, YLRWTy1-4, and YNLCTy2-1 all contain frameshift mutations caused by the addition of 1 or 2 bases within a run of the same base (2 As to 3 As, 6 As to 7 As, 7 As to 9 As, and 5 Ts to 6 Ts, respectively). YDRCTy1-3 and YLRCTy2-2 have 425- and 516-base deletions in the carboxy-terminal portion ofPOL, and YHLCTy1-1 has a duplication of 114 bases ofGAG. Each of these rearrangements has a direct repeat at the site of deletion or duplication, consistent with reverse transcriptase slippage and realignment at a distant template location or microhomology-dependent recombination events (Xu and Boeke 1987).
Mutations in full-length Ty1 and Ty2 elements. Open boxes with arrowheads depict LTRs (not drawn to scale), and lines depict theGAG and POL reading frames (drawn to scale). For the deletion mutants, sequences and numbers in parentheses below each element correspond to the full length sequences of Ty1 (YBRWTy1-2) or Ty2 (YCLWTy2-1), which sandwich the sequence present in the deleted element; underlines mark the extent of sequence duplication at the deletion break points, and arrowheads correspond to the precise position of the breaks. For the duplication mutant, stippled boxes indicate the duplicated sequences, which are flanked by the dinucleotide AC.
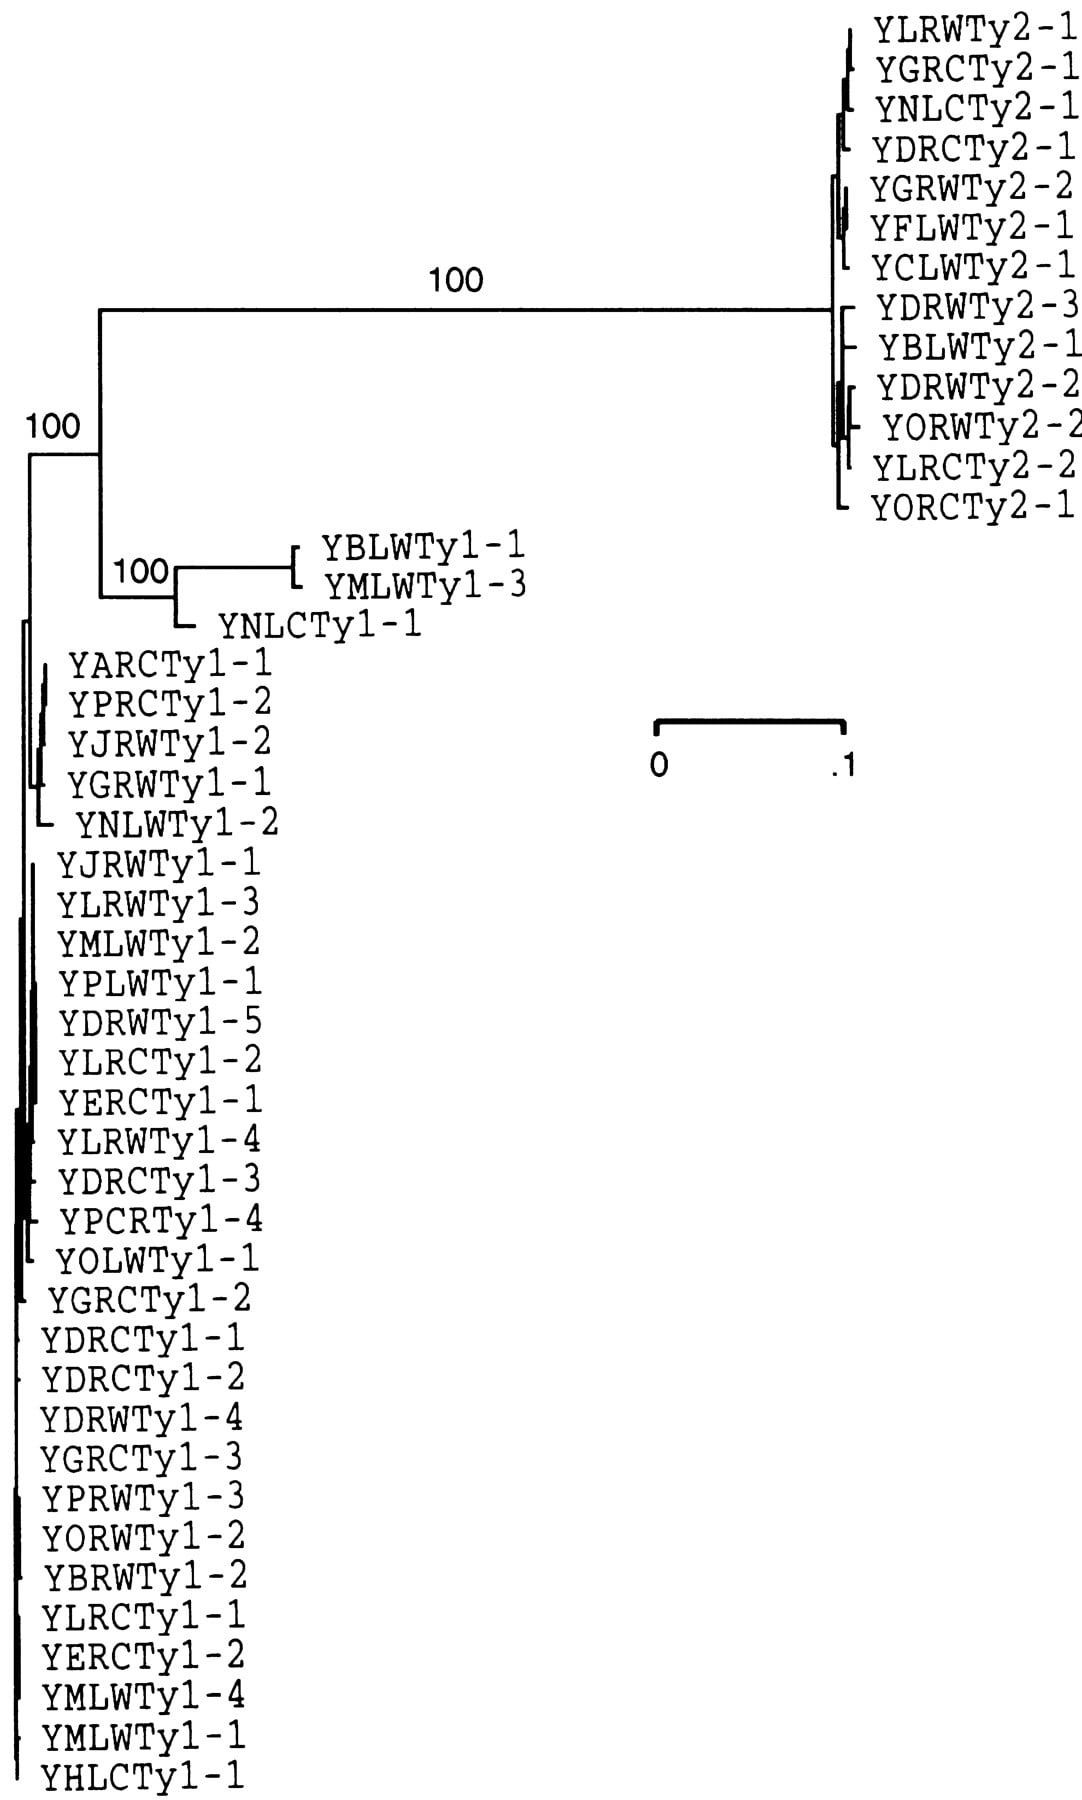
The derived GAG amino acid sequences for all 45 elements (with the duplicated region of YHLCTy1-1 eliminated), and the POLamino acid sequences for 43 elements (the 2 elements with deletions were eliminated) were aligned, and the consensus sequences were determined. For both Ty1 and Ty2, POL is more highly conserved than GAG (Table 2). Furthermore, Ty2 elements were more alike than Ty1 elements with 95.6% versus 86.1% invariant amino acids. The majority of the intrafamily amino acid sequence differences occur in GAG, and this is particularly true for the Ty1 elements, where the overall percentage of invariant amino acids for GAG was only 73.9%. Phylogenetic analysis of Ty1 GAG nucleotide sequences revealed three elements that are largely responsible for this heterogeneity (YNLCTy1-1, YBLWTy1-1, YMLWTy1-3) (Fig. 4); POL sequences did not vary substantially among these elements. If these three elements are excluded from comparisons, the percentage of invariant amino acids among all remaining GAG sequences rises to 94.1%, similar to that observed for GAG sequences among Ty2 elements (93.4%; Table 2). The GAG sequences of the divergent elements appear to have evolved independently under functional constraints. The nucleotide changes observed do not disrupt the integrity ofGAG, and in comparisons with the reference element Ty1–H3, there is a bias for synonymous over nonsynonymous substitutions (e.g., Ks/Ka = 1.825 for YBLWTy1-1). We have designated these three elements as members of a distinct Ty1 subfamily, which we call Ty1′.
Percent Identical Amino Acid Residues for Ty1 and Ty2
| Ty1 | Ty1 without Ty1‘ | Ty2 | Total | |
| GAG | 326/441 = 73.9% (32 elements) | 415/441 = 94.1% (29 elements) | 410/439 = 93.4% (13 elements) | 181/443 = 40.9% (45 elements) |
| POL | 1194/1324 = 90.2% (31 elements) | 1199/1324 = 90.6% (28 elements) | 1292/1342 = 96.3% (12 elements) | 932/1351 = 69.0% (43 elements) |
| Total coding information | (326 + 1194)/ (441 + 1324) = 86.1% | (415 + 1199)/ (441 + 1324) = 91.4% | (410 + 1292)/ (439 + 1342) = 95.6% | 1113/1794 = 62.0% |
[i] Amino acid sequences for multiple elements were aligned (the number of sequences analyzed is given in parenthesis). Percentages reflect the number of identical residues divided by the total residues.
Neighbor-joining tree of GAG nucleotide sequences from Ty1 and Ty2. Bootstrap values (1000 replicates) are provided for major branches.
Ty3, Ty4, and Ty5
In contrast with Ty1 and Ty2, very few full-length elements are present for the remaining three retrotransposon families (Table 1). There are 2 full-length Ty3 elements and 39 Ty3 solo LTRs or LTR fragments. For Ty4, there are 3 full-length elements and 29 solo LTRs. Comparisons of LTR sequences revealed considerably less sequence heterogeneity among members of the Ty3 and Ty4 families. For example, of the 28 full-size LTRs of Ty3 (representing 63% of the total insertions), 21 shared >98% nucleotide sequence identity with the reference LTR; the most divergent LTR was 85% identical. The lack of sequence diversity was also evident among the 19 full-size LTRs of Ty4 (59% of the total insertions). In this case, 17 of the LTRs shared >96% sequence identity with the reference LTR. Two LTRs, YCRCτ1 and YPRCτ3, were considerably more divergent and were 73% and 75% identical to the query sequence, respectively.
With only seven insertions, the Ty5 elements are the least abundantS. cerevisiae retrotransposon family. Only one insertion on chromosome III has internal coding sequence, and this element contains a deletion and numerous mutations that render it transpositionally inactive (Voytas and Boeke 1992). The Ty5 LTR sequences share from 80% to 95% identity to the reference LTR. A more complete description of the Ty5 elements in S288C can be found in Zou et al. (1996b).
Chromosomal Distribution of Ty Elements
In total, retrotransposon sequences make up 377 kb or 3.1% of the 12.1 Mb genome (excluding rDNA, Table 3). Chr III has the highest proportion of retrotransposon sequences (4.3%) and chr XII the lowest (0.63%). The overall density of insertions per kilobase of DNA varies less than fourfold among the different chromosomes. In general, the density is higher for the smaller chromosomes. For example, the three smallest chromosomes (I, III, and VI) have an average of one insertion per 25.2 kb. This is in contrast to the three largest chromosomes (VII, XV, and IV), which have an average of one insertion per 39.4 kb. There are several large blocks of genomic sequence that completely lack Ty or LTR insertions, including a 434-kb region on the left arm of chr IV and a 416-kb region on chromosome XIV. Also, because the rDNA repeats were not sequenced, the number of Ty elements in this region could not be ascertained.
Chromosomal Organization of Ty Elements
| Chr. no. | Chr. size (kb)[i] | Total Ty insertions on chr.[ii] | Total Ty sequences (kb) | Percent of Ty sequences on chr. | Insertion density (/kb) | Total tRNA gene no. | Insertion density (/tRNA)[iii] |
| I | 230 | 8 | 7.9 | 3.4 | 28.8 | 4 | 2.0 |
| II | 813 | 18 | 21.9 | 2.7 | 45.2 | 14 | 1.3 |
| III | 315 | 16 | 13.4 | 4.3 | 19.7 | 10 | 1.4 |
| IV | 1,522 | 31 | 54.2 | 3.6 | 49.1 | 28 | 1.1 |
| V | 575 | 32 | 20.3 | 3.5 | 18.0 | 20 | 1.5 |
| VI | 270 | 10 | 8.3 | 3.1 | 27.0 | 10 | 1.0 |
| VII | 1,091 | 38 | 43.9 | 4.0 | 28.7 | 36 | 1.0 |
| VIII | 563 | 22 | 17.3 | 3.1 | 25.6 | 11 | 1.9 |
| IX | 440 | 9 | 7.7 | 1.8 | 48.9 | 10 | 0.9 |
| X | 745 | 22 | 22.8 | 3.1 | 33.9 | 24 | 0.9 |
| XI | 666 | 14 | 4.2 | 0.63 | 47.6 | 16 | 0.8 |
| XII | 1,078 | 26 | 40.5 | 3.8 | 41.5 | 21 | 1.2 |
| XIII | 924 | 20 | 28.3 | 3.1 | 46.2 | 21 | 1.0 |
| XIV | 784 | 13 | 20.5 | 2.6 | 60.3 | 14 | 0.9 |
| XV | 1,091 | 27 | 30.2 | 2.8 | 40.4 | 20 | 1.4 |
| XVI | 948 | 25 | 35.6 | 3.8 | 37.9 | 17 | 1.5 |
| Average | 753 | 21 | 23.6 | 3.1 | 37.4 | 17 | 1.2 |
| Genome | |||||||
| total | 12,055 | 331 | 377.0 | N.A. | N.A. | 274 | N.A. |
[i] Excluding unsequenced repeat sequences (e.g., rDNA).
[ii] Insertions include full-length elements, solo LTRs, and LTR fragments (values from Table 1).
[iii] Ty5 insertions are not included in the calculation.
A Target Bias for Ty Insertions
Ty1 and Ty3 preferentially integrate near tRNA genes or other genes transcribed by RNA Pol III (Chalker and Sandmeyer 1992; Devine and Boeke 1996). This target site preference is likely mediated by interactions between the integration complex and some factor associated with sites of Pol III transcription. Targeted integration by Ty3 is precise, and typically occurs within 2 bases of the start of Pol III transcription (Chalker and Sandmeyer 1992). Ty1, on the other hand, has a more regional target preference, and inserts within an ∼1 kb window upstream of target genes (Devine and Boeke 1996).
How strongly is target bias reflected in the genomic organization of endogenous Ty elements? To address this question, the location of all Ty insertions was determined relative to the complete set of tRNA genes encoded by S. cerevisiae (data available athttp://www.public.iastate.edu/~voytas/). Insertions were considered tRNA-associated if they were located within 750 bases of a tRNA gene, excluding intervening retrotransposon sequences. For each of the exceptions, ∼2 kb of flanking sequence was scanned for the presence of other genes known to be transcribed by RNA Pol III (class III genes). Three insertions were identified within 750 bases of such genes: A Ty4 insertion near RPR1 (RNase P RNA), a Ty1 insertion near SNR6 (U6 snRNA), and a Ty1 insertion nearRNA9 (5S rRNA).
Our mapping efforts revealed a striking target bias for endogenous Ty insertions: 90% of Ty1 (196/217 insertions), 82% of Ty2 (28/34 insertions), 95% of Ty3 (39/41 insertions), and 88% of Ty4 elements (30/32 insertions) are associated with class III genes. All but four elements were located in flanking upstream sequences. No other pattern of insertions could be discerned relative to other chromosomal features such as centromeres or telomeres. The distribution of tRNA genes, therefore, is the overriding factor in determining the chromosomal distribution of Ty1–Ty4 elements; 293 of the 324 insertions are associated with tRNA genes. In total, 66% of the tRNA genes have associated retrotransposon insertions, and, although some tRNAs are particular hotspots for integration, there is no apparent bias for particular tRNA genes or gene families (data not shown). The density of insertions per tRNA gene on a per chromosome basis ranges from 0.9 to 2.0 with an average of 1.2 (Table 3).
Unlike Ty1–Ty4, Ty5 elements are not associated with class III genes. Rather, Ty5 preferentially integrates near regions of silent chromatin at the telomeres and the HM mating loci (Zou et al. 1996a). The distribution of Ty5 elements in the genome is consistent with this target preference, and details regarding the genomic organization of Ty5 are presented elsewhere (Zou et al. 1996b).
Ty Target Site Consensus Sequences
Most LTR retrotransposons generate 5-bp target site duplications upon integration. A total of 118 Ty1–Ty4 LTRs (36% of the total) were flanked by perfect 5-bp target duplications, as were all but 3 of the 50 full-length Ty elements (two of these had a deletion in one LTR). These sequences were used to derive a target site consensus sequence (Table 4). A slight bias was found for A and T in the first and fifth positions, respectively. A much stronger bias was observed for an A or T in the internal three positions. Individual Ty families showed essentially the same sequence bias, and there were no obvious differences in target site consensus sequences between targeted (i.e., tRNA gene associated) and nontargeted insertions (data not shown). Of the insertions without target site duplications, most were partially deleted LTRs. In addition, recombination may have resulted in exchange of target site sequences between elements, or target duplications may have been eroded over time by the accumulation of mutations. None of the Ty5 LTRs had target site duplications, suggesting frequent recombination between these elements at the telomeres (Zou et al. 1996b).
Target Site Consensus Sequence
| Position (%) | |||||
| 1 | 2 | 3 | 4 | 5 | |
| A | 38 | 47 | 49 | 41 | 20 |
| T | 21 | 34 | 36 | 36 | 34 |
| G | 24 | 11 | 8 | 10 | 20 |
| C | 17 | 8 | 7 | 12 | 27 |
| Consensus | N | A/T | A/T | A/T | N |
[i] (n) 118.
Ty Elements and Genome Rearrangements
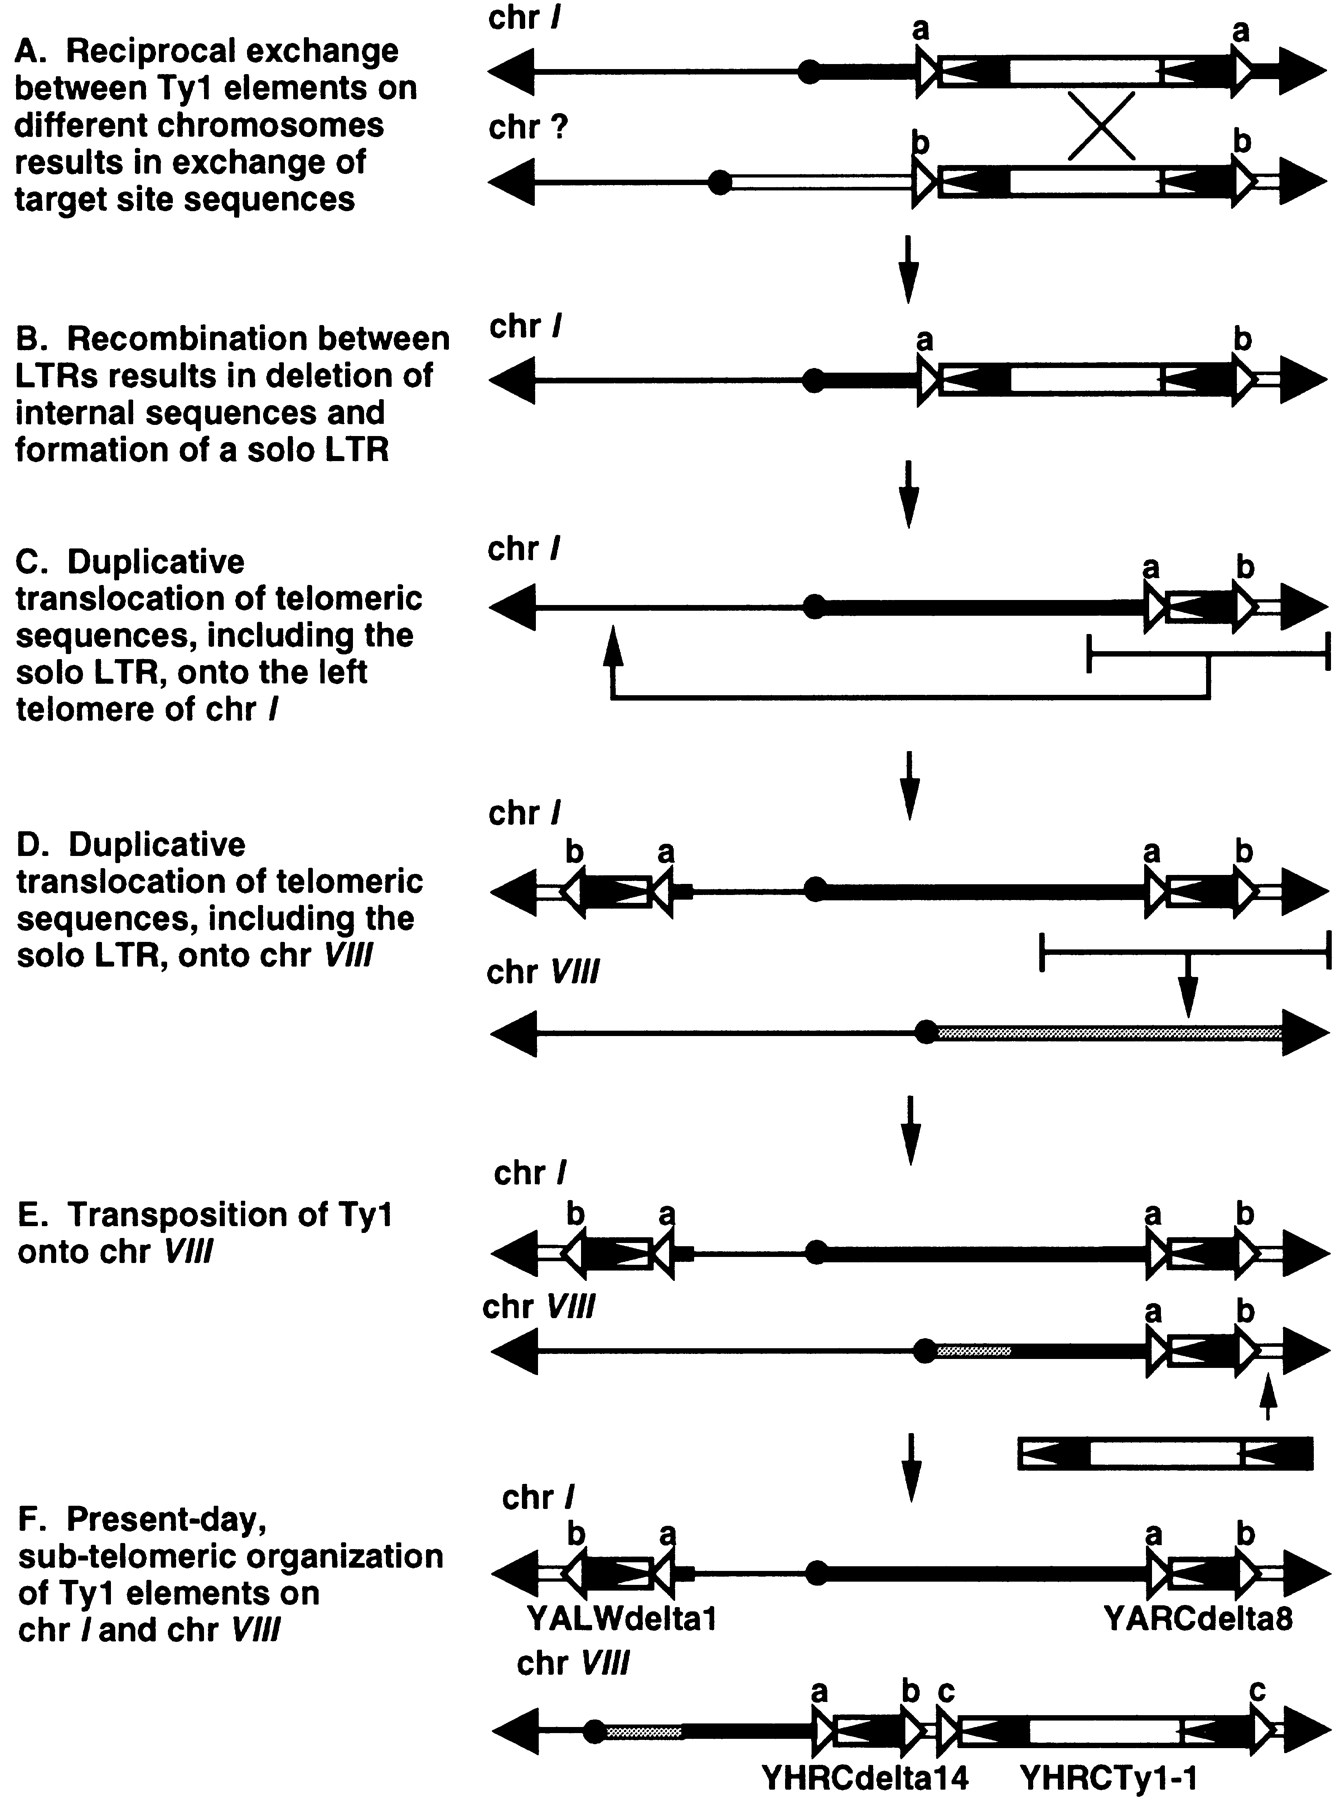
Some Ty elements mark sites of sequence duplication and rearrangement. This is particularly true for elements not associated with class III genes, suggesting that their location in the genome is the consequence of rearrangements that have occurred subsequent to integration. Many of these elements are telomeric and have been duplicated on multiple chromosomes. One such example is the subtelomeric insertions shared between chromosome I and chromosome VIII (Fig. 5). A Ty1 insertion is found near the right telomere of chromosome I. This LTR appears to be the product of an ancient reciprocal translocation between two different insertions, because it has different 5′ and 3′ target site sequences (Fig.5A). At some point in the history of this element, recombination between the LTRs resulted in loss of internal coding sequences, leaving behind a solo LTR (Fig. 5B). This element and its flanking sequences were duplicated to the chromosome I left telomere (Fig. 5C). The element on the right arm of chromosome I, including an additional 25 kb of chromosome I sequence, was also duplicated onto the right arm of chromosome VIII (Fig. 5D). Subsequent to this event, an independent Ty1 element inserted on chromosome VIII, ∼12 kb telomere–proximal to the solo Ty1 LTR (Fig. 5E). The Ty1/Ty2 neighbor-joining tree supports the close relationship among the duplicated solo LTRs (see arrow on Fig. 2). The LTRs on chromosome I are most closely related to each other and cluster with the solo LTR on chromosome VIII.
Proposed sequence of events leading to present-day Ty1 elements in the subtelomeric regions of chromosomes I and VIII (I andVIII, respectively). (Black arrowheads) Telomeres; (black circles) centromeres. Chromosome sequences left of the centromere are depicted as thin lines. Chromosome sequences right of the centromere are depicted as a narrow black box for chromosome I, a narrow gray box for chromosome VIII, and a narrow white box for the chromosome involved in a reciprocal exchange with chromosome I. Open arrowheads labeleda, b, or c indicate target-site sequences.
Another example of a recombination event involving Ty1 elements is a tandem Ty1 element found on chromosome X (Fig. 6A). This locus consists of two Ty1 internal domains and three LTRs, one of which abuts both coding regions. The sequences of the outer LTRs are identical and are 88.9% identical to the query sequence; the internal LTR is 97.6% identical to the query LTR. Target site duplications directly flank the outer LTRs. We hypothesize that the outer LTRs and one of the internal domains are from a Ty1 insertion that occurred at this site. The tandem element could have arisen by recombination of a one-LTR circle with this pre-existing element. One-LTR circles are frequently the products of recombination between direct repeats of full-length elements that give rise to solo LTRs. It is interesting to note that these elements are found 33.8 kb from the nearest known class III gene.
Adjacent Ty insertions. (A) We propose that a circular Ty1 element, a product of LTR–LTR recombination, recombined with an insertion on chromosome X (chr X) to generate two tandem elements. Open triangles indicate duplicated target-site sequences. Percentages reflect nucleotide sequence identity between LTRs. (B) Convergently arranged Ty1 and Ty2 elements. Chromosome location and target-site sequences are shown. The numbers indicate the base pairs between elements. (C) An example of a compound insertion on chromosome X (see also Table 5).
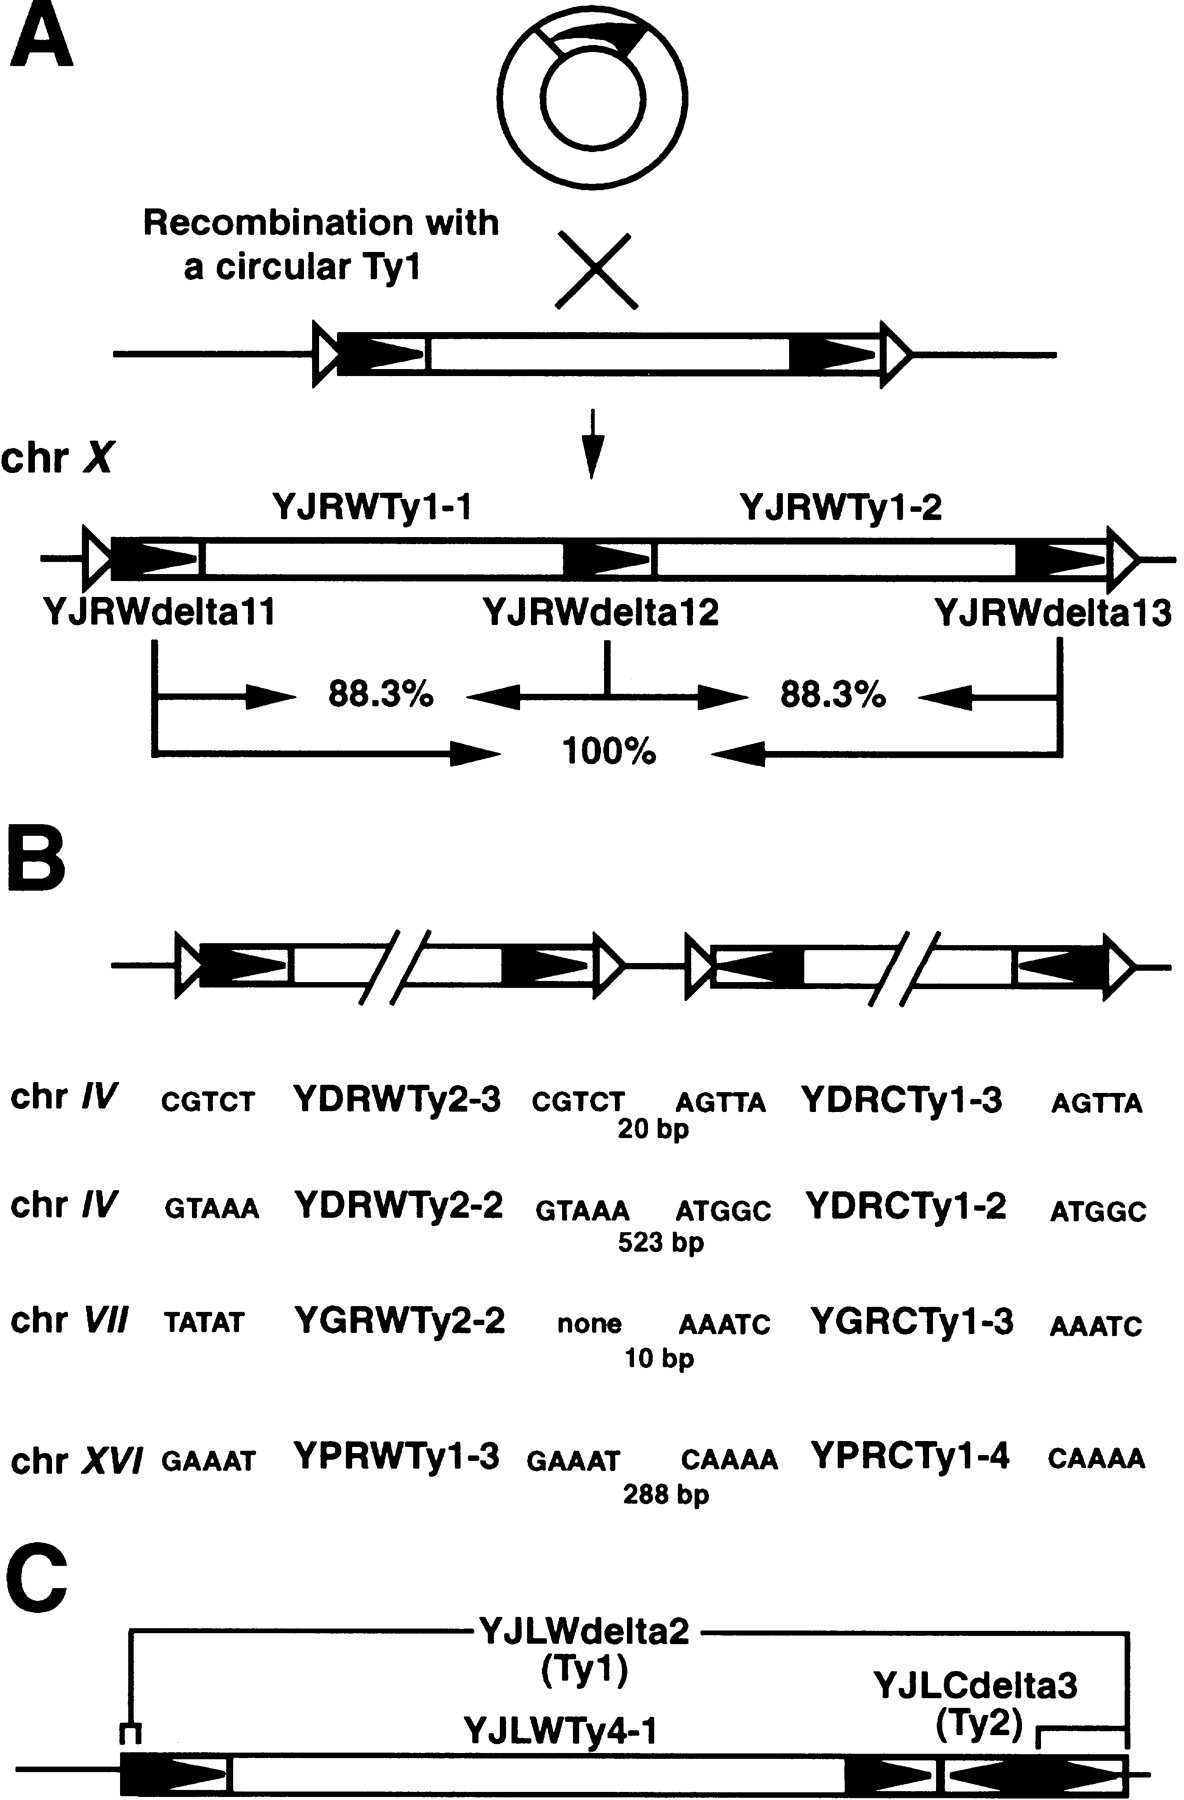
Four unusual pairs of Ty elements were observed in the genome (Fig.6B). In each case, two elements were inserted very close together (10–523 bp apart) in opposite orientation. These inverted Ty pairs are located on chromosomes IV, VII, and XVI. Seven of the eight Ty elements involved contain flanking target-site duplications, indicating they are relatively recent transposition events; the eighth contains a truncation at its 3′ end. Three of the inverted pairs consist of a Ty1 element and a Ty2 element and the fourth consists of two closely related Ty1 elements. Presumably the latter has the highest potential for genetic instability, and it will be interesting to determine just how stable these rather large intrachromosomal inverted repeats are in yeast chromosomes.
Another type of potential genetic instability is presented by compound insertions—retrotransposons that have inserted within other retrotransposons (Fig. 6C). Such insertions may be particularly unstable if members of the same family are involved because of sequence homology. In support of this, only 2 of the 16 compound insertions in the genome include members of the same retrotransposon family (Table5). Also, 7 of the 16 compound insertions contain 1 full-length element, and none contains more than 1 full-length insertion, suggesting that such structures are lost through recombination. A particularly striking observation is that 10 of the 16 compound insertions involve Ty1 and Ty2 elements, and for 9 of these 10, the Ty2 element is inserted within a Ty1. This bias may result if Ty2 target preference is modulated or influenced by Ty1 sequences. Alternatively, Ty1 and Ty2 compound insertions may be stabilized if recombination is suppressed. In support of this hypothesis, we uncovered no indication of recombination between Ty1 and Ty2 elements from analyses of full-length element sequences (data not shown). Ty1 and Ty2 share sufficient sequence identity to serve as effective recombination substrates, so it will be interesting to determine if in fact they are recombinationally isolated. Such mechanisms would likely influence independent evolution and retrotransposon speciation.
Compound Insertions
| Chr. | Internal element(s) | External element(s) | Orientation[i] |
| II | YBLWδ2 (Ty2) | YBLWδ1 (Ty1) | T |
| III | YCLWδ3 (Ty2) | YCLWδ2 (Ty1) | T |
| IV | YDRWδ7 (Ty2) | YDRWδ6 (Ty1) | T |
| IV | YDRCTy1-1 | YDRCς1 | T |
| IV | YDRWTy2-1 | YDRCδ13 (Ty1) | I |
| IV | YDRWδ26 (Ty1) | YDRCς6 | I |
| V | YELWδ2 (Ty2) | YELWδ1 (Ty1) | T |
| V | YERCτ2 | YERWδ13 (Ty1) | I |
| V | YERCTy1-1 | YERWδ18 (Ty2) | I |
| V | YERCTy1-2 | YERCς4 (Ty3) | T |
| VI | YFLWTy2-1 | YFLWδ2 (Ty1) | T |
| X | YJLCδ3 (Ty2) | YJLWδ2 (Ty1) | I |
| YJLWTy4-1 | |||
| X | YJLCδ5 (Ty2) | YJLCδ4 (Ty1) | T |
| XV | YORCTy2-1 | YORWτ2 | I |
| XVI | YPLWδ5 (Ty2) | YPLWδ2 (Ty1) | T |
| YPLWTy1-1 | |||
| XVI | YPLCδ9 (Ty1) | YPLWδ8 (Ty1) | I |
[i] (T) Tandem; (I) inverted.
DISCUSSION
Retrotransposon Diversity and Evolution
The S. cerevisiae genome contains representatives of the two major lineages of eukaryotic LTR retrotransposons, including four Ty1–copia group elements (Ty1, Ty2, Ty4, and Ty5) and one Ty3–gypsy retrotransposon (Ty3). The relative success of these element families in colonizing the S. cerevisiae genome varies dramatically. Copy numbers range from 271 Ty1 elements to 7 Ty5 insertions (all of which are nonfunctional). S. cerevisiaeretrotransposon populations, therefore, are dynamic; some element families amplify and proliferate, whereas others become extinct and are gradually eroded away by mutations. This latter phenomenon may explain the lack of evidence in the genome sequence for non-LTR-retrotransposons or any of the classes of transposable elements that replicate through DNA intermediates.
Replication by reverse transcription is highly error prone, and retrotransposons are thought to evolve at rates far greater than cellular genes (Gabriel et al. 1996). Recombination, which is particularly robust in S. cerevisiae, can homogenize sequences and work against rapid evolution and retrotransposon speciation. We found abundant examples of recombination among Ty1 elements, such as LTRs of full-length elements that share more sequence identity to other insertions than to their companion LTR and the absence of target site duplications for many insertions. The lack of congruence in topologies of trees constructed with LTR and coding sequences further indicates the prevalence of recombination. Nonetheless, some Ty1 elements have begun to evolve in new directions, as evidenced by our identification of a unique Ty1 subfamily (Ty1′). Elements within this subfamily have a bias for synonymous over nonsynonymous substitutions within their GAG coding sequences, indicating that they have evolved under functional constraints. This observation suggests that recombination, although an important homogenizing force, is not so rampant that it prevents the formation and persistence of new element families.
In many ways, the Ty2 elements can be viewed as another, more distantly related, Ty1 subfamily. Ty1 and Ty2 share virtually identical LTRs and ∼90% amino acid identity between their POL genes. Although there is sufficient sequence homology between Ty1 and Ty2 elements to allow for recombination, such events appear to be rare. For example, in our alignments of LTR sequences, we identified a single-base deletion that distinguishes Ty2 from Ty1 LTRs. The persistence of this marker suggests recombination between Ty1 and Ty2 is uncommon. Furthermore, the vast majority of both compound elements and convergently organized elements include a Ty1 and Ty2 insertion, suggesting that these inherently unstable structures can persist because they are made up of elements from two different families. Suppression of recombination between Ty1 and Ty2 elements could be tested experimentally to determine whether it isolates these two element families.
Other mechanisms must also be considered to explain the present-day diversity of S. cerevisiae retrotransposons. Among these are horizontal gene exchange between species and episodes of polyploidization. The latter is particularly attractive in light of the recent evidence that S. cerevisiae has undergone polyploidization during its evolutionary history (Wolfe and Shields 1997). In such a scenario, Ty1, Ty1′, and Ty2 elements would have evolved independently under functional constraints in separate species. There is some support for this, in that species such asSaccharomyces norbensis have Ty2 but no Ty1 elements (Fink et al. 1986). Since polyploidization, the retrotransposons would have maintained their identity, although rare exchanges through recombination may be responsible for the present-day similarities in Ty1 and Ty2 LTR and coding sequences.
The range of nucleotide sequence diversity observed among elements within a given Ty family offers additional support for horizontal transfer or the acquisition of retrotransposons through polyploidization. With the exception of LTRs from full-length elements, the majority of Ty1 LTR sequences are highly divergent and many have been fractured by deletion. In fact, we set an arbitrary cutoff in our sequence searches to avoid including many small and highly divergent Ty1 LTRs. Ty5 sequences are similarly heterogeneous, and this family is extinct in S. cerevisiae because no full-length Ty5 elements are present. The range of sequence diversity among Ty1 and Ty5 insertions suggests that these two families have long been present in the S. cerevisiae genome. In contrast, Ty3 and Ty4 LTRs are much more conserved, and there is a paucity of highly divergent or deleted LTRs. This conservation suggests that Ty3 and Ty4 may be relatively recent additions to the genome. An alternative possibility, which cannot be excluded, is that Ty3 and Ty4 elements are more recombinogenic, and that frequent episodes of gene conversion have contributed heavily to their homogenization.
Ty Target Bias
The vast majority (293/324 or 90.4%) of all Ty1–Ty4 elements are associated with tRNA genes (290/324) or other class III genes (3/324). The 750-base window adjacent to tRNA genes in which 90% of the elements are located accounts for only ∼2% of the yeast genome. Element distribution, therefore, is clearly nonrandom. Ty1 and Ty3 preferentially integrate near class III genes, likely because of interactions between their integration complexes and the Pol III transcription machinery (Chalker and Sandmeyer 1992; Devine and Boeke 1996). Although Ty4 has not been shown experimentally to integrate near tRNA genes, 30/32 insertions are within 750 bases upstream of tRNA genes, suggesting that these elements utilize a similar targeting mechanism. At least one member of each of the 20 tRNA gene families has associated Ty insertions, although not every tRNA gene has served as a target. In addition, some tRNA genes are integration hotspots. Highly preferred tRNA gene targets have also been observed for de novo Ty1 transposition events (Ji et al. 1993). This observation suggests that features other than the Pol III transcription machinery (e.g., chromatin) may play a role in target preference. It should be noted that all endogenous Ty5 insertions are considered exceptions to class III gene targeting. These elements map to the telomeres or theHM loci, in agreement with experimental observations indicating a preference to integrate into regions of telomeric chromatin (Zou et al. 1996a,b; Zou and Voytas 1997). Upstream regions of tRNA genes and the telomeres are typically devoid of coding information, and targeted transposition may have evolved to prevent deleterious mutations. Targeting, therefore, could be viewed as a mechanism that allows retrotransposons to persist in the genome.
We looked for other patterns in the distribution of Ty element insertions to determine whether additional factors influence target choice. Small chromosomes were found to have a slightly higher insertion density, and it has been argued that small chromosomes collect extra sequences to maximize their stability during replication and segregation (Bussey et al. 1995). No other obvious trends were observed (e.g., correlations with centromeres or telomeres), suggesting that targeting to class III genes is the primary determinant of retrotransposon distribution.
Increasingly, retrotransposons that engage in target site selection are being identified in other organisms. For example, two retrotransposons are associated with tRNA genes in Dictyostelium discoideum(Marschalek et al. 1989, 1990). In Drosophila melanogaster,the HeT-A and TART elements transpose to chromosome ends and serve as telomeres (Biessmann et al. 1990; Levis et al. 1993), and telomeric retrotransposons have also been observed in the blue-green algaChlorella (Higashiyama et al. 1997). Recognition of specific DNA sequences directs integration of the R1 and R2 elements of insects and the TRAS1 and SART1 elements of Bombyx mori to the rDNA and telomeres, respectively (Jakubczak et al. 1991; Okazaki et al. 1995; Takahashi et al. 1997). As the genome projects progress, it will be possible to evaluate other genomes for patterns suggestive of transposable element target bias and thereby ascertain how widespread targeting mechanisms are utilized by transposable elements.
Only a small percentage of the Ty1–Ty4 insertions were considered nontargeted on the basis of our rather strict requirement for location within 750 bases of the nearest class III gene. Notably, there are two nontargeted Ty3 insertions, one ∼1 kb from a tRNA gene on chr XV, and another >5 kb from the nearest known class III gene on chromosome IV. Ty3 has a strong preference to integrate within 2 bases of the start of class III gene transcription. Although no obvious Pol III promoter sequence elements flank the chromosome IV insertion, this element and other Ty1–Ty4 targeting exceptions may mark yet uncharacterized class III genes. It is interesting to note that several Ty1 targeting exceptions are associated with subtelomeric regions, and one element is associated with the HMR-E silencer that assembles telomeric chromatin. This distribution is similar to that observed for Ty5, suggesting that there may be some common features of these targets or shared mechanisms by which they are recognized. The telomeric location for some Ty1 insertions, however, likely reflects episodes of past recombination (see below). Such recombination events may have masked features at their original integration sites.
Although global targeting patterns may be determined by sites of Pol III transcription or telomeric chromatin, local sequence features also influence target site selection. We observed a strong bias for A or T in the internal 3 bases of the 5-bp target site for Ty1–Ty4 insertions. Others have previously observed a similar bias for in vivo and in vitro Ty1 transposition events (Ji et al. 1993; Rinckel and Garfinkel 1996). Although none of the endogenous Ty5 elements has target sequence duplications, examination of target sites from experimentally induced transposition events identified essentially the same sequence bias (Zou et al. 1996b). The internal A,T bases may facilitate DNA bending, thereby allowing access to the catalytic residues of integrase (Pruss et al. 1994a,b).
Ty Elements and Genome Rearrangements
Ty elements may serve as substrates for recombination resulting in genome rearrangement. Many insertions were found near sequences that have been duplicated among multiple chromosomes, particularly at the telomeres. We reconstructed a plausible scenario for the history of telomeric Ty1 insertions on chromosomes I and VIII, on the basis of target-site sequences, duplicated flanking DNAs, and sequence similarity between insertions. The recombination, duplication, and transposition events that led to the present day chromosomal organization of these elements speaks to the significance of transposition and recombination as forces for genome change.
It is apparent from our survey of S. cerevisiaeretrotransposons that targeting mechanisms determine sites of Ty element integration. Thus targeting can influence genome organization directly. Subsequent to integration, recombination between elements further restructures the genome. Although our survey has provided insight into the ways retrotransposons can influence genome organization, comparative study with other yeast strains or related species will further offer insight into how transposition and recombination have rearranged chromosomes over time. Such comparative analyses will also make it possible to more directly evaluate factors that influence retrotransposon evolution. We hope that our compilation of S. cerevisiae retrotransposon sequences will serve as an important reference to address these and further questions in Ty element biology as well as the biology of other eukaryotic retrotransposons.
METHODS
Identification of Ty Insertions
Full chromosome sequences were obtained from the SaccharomycesGenome Database (http://genome-www.stanford.edu/Saccharomyces/). Large chromosome sequences were segmented and formatted for use with software from the Genetics Computer Group (GCG) (Devereux et al. 1984). Each chromosome or chromosome fragment was searched with the following Ty1–Ty5 LTR query sequences: Ty1 and Ty2, the 5′ LTR of Ty1–H3 (GenBank accession no. M18706); Ty3, the 5′ LTR of Ty3-1 (accession no.M34549); Ty4, a solo LTR from pFG26 (accession no. K01601); and Ty5, the Ty5-1 5′ LTR (Voytas and Boeke 1992). Searches were conducted by use of the GCG program Wordsearch with a wordsize of 12 and default settings for all other parameters. Ty elements were identified as those matches with quality scores of ∼70 and greater. For Ty5, scores were considered as low as 50.
LTR alignments were viewed with the GCG program Segments and insertion boundaries were determined with the GCG program Bestfit. In cases where Bestfit failed to align LTR end sequences, adjustments of a few bases were made manually. The percent identities obtained with Bestfit were typically >70% for all except the more degenerate Ty5 insertions. On the basis of the coordinates of LTRs for full-length Tys, intervening sequences were extracted and the start and stop codons inGAG and POL were identified. For Ty1 and Ty2, the beginning of POL was defined as the leucine present at theGAG–POL frameshift site. Each nucleotide sequence was translated, and both nucleotide and amino acid sequences were aligned by use of the Pileup program.
We would like to note that this survey is comprehensive in that the entire deposited genome sequence was searched. However, because the genome sequence was not acquired systematically from a single strain, readers are cautioned that the data here may not represent the situation in S288C. Also, because of their inherent mobile nature, changes in element position caused by transposition are predicted.
In concordance with the nomenclature established by theSaccharomyces Genome Database to describe genome sequence features, each retrotransposon insertion was assigned a specific name to reflect its genomic location and orientation relative to the chromosome sequences. LTRs were prefixed with a four letter code, beginning with Y (for yeast), followed by a letter specifying chromosome location (A = chromosome I, B = chromosome II, etc.), the letter L or R to indicate left or right arm of the chromosome with respect to the centromere, and finally the letter W or C to indicate 5′ → 3′ orientation on the + or − strands, respectively. Immediately following the four-letter prefix was the Greek designation specifying the type of LTR (δ for Ty1 and Ty2, σ for Ty3, τ for Ty4, θ for Ty5). LTRs for each element family were numbered consecutively from left to right along the chromosome (e.g., δ1, δ2, etc.), as were full-length elements (e.g., Ty1-1, Ty1-2, etc.). A complete table describing all Ty insertions is available from our website (http://www.public.iastate.edu/~voytas/).
Evaluating Ty Target Bias
A list of tRNA genes encoded by the S. cerevisiae genome was obtained from http://biochimica.unipr.it/yeast/tRNA.html; these genes had been identified by use of the program Pol3scan (Pavesi et al. 1994). Distances were calculated between LTR boundaries and the nearest tRNA genes. Those insertions within 750 bases, excluding intervening retrotransposon sequences, were considered tRNA-associated. Insertions without tRNA gene associations were examined individually to determine whether they were flanked by previously identified genes transcribed by RNA Pol III. Approximately 1 kb of flanking sequences on either side of each insertion was used in BLAST searches of the complete GenBank nucleotide database. Sequences of flanking ORFs were excluded in these searches.
Phylogenetic Analysis
Full-size LTRs for each Ty family and GAG nucleotide sequences were aligned and compiled by use of the GCG program Lineup (Devereux et al. 1984). Multiple sequence alignments were performed with the program Pileup. The GCG programs Distances and Growtree were used to construct and view a neighbor-joining tree from the aligned sequences. Default parameters were accepted for all programs. For bootstrap analyses, additional neighbor-joining trees were constructed using the program MEGA (Kumar et al. 1993) or PAUP (Swofford 1997). These trees used either the complete GAG data set, or only LTR sequences from full-length elements.
We thank Gavin Naylor, Mike Cummings, and Rich Cronn for assistance with phylogenetic analyses and Cathy Ball for assistance with nomenclature. This work was supported by American Cancer Society grant VM145 to D.F.V. This is journal paper no. J-17656 of the Iowa Agriculture and Home Economics Experiment Station, Ames, Iowa, project no. 3120, and is supported by Hatch Act and State of Iowa Funds.
The publication costs of this article were defrayed in part by payment of page charges. This article must therefore be hereby marked “advertisement” in accordance with 18 USC section 1734 solely to indicate this fact.
Notes
[8] Corresponding author.
Notes
[9] E-MAIL [email protected]; FAX (515) 294-0345.
REFERENCES
- ↵H. BiessmannJ.M. MasonK. FerryM. d’HulstK. ValgeirsdottirK.L. TraverseM.L. Pardue(1990) Addition of telomere-associated HeT DNA sequences “heals” broken chromosome ends in Drosophila. Cell 61:663–673.
- ↵J.D. BoekeS.B. Sandmeyer(1991) Yeast transposable elements. in The molecular and cellular biology of the yeast Saccharomyces, eds J. BroachE. JonesJ. Pringle(Cold Spring Harbor Laboratory Press, Cold Spring Harbor, N.Y), 1:193–261.
- ↵J.D. BoekeD.J. GarfinkelC.A. StylesG.R. Fink(1985) Ty elements transpose through an RNA intermediate. Cell 40:491–500.
- ↵J.D. BoekeC.A. StylesG.R. Fink(1986) Saccharomyces cerevisiae SPT3 gene is required for transposition and transpositional recombination of chromosomal Ty elements. Mol. Cell. Biol. 6:3575–3581.
- ↵J.D. BoekeD. EichingerD. CastrillonG.R. Fink(1988) The Saccharomyces cerevisiae genome contains functional and nonfunctional copies of transposon Ty1. Mol. Cell. Biol. 8:1432–1442.
- ↵H. BusseyD.B. KabackW. ZhongD.T. VoM.W. ClarkN. FortinJ. HallB.F.F. OuelletteT. KengA.B. BartonY. SuC.J. DaviesR.K. Storms(1995) The nucleotide sequence of chromosome I from Saccharomyces cerevisiae. Proc. Natl. Acad. Sci. 92:3809–3813.
- ↵D.L. ChalkerS.B. Sandmeyer(1992) Ty3 integrates within the region of RNA polymerase III transcription initiation. Genes & Dev. 6:117–128.
- ↵L.K. DerrJ.N. Strathern(1993) A role for reverse transcripts in gene conversion. Nature 361:170–173.
- ↵J. DevereuxP. HaeberliO. Smithies(1984) A comprehensive set of sequence analysis programs for the VAX. Nucleic Acids Res. 12:387–395.
- ↵S.E. DevineJ.D. Boeke(1996) Regionally specific, targeted integration of the yeast retrotransposon Ty1 upstream of genes transcribed by RNA polymerase III. Genes & Dev. 10:620–633.
- ↵G.R. Fink(1987) Pseudogenes in yeast? Cell 49:5–6.
- ↵G.R. FinkJ.D. BoekeD.J. Garfinkel(1986) The mechanism and consequences of retrotransposition. Trends Genet. 2:118–123.
- ↵A. GabrielM. WillemsE.H. MulesJ.D. Boeke(1996) Replication infidelity during a single cycle of Ty1 retrotransposition. Proc. Natl. Acad. Sci. 93:7767–7771.
- ↵T. HigashiyamaY. NoutoshiM. FujieT. Yamada(1997) Zepp, a LINE-like retrotransposon accumulated in the Chlorella telomeric region. EMBO. J. 16:3715–3723.
- ↵J.L. JakubczakW.D. BurkeT.H. Eickbush(1991) Retrotransposable elements R1 and R2 interrupt the rRNA genes of most insects. Proc. Natl. Acad. Sci. 88:3295–3299.
- ↵H. JiD.P. MooreM.A. BlombergL.T. BraitermanD.F. VoytasG. NatsoulisJ.D. Boeke(1993) Hotspots for unselected Ty1 transposition events on yeast chromosome III are near tRNA genes and LTR sequences. Cell 73:1007–1018.
- ↵S. KumarK. TamuraM. Nei(1994) MEGA: Molecular evolutionary genetics analysis software for micrcomputers. Comput. Appl. Biosci. 10:189–191.
- ↵R.W. LevisR. GanesanK. HoutchensL.A. TolarF.M. Sheen(1993) Transposons in place of telomeric repeats at a Drosophila telomere. Cell 75:1083–1093.
- ↵R. MarschalekT. BrechnerE. Amon-BohmT. Dingermann(1989) Transfer RNA genes: Landmarks for integration of mobile genetic elements in Dictyostelium discoideum. Science 244:1493–1496.
- ↵R. MarschalekG. BorschetT. Dingermann(1990) Genomic organization of the transposable element Tdd-3 from Dictyostelium discoideum. Nucleic Acids Res. 18:5751–5757.
- ↵S. OkazakiH. IshikawaH. Fujiwara(1995) Structural analysis of TRAS1, a novel family of telomeric repeat-associated retrotransposons in the silkworm, Bombyx mori. Mol. Cell. Biol. 15:4545–4552.
- ↵A. PavesiF. ConterioA. BolchiG. DieciS. Ottonello(1994) Identification of new eukaryotic tRNA genes in genomic DNA databases by a multistep weight matrix analysis of transcriptional control regions. Nucleic Acids Res. 22:1247–1256.
- ↵D. PrussF.D. BushmanA.P. Wolffe(1994a) Human immunodeficiency virus integrase directs integration to sites of severe DNA distortion within the nucleosome core. Proc. Natl. Acad. Sci. 91:5913–5917.
- ↵D. PrussR. ReevesF.D. BushmanA.P. Wolffe(1994b) The influence of DNA and nucleosome structure on integration events directed by HIV integrase. J. Biol. Chem. 269:25031–25041.
- ↵L. RinckelD. Garfinkel(1996) Influence of histone stoichiometry on the target site preference of retrotransposons Ty1 and Ty2 in Saccharomyces cerevisiae. Genetics 142:761–776.
- ↵P. SanMiguelA. TikhonovY. JinN. MotchoulskaiaD. ZakharrovA. Melake-BerhanP. SpringerK. EdwardM. LeeZ. AvramovaJ. Bennetzen(1996) Nested retrotransposons in the intergenic regions of the maize genome. Science 274:765–768.
- ↵A.F.A. SmitG. TothA.D. RiggsJ. Jurka(1995) Ancestral, mammalian-wide subfamilies of LINE-1 repetitive sequences. J. Mol. Biol. 246:401–417.
- ↵D.L. Swofford(1997) Phylogenetic analysis using parsimony, PAUP (Prerelease 4.0 d56). (Smithsonian Institution, Washington, DC.).
- ↵H. TakahashiS. OkazakiH. Fujiwara(1997) A new family of site-specific retransposons, SART1, is inserted into telomeric repeats of the silkworm, Bombyx mori. Nucleic Acids Res. 25:1578–1584.
- ↵D.F. VoytasJ.D. Boeke(1992) Yeast retrotransposon revealed. Nature 358:717.
- ↵K.H. WolfeD.C. Shields(1997) Molecular evidence for an ancient duplication of the entire yeast genome. Nature 387:708–713.
- ↵Y. XiongT.H. Eickbush(1990) Origin and evolution of retroelements based upon their reverse transcriptase sequences. EMBO J. 9:3353–3362.
- ↵H. XuJ.D. Boeke(1987) High-frequency deletion between homologous sequences during retrotransposition of Ty elements in Saccharomyces cerevisiae. Proc. Natl. Acad. Sci. 84:8553–8557.
- ↵S. ZouD.F. Voytas(1997) Silent chromatin determines target preference of the retrotransposon Ty5. Proc. Natl. Acad. Sci. 94:7412–7416.
- ↵S. ZouN. KeJ.M. KimD.F. Voytas(1996a) The Saccharomyces retrotransposon Ty5 integrates preferentially into regions of silent chromatin at the telomeres and mating loci. Genes & Dev. 10:634–645.
- ↵S. ZouJ.M. KimD.F. Voytas(1996b) The Saccharomyces retrotransposon Ty5 influences the organization of chromosome ends. Nucleic Acids Res. 24:4825–4831.