
Abstract
DFNB7 and DFNB11, two loci for autosomal recessive nonsyndromic hearing loss (ARNSHL), have been mapped to chromosome 9q13–21 in separate consanguineous families. Using a radiation hybrid map, we have determined the correct marker order in the DFNB7/11 region and have demonstrated that theDFNB11 locus resides within a redefined DFNB7interval. The gene(s) responsible for ARNSHL at these loci resides within an ∼1 cM interval bounded by markers D9S1806(centromeric) and D9S769 (telomeric). A recently discovered Indian family confirms the new telomeric boundary. To assist in the identification and cloning of candidate genes, YAC and PAC contigs were constructed. A total of 19 YAC and 23 PAC clones were utilized to span the affected region and ensure double coverage throughout. Twenty-two previously published STSs and 21 new STSs were used to determine marker order and confirm the integrity of the contig. Using a positional cloning strategy we have identified three cochlear expressed genes that map to the DFNB7/11 interval.
Autosomal recessive nonsyndromic hearing loss (ARNSHL) is the most common form of severe inherited childhood deafness (Moatti et al. 1990;Reardon 1992). Affected persons are phenotypically indistinguishable, although >18 loci have been reported (Van Camp and Smith 1997). Two loci, DFNB7 and DFNB11, map to the same cytogenetic region, chromosome 9q13–21.
The DFNB7 locus was mapped to chromosome 9q13–21 by Jain et al. (1995) using two regionally separate consanguineous families from India. Affected individuals in family 1B, which was used to fine-map the disease, were homozygous at marker D9S301. Ancestral recombinations in this family were noted with markers D9S50and D9S15, placing the disease gene between these short tandem repeat polymorphisms (STRPs). Scott et al. (1996) mappedDFNB11 to the region between D9S15 andD9S927 in two highly inbred Bedouin kindreds from Israel. TheDFNB11 locus mapped telomeric to the DFNB7 locus and was believed to represent either (1) a novel form of ARNSHL in close proximity to DFNB7 or (2) a relocalization of theDNFB7 to a region telomeric to its reported location.
In this report we describe the construction of a radiation hybrid map, a yeast artificial chromosome (YAC) contig, and a P1-derived artificial chromosome (PAC) contig of the DFNB7/11 region. These physical mapping resources, in combination with genotyping data from newly available markers, have allowed us to (1) reorder several key markers in the DFNB7/11 interval; (2) demonstrate that theDFNB7 locus lies in a refined interval between D9S166and D9S769 in a region telomeric to its originally reported location; and (3) show that the new DFNB7 interval encompasses a refined DFNB11 interval located between D9S1806 andD9S769.
RESULTS
Radiation Hybrid Mapping
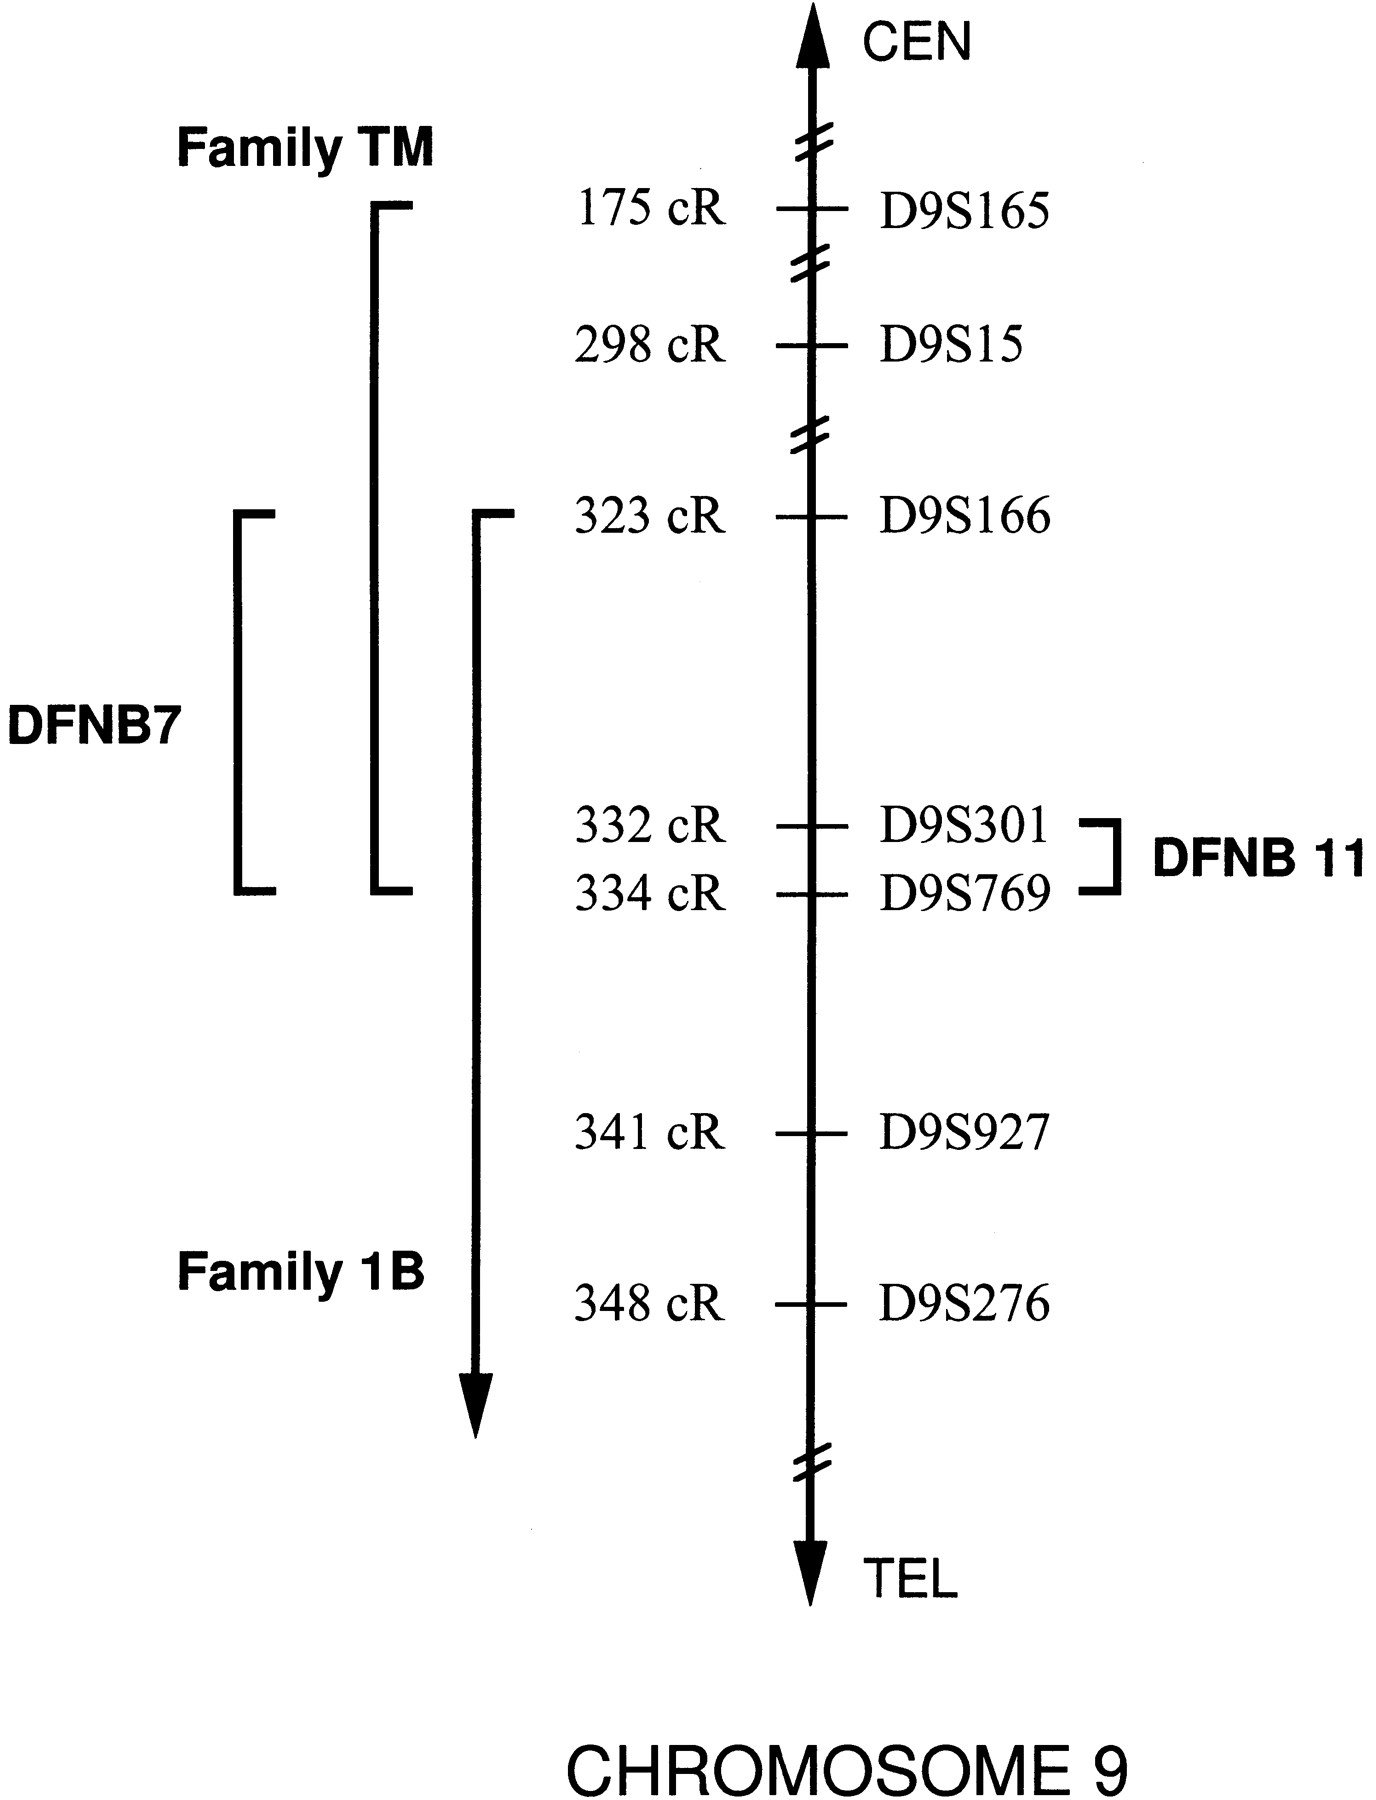
A radiation hybrid map of key markers in the DFNB7/11interval was constructed using the Genebridge 4 radiation hybrid panel (Research Genetics, Huntsville, AL). Radiation hybrid data for markersD9S301 and D9S175 were obtained from the Whitehead Institute/MIT Center for Genome Research (WICGR;http://www-genome.wi.mit.edu/cgi-bin/contig/phys_map), and markers D9S15, D9S769, and D9S276 were screened through the Genebridge 4 radiation hybrid panel by our laboratory. These markers were then placed relative to the WICGR’s Chromosome 9 Framework Map (which includes markers D9S165, D9S166, andD9S927) at lod>15. The resulting radiation hybrid map indicated that the most probable marker order was <D9S165–D9S15–D9S166–D9S301–D9S769–D9S927–D9S175–D9S276> (Fig. 1). Markers D9S1799, D9S1806, D9S1822, D9S1837, and D9S1876 were also screened through the Genebridge 4 radiation hybrid panel and found to be closely associated with the DFNB7/11 interval.
Radiation hybrid map of the DFNB7/11 region. Markers in theDFNB7/11 region were placed on the Whitehead Institute/MIT Center for Genome Research’s Chromosome 9 Framework Map at lod>15. CentiRay (cR) values represent total distance from the top of the Chromosome 9 Framework map. The DFNB7 interval is defined by the overlapping portion of the disease intervals of the Indian families TM (this report) and 1B (Jain et al. 1995). The DFNB11interval is based on data from Israeli Bedouin Kindreds 1 and 2 (Scott et al. 1996). The region between D9S301 and D9S769 is common to both the DFNB7 and DFNB11 intervals.
Genetic Mapping of DFNB7/11
Genotyping data presented by Scott et al. (1996) for Bedouin kindreds 1 and 2 (DFNB11) were reanalyzed using the marker order obtained by radiation hybrid mapping. Based on this analysis,D9S301 replaces D9S15 as the centromeric boundary forDFNB11. To further refine the boundaries of theDFNB11 locus, individuals from kindreds 1 and 2 were genotyped with markers D9S1799, D9S936, D9S237, D9S1806, D9S1822, D9S1837, D9S1876, and D9S769. All affected individuals were homozygous at markers D9S1822, D9S1837, and D9S1876,whereas one or more affected individuals were heterozygous at markersD9S1799, D9S936, D9S237, D9S1806, and D9S769.Assuming that the disease-causing gene in each kindred is inherited from a common ancestor and that heterozygosity at a particular marker results from one or more recombination events, we can refine theDFNB11 interval to a region bounded by D9S1806(centromeric) and D9S769 (telomeric) (Fig.2A).
(A) Homozygosity mapping in Israeli Bedouin Kindreds 1 and 2 (DFNB11). Selected affected individuals from kindreds 1 (K1), 2A (K2A), and 2B, (K2B), described by Scott et al. (1995), are shown with their corresponding haplotypes. Bold genotypes and lines define the region of homozygosity shared across both kindreds. All affected individuals are homozygous at markers D9S1822, D9S1837, andD9S1876, and the DFNB11 interval is bounded byD9S1806 (centromeric) and D9S769 (telomeric). (B) Homozygosity mapping of individuals from Indian family 1B (DFNB7), as described by Jain et al. (1995) with the centromeric boundary at D9S166. (C) Pedigree of family TM with haplotypes shown below. Homozygosity by descent is present fromD9S15 to beyond D9S276. Individual III defines the telomeric boundary with a recombination event at D9S769.

Genotyping data presented by Jain et al. (1995) for Indian families 1A and 1B (DFNB7) were also reanalyzed using the marker order obtained by radiation hybrid mapping. Based on this analysis,D9S166 replaces D9S50 as the centromeric border ofDFNB7 based on an ancestral recombination in family 1B andD9S276 replaces D9S15 as the telomeric border based on an observed recombination in an affected individual (IV4) in family 1A. The DFNB7 interval was further refined by the identification of an additional unrelated, but geographically similar, Indian family, TM, whose telomeric border is D9S769 based on the haplotype of the nonaffected individual III. (Fig. 2C). By combining the data from the 1B and TM families, we can refine theDFNB7 interval to a region between D9S166(centromeric) and D9S769 (telomeric).
YAC Map
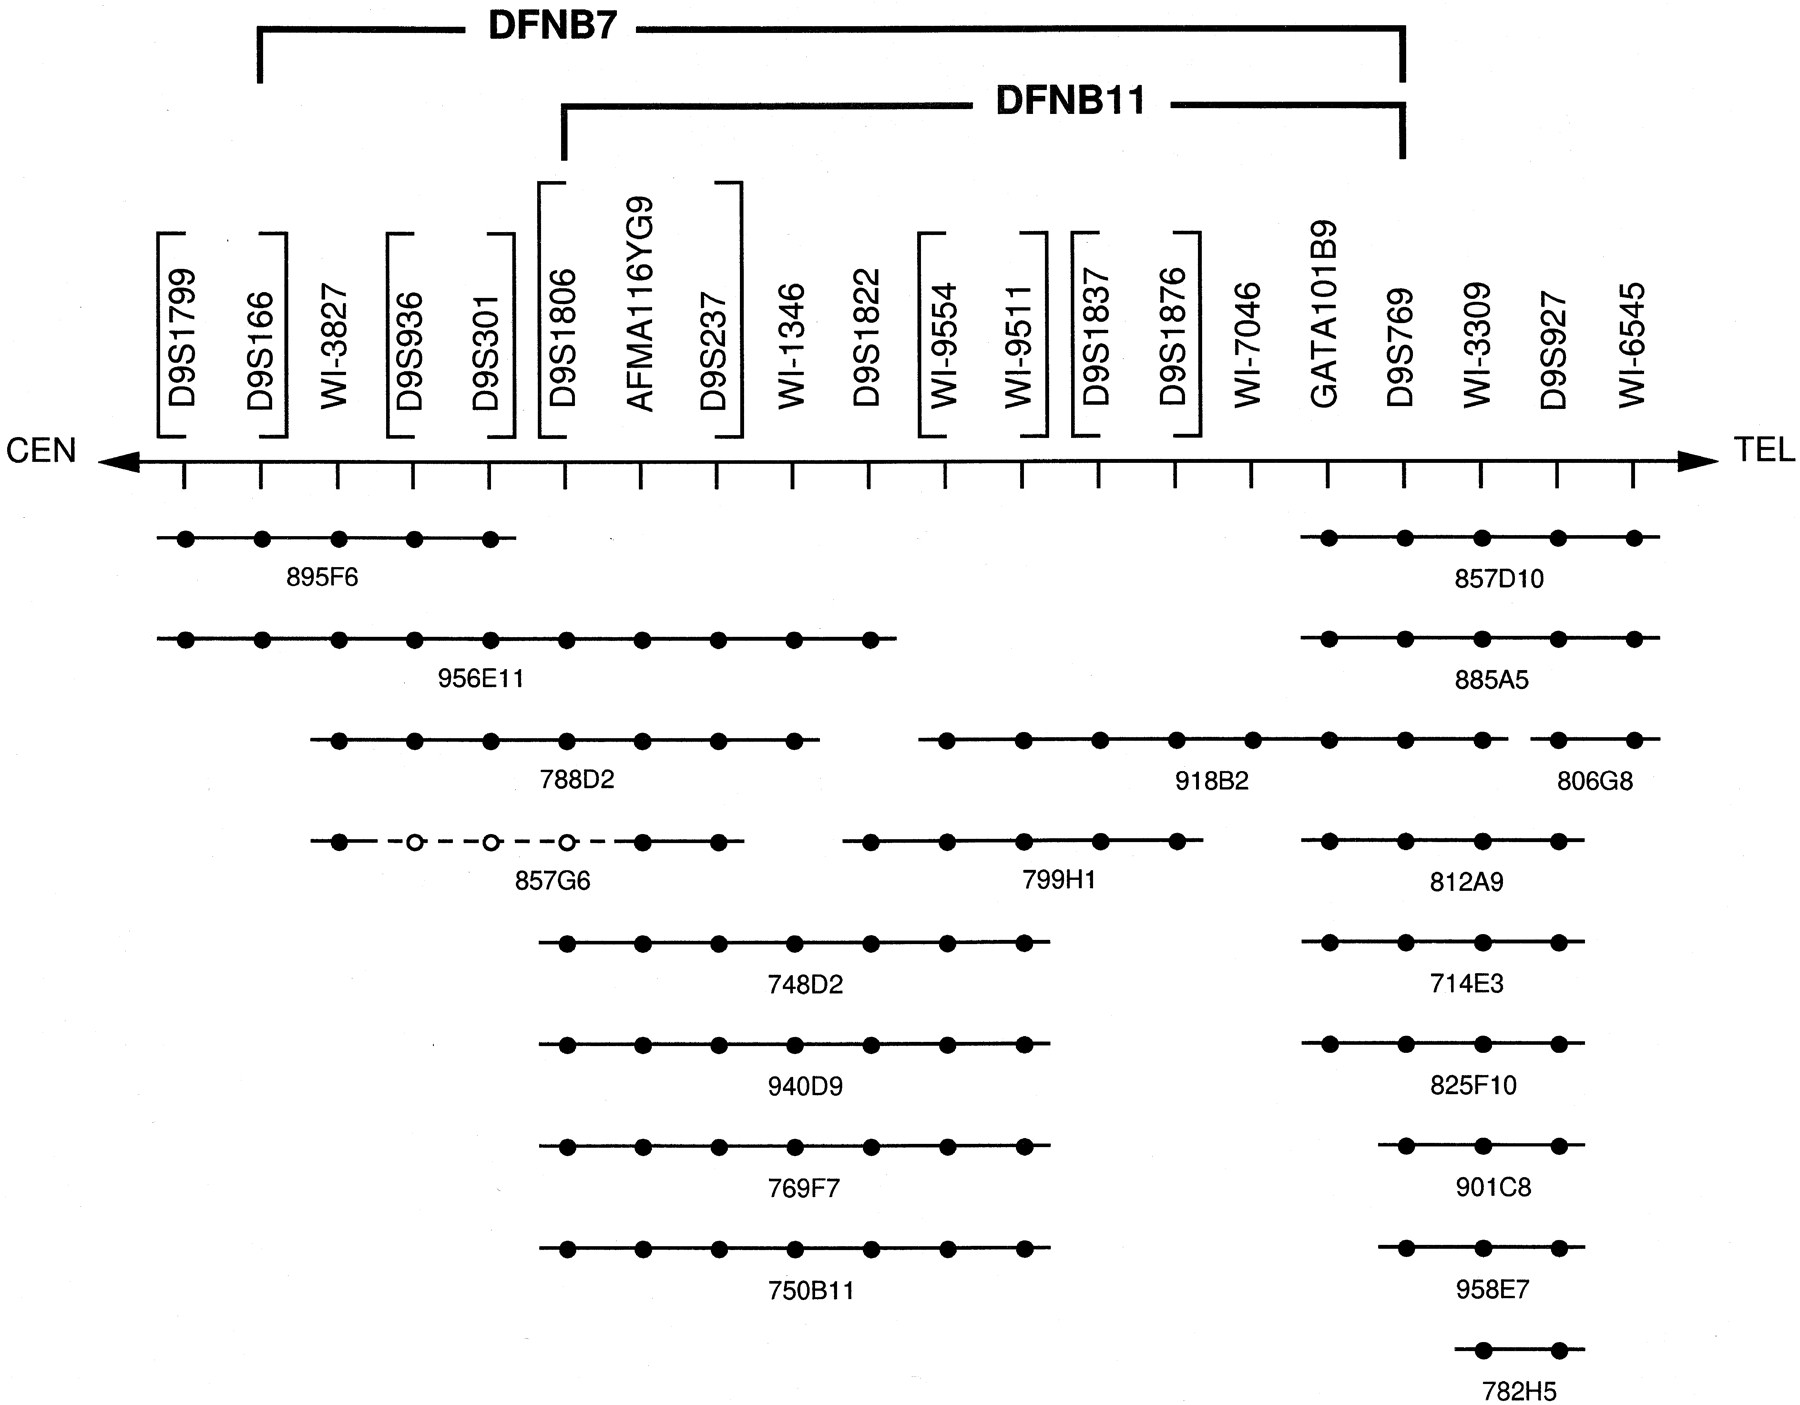
After refining the borders of the DFNB7/11 region, we assembled a YAC contig that spanned the disease interval. Nineteen YAC clones were selected based on information from the WICGR and by screening markers D9S1822, D9S1837, D9S1876, andD9S769 through the Centre d’Etude du Polymorphisme Humain (CEPH) A and CEPH B YAC screening panels (Research Genetics, Huntsville, AL). The sequence-tagged site (STS) content of each YAC was determined by screening for the presence of 20 chromosome 9 markers, including seven markers that had not been mapped to singly or doubly linked contigs by WICGR. Forty-three (44%) of the STS amplifications in these YACs represent novel amplifications while 55 (56%) represent confirmations of amplifications originally reported by WICGR. Five STS amplifications reported by the WICGR could not be confirmed in our YAC contig. Double coverage was obtained between markers D9S1799and WI-6545 with the exception of the region betweenD9S1876 and GATA101B9, which was spanned by a single YAC, 918B2. The minimum tiling path for the shared DFNB7/11region is defined by the two overlapping YACs 748D2 and 918B2 (Fig.3).
YAC contig of the DFNB7/11 interval. Individual YAC clones are represented by lines, STS amplification by solid circles, and no STS amplification by open circles. The region spanning D9S936, D9S301, and D9S1806 appears to be deleted in YAC 857G6 based on marker order data from the PAC contig. The DFNB7 andDFNB11 intervals are shown. Brackets surround groups of STSs that could not be ordered based on YAC data alone.
PAC Map
Nineteen STSs shown to map in and around the DFNB7/11region were screened against a PAC library (Genome Systems, St. Louis, MO) identifying, on average, two clones per STS (Ioannou et al. 1994). Twenty-one new STSs were generated by sequencing PACs at their T7 and SP6 ends. Automated sequencing provided adequate data for STS generation in 12 PACs; however several PAC ends could not be sequenced by either manual or automated technology. The location of each of the 21 new STSs mapped was verified by multiple experiments (Table1). The primer sequence for each primer pair was compared to sequences reported on the National Center for Biotechnology Information (NCBI) database. No significant homologies were found, although two STSs (18C10- and 149C14-SP6) contained Alu repeat sequences. STS-specific primers were selected using Primer 0.5 (WICGR), confirmed against their derivative and neighboring PACs, and used to rescreen the PAC library.
Newly Generated STSs from the PAC Contig in theDFNB7/11Region
| Name | Primer sequences |
| 18C10 SP6 | GTTCTTAAATACATTACCTGG/AAGATGGTCTGTCTCTGG |
| 18G19 T7 | GATGAGAGGGAGCTTGCTTG/GGCATGTCAGACTCACTCTTTG |
| 18G19 SP6 | TTTCTGGTATATACCCAAAGGA/GTGACTTGGTTAAAGACAAAGC |
| 59A20 T7 | AGAGACGCAAAGAAACAAAAGC/TTTCTCATGAATAATCCACCCC |
| 59A20 SP6 | CACGGGTTCCATATGATTCC/CCTGCATTGCTACAAGTTGTAA |
| 124G8 T7 | ACCACGTGGATGGGAGTAGT/AGTCACCTCCATTACCTTCCTG |
| 124G8 SP6 | AACAAACACAGTGAACTGACC/TAGATAGATGAACAGAGCTGGA |
| 133F2 T7 | ATGTGACTCCAAGTCCAGTC/TACAAGAGATGAGGCTGCAG |
| 133F2 SP6 | TGTAACCCAAACCCCTGTAA/TGGGATACAATTCAGCCTTG |
| 149C14 SP6 | CCAGACTGCATATAAAGTTCTT/ACGAGAAGCTCATCAACAA |
| 163H23 T7 | CCTACAAGTACAGCACCGTT/GAAGGCACAGTCGAGGCTGA |
| 200K20 T7 | TTTAACATTGTGAAATGGCACA/TGCAGTTCCTCTGGATAGTGG |
| 200K20 SP6 | TCTTCAACTTATTCCTCCTAAGTG/GATCTCGACATATATGTAGCATCT |
| 270F20 T7 | TTCAGTGAATGGAAATGTTTA/CCATTGTCCAGTATGTGGCA |
| 270F20 SP6 | TGGCTACTCATAGCAGATGCA/GACAAAGCACAAGCACGAAA |
| 278I19 T7 | AAAATTGTAAAACAAGCCACA/TTTAGGGATCTGCAGCATAT |
| 278I19 SP6 | CTTGAGAGCCTTCAACCCAG/AATACCGCAAGCGACAGC |
| 297B1 T7 | TGTACAATGAAGCTCCATGACA/ACGACAATCTCTTGAGAAGTGC |
| 297B1 SP6 | CAAACAAGTGTCCACTCTCCTC/GGTACGTACCCTATTGGAATGA |
| 312N17 T7 | TTGTTGCTTTCACAGCAAGG/TGAACGATGATCAGAAAACAGC |
| 312N17 SP6 | GCCACCCTCTACCTTGGTTT/GAATCTGCAAGGGCTCAGAG |
[i] All sequences are 5’ to 3’ in direction. Forward primers are noted first.
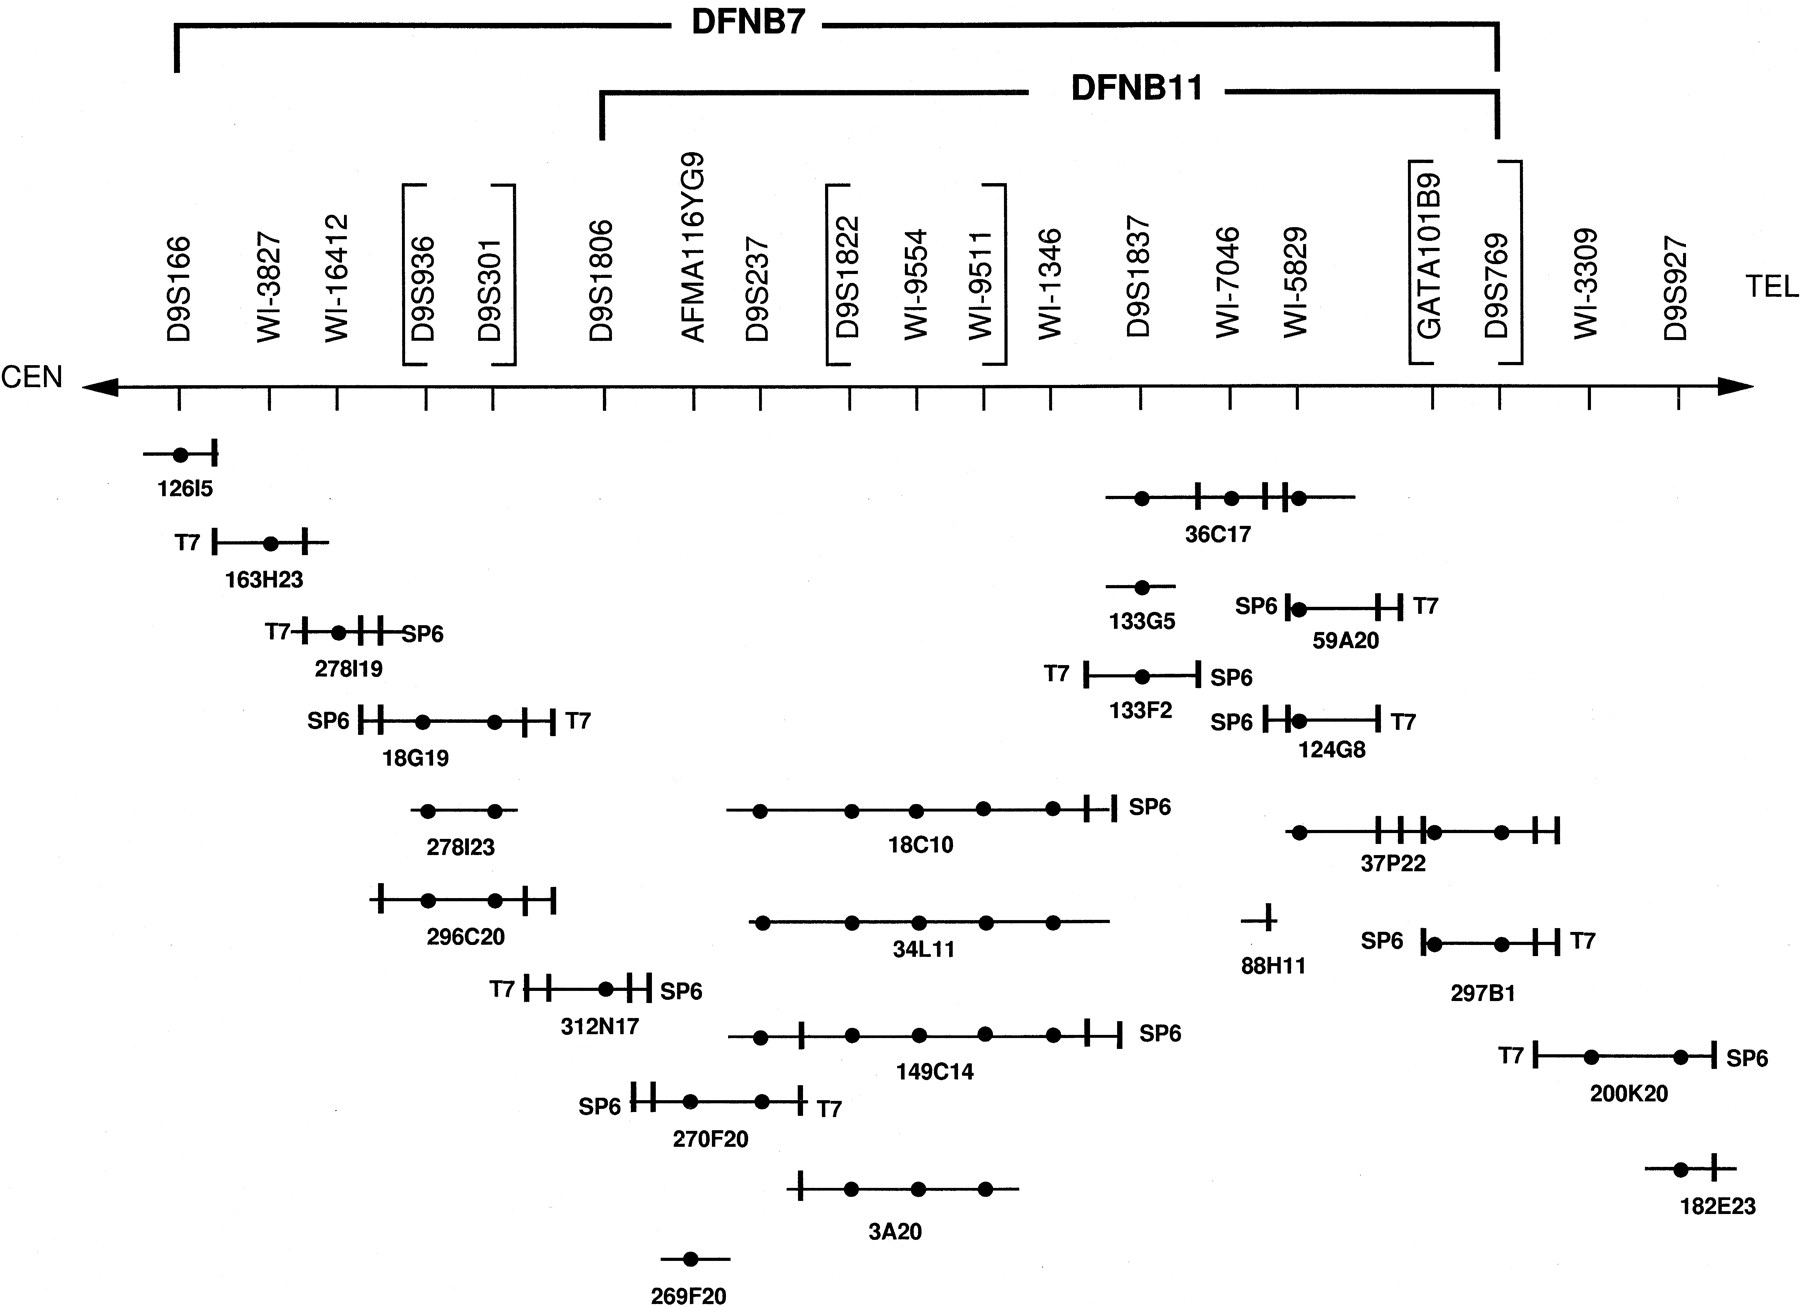
A minimum of six overlapping PACs are required to span the sharedDFNB7/11 interval which, based on an average PAC size of 140 kbp, approximates 1 Mbp (Fig. 4) (Ioannou et al. 1994). Markers that could not be ordered based on PAC data wereD9S936, D9S301, D9S1822, and WI-9511/9554.
PAC contig of the DFNB7/11 interval. Individual PAC clones are represented by lines, amplifications by previously published STS are represented by solid circles, and amplifications from STSs derived from the SP6 and T7 of PACs are represented by vertical bars. TheDFNB7 and DFNB11 intervals are shown. Brackets surround groups of STSs that could not be ordered based on PAC data alone.
The YAC and PAC maps differ in the location of marker WI-1346.This marker amplified in PACs 18C10, 34L11, and 149C14, but not in 3A20, which suggests that WI-1346 is located telomeric to theWI-9554/WI-9511 complex. However, YAC data from clones 956E11, 788D2, 799H1, and 918B2 place WI-1346 centromeric toD9S1822. Based on the YAC data, this conflict can be explained by a deletion or recombination in a single PAC (either 270F20 or 3A20) centromeric to D9S1822. If such an event exists,WI-1346 would lie centromeric to D9S1822, as indicated in the YAC map. Alternately, chimerism in the aforementioned four YAC clones would place marker WI-1346telomeric to D9S1822. This discrepency could not be resolved with multiple experiments.
Candidate Genes
Three cochlear-expressed genes in the DFNB7 region were identified by PCR screening of the YAC and PAC contigs and were confirmed to be cochlear expressed in a fetal cochlear library (data not shown). Two genes are located within the combined DFNB7/11interval. The first, annexin I (WI-7046), is a calcium-dependent phospholipid-binding protein that is expressed primarily in the supporting cells of the organ of Corti (Kovacic et al. 1991; Reiber et al. 1994). The second, a previously undescribed gene (WI-9554 and WI-9511), is represented by a 2500-bp cDNA contig. The third gene, also an undescribed cDNA complex (WI-16412), maps outside the combined DFNB7/11interval.
DISCUSSION
The construction of a detailed physical map is a prerequisite to gene identification by a positional cloning or positional candidate strategy. In this report we describe the construction of a radiation hybrid map, a YAC contig, and a PAC contig of the DFNB7/11region. These resources, in combination with genetic data from newly available markers, have enabled us to demonstrate that theDFNB11 locus resides within a redefined DNFB7interval. The gene(s) responsible for ARNSHL at these loci resides within a ∼1-cM interval bounded by markers D9S1806(centromeric) and D9S769 (telomeric).
The radiation hybrid map was constructed with two specific goals: (1) to determine the relative order for key markers in theDFNB7/11 interval; and (2) to identify additional markers that might be useful for refining the disease locus and creating YAC and PAC contigs of the region. Determining the true location of markerD9S301 was particularly important, as all affected individuals in the Indian family 1B were homozygous for this marker and ancestral recombinants had been seen for all other markers tested. When radiation hybrid data indicated that D9S301 was telomeric toD9S15 and D9S166, reanalysis of the original data presented by Jain et al. (1995) indicated that the DFNB7 locus was located in a region telomeric to its originally reported location. The reassigned DFNB7 locus overlaps the region defined forDFNB11. Although DFNB7 and DFNB11 might be caused by two genes in close proximity, it is more probable that hearing loss in the DFNB7/11 families is caused by mutations in the same gene.
Once the order of known markers in the DFNB7/11 interval was determined, the radiation hybrid map was used to identify additional markers in the disease region. Genotyping data from these markers refined the borders of the shared DFNB7/11 interval, withD9S1806 serving as the new centromeric boundary andD9S769 serving as the telomeric boundary.
To verify the marker order obtained by radiation hybrid mapping and to order markers whose distances were beyond the resolution of the Genebridge 4 radiation hybrid panel, we developed YAC and PAC contigs of the DFNB7/11 region. The relative order of 94% of the markers common to both maps is in agreement, and each map was useful in resolving ambiguities in the other. For example, the PAC contig was able to order marker AFMA116YG9 as centromeric to D9S237 based on amplification of marker AFMA116YG9 on PACs 270F20 and 269F20 (Fig.4), whereas the YAC contig was able to order two ambiguous regions of the PAC map: D9S1822 was found to be centromeric toWI-9511/9554, and GATA101B9 was found to be centromeric to D9S769 (Fig. 3). Markers D9S1799 andWI-6545 did not amplify from the PAC contig but are outside the DFNB7/11 region based on YAC data.
Several minor ambiguities in the YAC and PAC maps could not be resolved (Figs. 3 and 4). WI-5829 could not be placed on the YAC map but amplified with PACs 37P22, 59A20, 36C17, and 124G8. Conversely,D9S1876 could not be placed on the PAC map, although it amplified in YACs 918B2 and 799H1. The correct placement of markerWI-1346 is unclear, as each map placed the marker on either side of the D9S1822 and WI-9511/9554 complex.
We have utilized these physical mapping resources to identify two cochlear-expressed genes in the shared DFNB7/11 region and an additional cochlear-expressed gene in the DFNB7 region. We have confirmed the cochlear expression of the genes in the sharedDFNB7/11 region by screening a cochlear cDNA library and are presently evaluating these candidate genes.
METHODS
Radiation Hybrid Mapping
The Genebridge 4 radiation hybrid panel (Research Genetics, Huntsville, AL) was amplified twice with each DNA marker. The ability of each marker to amplify DNA from an individual well was scored as a 0 (no amplification, −), 1 (clear amplification, +), or 2 (unsure, +/−). The results from each amplification were compared, and a combined score was assigned to each well with 0 + 2 = 0, 1 + 2 = 1, and 0 + 1 = 2. Combined scores were used to place each marker on the WICGR Chromosome 9 Framework Map using the internet interface athttp://www-genome.wi.mit.edu/cgi-bin/contig/rhmapper.pl. Markers with Genebridge 4 data provided by the WICGR were placed on the framework map in an identical manner.
PCR Analysis for Genotyping and Physical Mapping
PCR amplification of DNA from individuals for genotyping was performed with 40 ng of human DNA in an 8.4-μl PCR reaction mixture containing 1.25 μl of PCR buffer [100 mm TRIS-HCl at pH 8.8, 500 mm KCl, 15 mm MgCl2, 0.01% (w/v) gelatin], 200 mm each dATP, dCTP, dGTP, dTTP, 2.5 pmoles of each forward and reverse primer and 0.25 units ofTaq polymerase. Samples were subjected to 40 cycles of 94°C for 30 sec, 52°C for 30 sec, and 72°C for 30 sec. PCR products were analyzed on 6% denaturing polyacrylamide gels (7.7 murea). Visualization of the DNA was accomplished using the silver-staining protocol of Bassam et al. (1991) or35S-labeled dATP autoradiography.
PCR amplification for radiation hybrid mapping and screening for YAC clones was performed in an identical manner, except that 2 μl of a 1:2 dilution of each DNA sample from the Genebridge 4 radiation hybrid panel (Research Genetics) or 2 μl of undiluted DNA from samples in the CEPH A and CEPH B YAC screening sets (Research Genetics) was used as the DNA template in each PCR reaction, respectively. To identify individual YAC clones, 2 μl of a 1:20 dilution of YAC DNA stock solution was used as the DNA template, and samples were subjected to 30 cycles of PCR. PCR amplification products for radiation hybrid mapping and YAC screening were verified by electrophoresis in a 1.5% agarose gel containing ethidium bromide.
PAC addresses were obtained by upper pool and Down to the Well (Genome Systems) PCR analysis of a pooled DNA PAC library. PCR conditions were 2 μl of upper plate pool DNA (or control), 2.5 μl of 10× PCR buffer (Perkin Elmer, Branchburg, NJ); 0.5 μl of 10 μm dNTPs, 1.0 μl of each primer (20 μm), and 1.25 units of Taq DNA polymerase (GIBCO–BRL, Grand Island, NY) in a final volume of 25 μl. Amplifications were done in a Perkin Elmer Thermal Cycler or an Ericomp Delta Cycler II (San Diego, CA) with a denaturation step of 94°C for 1 min, an annealing step of 55°C for 1 min, and an extension step of 72°C for 1 min for a total of 30 cycles. An elongation step of 72°C for 10 min was utilized after the final cycle. PCR products were identified by agarose gel electrophoresis and ethidium bromide staining.
Isolation of YAC DNA
YAC clones were obtained from Research Genetics and plated on Ura–Trp plates. After a 3-day incubation at 30°C, individual red/pink colonies were transferred to 3 ml of liquid YPD media and grown into early stationary phase (2–3 days). Clones were centrifuged for 7 min at 2000 rpm in a tabletop centrifuge, resuspended in 10 ml of 1 m sorbitol, and centrifuged for an additional 7 min at 2000 rpm. Pelleted cells were resuspended in 0.5 ml of 1 msorbitol, 0.1 m EDTA, 14 mm β-mercaptoethanol (pH 7.5) with 50 units of lyticase, and incubated at 37°C for 45 min. The resulting spheroplasts were microcentrifuged for 1.5 min at top speed, and the pellet cells were resuspended in 0.5 ml of 50 mm Tris, 20 mm EDTA (pH 8.0), and 50 μl of 10% SDS. After a 30-min incubation at 65°C, 200 μl of 5 mK acetate was added. After a 1-hr incubation on ice, the mixture was microcentrifuged at top speed for 5 min and the supernatant (containing the DNA) was transferred to a fresh tube. The sample was microcentrifuged for an additional 5 min, and 650 μl of isopropanol was added to the resulting supernatant. After a 2-min incubation at room temperature, the sample was microcentrifuged for 30 sec and the supernatant was discarded. Pelleted material was dried in a Speedvac evaporator and resuspended in 0.3 ml of TE buffer containing 100 μg of heat-treated RNase I. After a 30-min incubation at 37°C, 0.5 ml of isopropanol was added to the mixture and the DNA was pelleted by microcentrifuging for 30 sec. The DNA pellet was washed twice with 70% ethanol, desiccated in a Speedvac evaporator, and resuspended in 100 μl of TE buffer. Tubes were allowed to sit at room temperature for 30 min, followed by a brief spin in a microcentrifuge at maximum speed to pellet any insoluble material. The top 90 μl of solution was transferred to a fresh tube (DNA stock solution). A 1:20 dilution of this DNA stock solution was used as the DNA template in the PCR reactions used to identify the STS content of each YAC clone.
Purification of PAC clones
Stab clones obtained from Genome Research, Inc., were streaked onto Luria-Bertani (LB) broth/kanamycin plates and grown for 12–24 hr at 37°C. Ten milliliters of LB broth was then inoculated with a single colony of the PAC clone and grown overnight. A 2.5-ml aliquot of PAC broth was added to 75 ml of LB broth and grown for 6 hr at 37°C, with IPTG added after 1.5 hr. Two to six preparations of 30 ml each were subjected to a modified alkaline extraction procedure (Birnboim and Doly 1979). The centrifuged bacteria were gently resuspended in 1 ml of TES (10 mm Tris, 1 mm EDTA, 0.1 NaCl). After incubation at room temperature for 5 min, 2 ml of 0.2 mNaOH/1% SDS was added to lyse the bacteria. Next, 1.5 ml of 3m K acetate was added and the solution placed on ice for 5 min. The preparation was centrifuged for 10 min at 10,000g and the supernatant removed. RNA was removed with RNase incubation for 1 hr at 37°C, followed by a phenol–chloroform wash, ethanol precipitation, micropore filtration, and a final ethanol extraction. This procedure allowed for consistent recovery of ∼5–10 μg of DNA from a 30-ml culture broth.
Sequencing
After DNA preparation, PACs were subjected to either manual or automated sequencing. Manual sequencing was performed using a Perkin Elmer Amplicycle sequencing kit using standard T7 (5′-TAATACGACTCACTATAGGG-3′) and SP6 (5′-GATTTAGGTGACACTATAG-3′) primers. For manual sequencing, 1–2 μg of DNA was required, whereas automated sequencing required 3 μg of DNA for optimal results. A 373A Stretch Fluorescent Automated Sequencer (Applied Biosystems division of Perkin Elmer, Foster City, CA) was utilized for all automated sequences.
Candidate Gene Identification
Candidate gene and nucleotide/protein homology searches were performed using the human transcript map and BLAST programs on the NCBI home page (http://www.ncbi.nlm.nih.gov/). Genes and expressed sequence tag (EST) sites that mapped to chromosome 9q22–31 and derived from a fetal cochlear library were considered candidates. Markers associated with each gene were screened against the YAC and PAC contigs of theDFNB7/11 interval. Confirmation of tissue-specific expression was performed by PCR amplification using a fetal cochlear cDNA library.
We thank Ms. Jodi Klein for her assistance in the preparation of this manuscript and the Audiology Institute of the Soroka Medical Center and the NIV School for the Deaf in Beer-Sheva for their cooperation. PAC sequencing was performed by the DNA Core facility of the University of Iowa. This work was supported by National Institutes of Health grants R01DCO2842 (R.J.H.S.), HG00457 and P50HG00835 (V.C.S.), and by the Roy J. Carver Charitable Trust (V.C.S.).
The publication costs of this article were defrayed in part by payment of page charges. This article must therefore be hereby marked “advertisement” in accordance with 18 USC section 1734 solely to indicate this fact.
Notes
[2] These authors contributed equally to this project.
[3] Corresponding authors.
REFERENCES
- ↵B.J. BassamG. Caetano-AnollesP.M. Gresshoff(1991) Fast and sensitive staining of DNA in polyacrylamide gels. Anal. Biochem. 196:80–83.
- H.C. BirnbolmJ. Doly(1979) A rapid alkaline extraction procedure for screening recombinant plasmid DNA. Nucleic Acids Res. 7:1513–1523.
- ↵P.A. IoannouC.T. AmemiyaJ. GarnesP.M. KroiselH. ShizuyaC. ChenM.A. BatzerP.J. de Jong(1994) A new bacteriophage P1-derived vector for the propagation of large human DNA fragments. Nature Genet. 6:84–89.
- ↵P.K. JainK. FukushimaD. DeshmukhA. RameshE. ThomasA.K. LalwaniS. KumarB. PloplisH. SkarkaC.R.S. Srisailapathy(1995) A human recessive neurosensory nonsyndromic hearing impairment locus is a potential homologue of the murine deafness (dn) locus. Hum. Mol. Genet. 4:2391–2394.
- ↵R.T. KovacicR. TizardR.L. CateA.Z. FreyB.P. Wallner(1991) Correlation of gene and protein structure of rat and human lipocortin I. Biochemistry 30:9015–9021.
- ↵L. MoattiE.N. GarabedianH. LacombeC. Spir-Jacob(1990) Surdites de perception congenitales et syndromes associes. Ann. Oto-Laryngol. Chirurgie Cervico-Faciale 107:181–186.
- ↵W. Reardon(1992) Genetic deafness. J. Med. Genet. 29:521–526.
- ↵M.E. ReiberM.K. SchwaberJ.A. McKanna(1994) Lipocortin I immunolocalization in normal and hydropic ears. Am. J. Otol. 15:506–514.
- ↵D.A. ScottR. CarmiK. ElbedourS. YosefbergE.M. StoneV.C. Sheffield(1996) An autosomal recessive nonsyndromic-hearing-loss locus identified by DNA pooling using two inbred Bedouin kindreds. Am. J. Hum. Genet. 59:385–391.
- ↵Van Camp, G. and R.J.H. Smith. 1997. Hereditary hearing loss homepage. http://dnalab-www.uia.ac.be/dnalab/hhh.html.