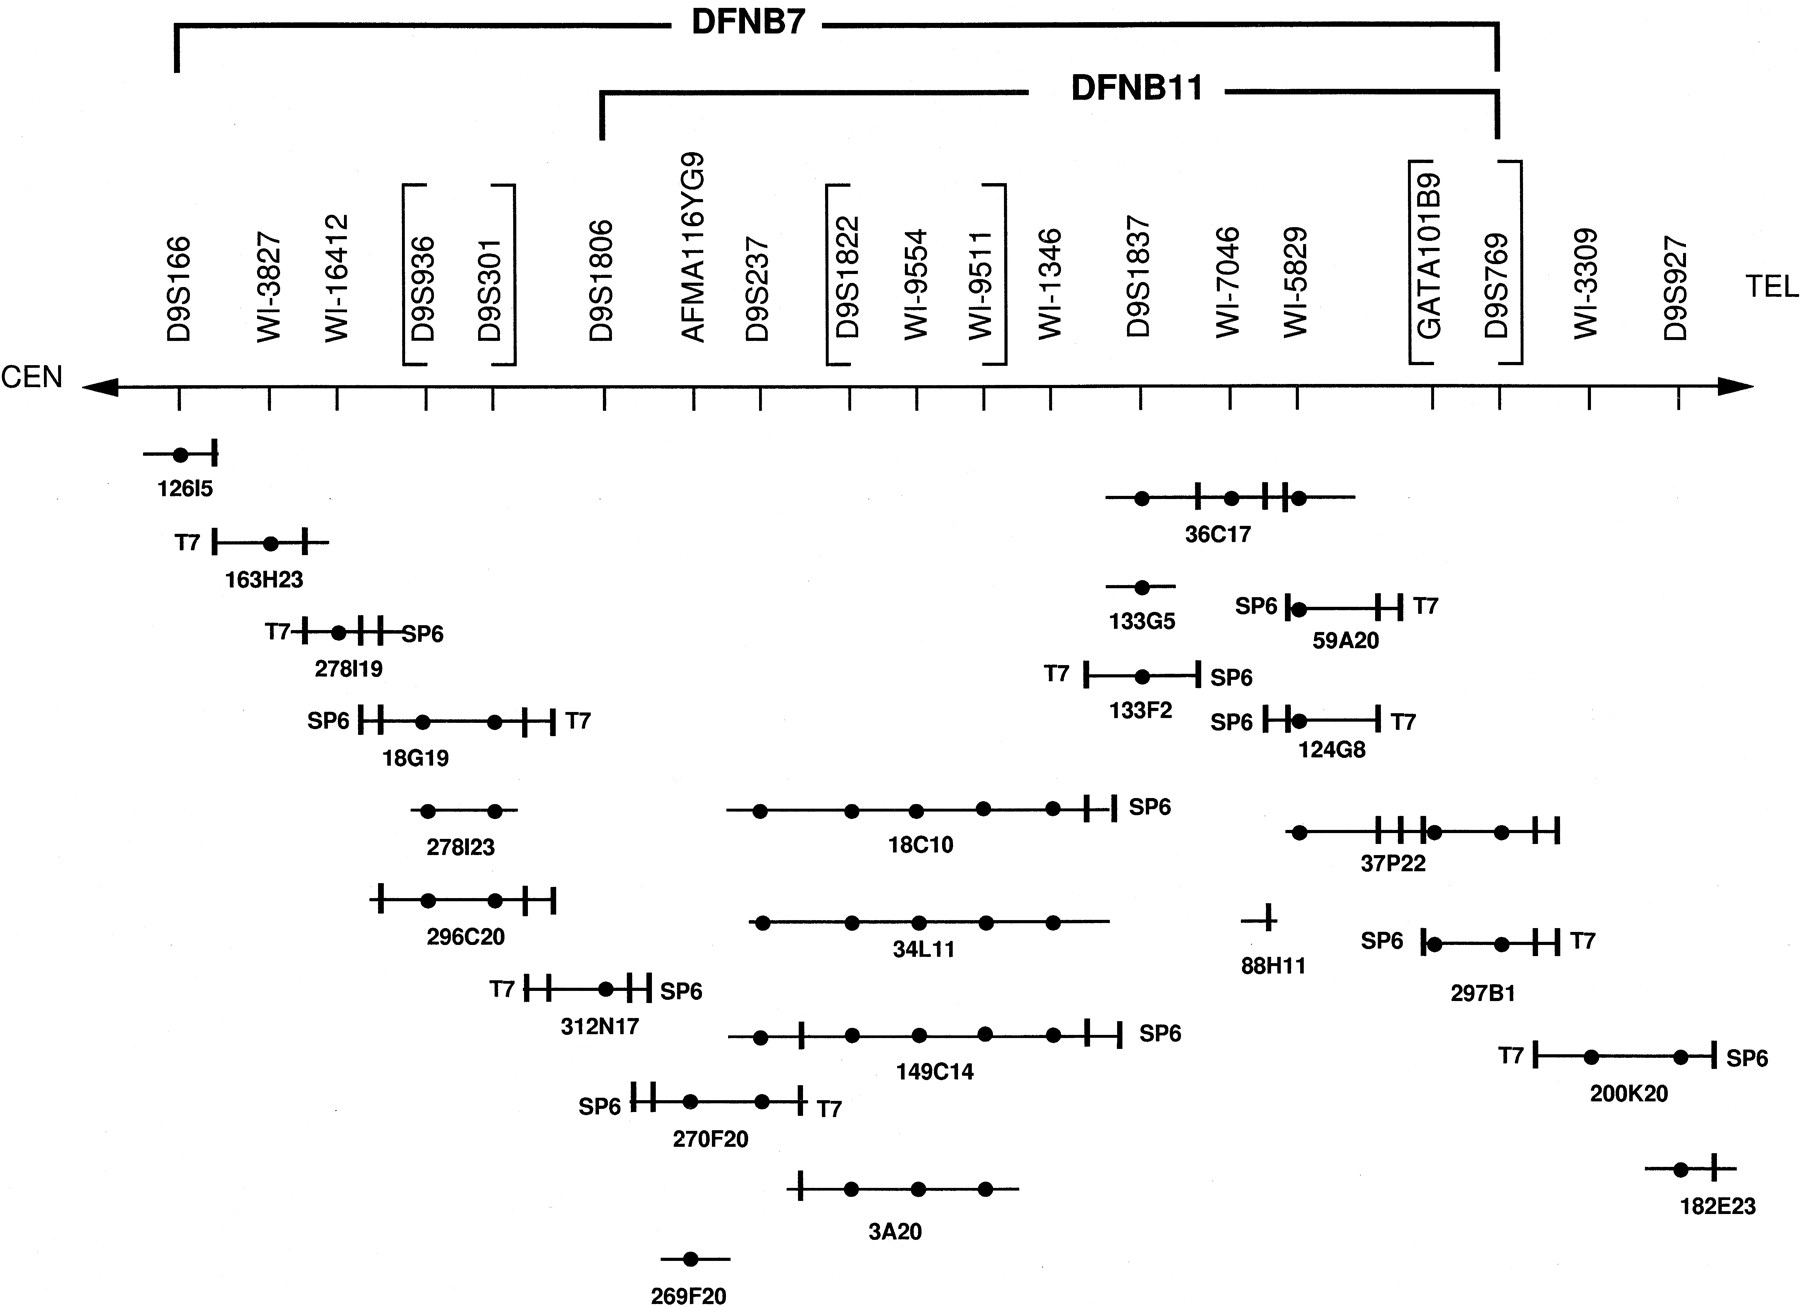
Figure 4.
PAC contig of the DFNB7/11 interval. Individual PAC clones are represented by lines, amplifications by previously published STS are represented by solid circles, and amplifications from STSs derived from the SP6 and T7 of PACs are represented by vertical bars. TheDFNB7 and DFNB11 intervals are shown. Brackets surround groups of STSs that could not be ordered based on PAC data alone.