
Abstract
The development of 3C-based techniques for analyzing three-dimensional chromatin structure dynamics has driven significant interest in computational methods for 3D chromatin reconstruction. In particular, models based on Hi-C and its single-cell variants, such as scHi-C, have gained widespread popularity. Current approaches for reconstructing the chromatin structure from scHi-C data typically operate by processing one scHi-C map at a time, generating a corresponding 3D chromatin structure as output. Here, we introduce an alternative approach to the whole-genome 3D chromatin structure reconstruction that builds upon existing methods while incorporating the broader context of dynamic cellular processes, such as the cell cycle or cell maturation. Our approach integrates scHi-C contact data with single-cell trajectory information and is based on applying simultaneous modeling of a number of cells ordered along the progression of a given cellular process. The approach is able to successfully recreate known nuclear structures while simultaneously achieving smooth, continuous changes in chromatin structure throughout the cell cycle trajectory. Although both Hi-C-based chromatin reconstruction and cellular trajectory inference are well-developed fields, little effort has been made to bridge the gap between them. To address this, we present ChromMovie, a comprehensive molecular dynamics framework for modeling 3D chromatin structure changes in the context of cellular trajectories. To our knowledge, no existing method effectively leverages both the variability of single-cell Hi-C data and explicit information from estimated cellular trajectories, such as cell cycle progression, to improve chromatin structure reconstruction.
The modeling of three-dimensional (3D) chromatin structure has gained significant attention in recent years, largely owing to the development of advanced techniques that provide deeper insight into chromatin organization. Methods for analyzing 3D genome organization can be broadly categorized into microscopic imaging–based approaches, sequencing-based techniques, and their accompanying computational models (Jerkovic and Cavalli 2021).
Although microscopic methods, such as superresolution imaging combined with fluorescence in situ hybridization (FISH) (Cremer et al. 2015, 2020), 3D-EMISH (Trzaskoma et al. 2020), or iPALM (Shtengel et al. 2009), have been applied to 3D chromatin structure reconstruction (Kadlof et al. 2024), sequencing-based computational approaches have been far more widely adopted. Especially 3D-FISH and DNA tracing algorithms were proven to be useful in mapping specific 3D chromatin structure folding (Lacen and Lee 2024; Yang and Wang 2024). Several DNA tracing or oligopaint experiments (see Bintu et al. 2018; Su et al. 2020) were used to validate chromatin structural models (Cheng et al. 2020). DNA tracing data sets were also successfully used for the studying of loop architecture (Beckwith et al. 2025b), as well as mitotic chromosome formation (Beckwith et al. 2025a).
These methods have led to a diverse range of computational strategies for chromatin modeling (Oluwadare et al. 2019; MacKay and Kusalik 2020) and have been extensively reviewed in the literature (Sekelja et al. 2016; Brackey et al. 2020; Meluzzi and Arya 2020; Portillo-Ledesma et al. 2023; Zhang et al. 2024b).
Several sequencing-based methods have been developed to provide genome-wide information on chromatin conformation. These include ligation-based techniques such as Hi-C (Lieberman-Aiden et al. 2009), HiChIP (Mumbach et al. 2016), Micro-C (Hsieh et al. 2015), or ChIA-PET (Fullwood et al. 2009), as well as nonligation approaches such as SPRITE (Quinodoz et al. 2018), ChIA-Drop (Zheng et al. 2019), or GAM (Beagrie et al. 2017). Among these, Hi-C and its derivatives have been the most widely used for chromatin structure reconstruction, offering invaluable insights into chromatin conformations across genomic scales (Lieberman-Aiden et al. 2009; Rao et al. 2014; Harris et al. 2023).
Notable examples of Hi-C–based methods successfully applied to the study of chromatin structure changes during cellular processes are maximum entropy models. By generating ensembles of structures, these approaches are able to reproduce ensemble-level chromatin behavior and contact distributions using minimal assumptions about the underlying system. Maximum entropy models such as MiChroM (Di Pierro et al. 2016) and Open-MicroM (Oliveira Junior et al. 2021a) have been used, for example, to elucidate the role of epigenetic marks in shaping chromatin architecture (Di Pierro et al. 2017) and to reconstruct chromatin structures from ancient biological remains (Sandoval-Velasco et al. 2024). Moreover, new methods within this framework continue to be actively developed (Lao et al. 2024).
However, reconstructing 3D chromatin structures from Hi-C data presents challenges, for example, in resolving ambiguous knotting patterns (Arsuaga et al. 2015) or in addressing the ergodicity of interaction frequencies (Lajoie et al. 2015). To overcome at least some of these limitations, single-cell and single-nucleus Hi-C techniques have been developed (Nagano et al. 2013; Flyamer et al. 2017; Ramani et al. 2017; Stevens et al. 2017), enabling novel insights into chromatin conformation heterogeneity at the single-cell level. For a detailed overview of published single-cell and single-nucleus data sets, see (Galitsyna and Gelfand 2021; Zhou et al. 2021; Zhen et al. 2022; Dautle and Chen 2025).
Although Hi-C data are commonly used for chromatin structure reconstruction, single-cell approaches offer distinct advantages by bridging the gap between bulk Hi-C's averaged view and microscopy-based studies of single-cell conformations (Nagano et al. 2013). Several methods have been developed for reconstructing the 3D chromatin structure from single-cell data (Nagano et al. 2013; Paulsen et al. 2015; Carstens et al. 2016; Hirata et al. 2016; Stevens et al. 2017; Rosenthal et al. 2019; Zhu and Wang 2019; Wettermann et al. 2020; Kos et al. 2021; Meng et al. 2021; Zha et al. 2021; Rothörl et al. 2023), which were reviewed by Banecki et al. (2024), and new ones are constantly being developed (Wang and Cheng 2025). Despite their methodological diversity, these approaches share key similarities. Notably, most models reconstruct chromatin structure using a single scHi-C map at a time, potentially overlooking contextual information from other cells. Incorporating this broader context could improve reconstruction accuracy, for example, by integrating bulk Hi-C data, as demonstrated by Rosenthal et al. (2019). Another method of using this context information indirectly is by applying imputation techniques, for which several notable examples include Higashi (Zhang et al. 2022a), Fast-Higashi (Zhang et al. 2022b), ScHiCEDRN (Wang et al. 2023), HiC-SGL (Zheng et al. 2023), ScHiCAtt (Menon et al. 2025), or HiCENT (Gao et al. 2025). These methods, and other general deep learning models developed for Hi-C resolution enhancement (Fang et al. 2024; Angel et al. 2025), can be used in tandem with chromatin reconstruction algorithms to enrich the resulting structures. However, most do not explicitly model structural changes along a continuous cellular trajectory or process of interest.
Broadening our perspective beyond Hi-C studies within cellular genomics, we find significant advances in single-cell analysis. For instance, single-cell RNA sequencing (scRNA-seq) has revolutionized transcriptomics by offering advantages over traditional bulk analysis (Stegle et al. 2015; Bacher and Kendziorski 2016). Single-cell transcriptomics has provided key insights into the inherent heterogeneity of dynamic cellular processes, including cell differentiation, maturation, activation, response to stimuli, and cell cycle progression. To study the transitions cells undergo during these dynamic processes, numerous computational methodologies, collectively known as trajectory inference (TI) methods, have been developed and extensively reviewed (Cannoodt et al. 2016; Saelens et al. 2019; Deconinck et al. 2021), alongside methods focused more specifically on single-cell clustering (Krzak et al. 2019). The field continues to expand, with dozens of TI methods already established and new ones continually emerging (Jiang et al. 2022; Smolander et al. 2023; Zhang et al. 2023, 2024a; Du et al. 2024; Hong et al. 2024; Shi et al. 2024).
Although RNA-seq-based TI methods have been widely applied to studying cell cycle trajectories, cell maturation, and differentiation, much less effort has been made to integrate these approaches with single-cell Hi-C data and, consequently, 3D chromatin modeling. One of the first attempts to reconstruct a cell cycle trajectory using scHi-C data was by Nagano et al. (2017), who introduced the “repli-score” to estimate pseudotrajectories of cell cycle progression. Subsequently, methods such as CIRCLET (Ye et al. 2019) or scHiCPTR (Lyu et al. 2022) were developed with similar objectives. Additionally, several approaches have been proposed for clustering or classification of scHi-C data, particularly for identifying cell cycle phases. Notable recent examples include scHiCluster (Zhou et al. 2019), Kim et al. (2020), scHiCyclePred (Wu et al. 2024), or scHiClassifier (Zhou and Wu 2025).
Beyond TI and clustering, other key areas of single-cell Hi-C analysis include embedding, imputation, and denoising, all of which remain active research topics. Most scHi-C analyses begin with dimensionality reduction and embedding (for a review of embedding methods in scHi-C, see Ma et al. 2024). These embeddings serve as a foundation for subsequent analyses, such as imputation (Zhang et al. 2022a,b) and denoising (Zheng et al. 2022; Yang et al. 2024), and are also valuable starting points for reconstructing cell cycle trajectories and other dynamic cellular processes.
We propose that integrating cellular trajectory information obtained from TI methods adapted for scHi-C could significantly enhance 3D chromatin reconstruction. To date, no existing method explicitly incorporates trajectory data into chromatin structure reconstruction from scHi-C. Most reconstruction methods are based on Hi-C, with only a few attempting to integrate microscopy data (Abbas et al. 2019) or additional genomic data sets such as ChIP-seq or RNA-seq (Caudai et al. 2021; Caudai and Salerno 2024). Although an increasing number of approaches incorporate single-cell or single-nucleus Hi-C data (Banecki et al. 2024), they generally treat each scHi-C map independently, thereby losing valuable information embedded in cellular trajectories.
Here, we introduce ChromMovie, to our knowledge the first 3D chromatin conformation modeling method that explicitly incorporates cellular trajectory information, such as cell cycle or cell maturation dynamics. ChromMovie uses an OpenMM framework (Eastman et al. 2024) and builds upon widely used molecular approaches in scHi-C-based chromatin structure reconstruction (Banecki et al. 2024) by modeling multiple scHi-C maps simultaneously and leveraging their ordering, as determined by a TI method or the scHi-C experiment itself. The method incorporates the knowledge about cell order by adding metarestraints to the molecular dynamics simulation (MD; see Methods), which itself is based on a previous methods for 3D chromatin structure reconstruction from scHi-C data such as NucDynamics (Stevens et al. 2017). In this way, the simulation of a 3D chromatin structure from a particular scHi-C map is influenced by neighboring scHi-C maps within the data set, with neighbors defined as the immediate predecessor and successor in the trajectory order. Rather than treating each scHi-C map independently, this approach allows chromatin contacts from adjacent pseudo–time points to influence structure formation, capturing continuity along the trajectory. By incorporating this temporal context, ChromMovie enhances robustness against the inherent noise in scHi-C data and serves as an implicit normalization strategy. This prevents reconstructed chromatin structures at any pseudo–time point from becoming trapped in local optima of MD simulations, leading to more biologically meaningful results.
Results
To evaluate the performance of our model, we conducted several analyses using both in silico examples and real-life single-cell contact data, incorporating cellular trajectory context derived from Chai et al. (2025) as well as mitotic chromosome formation data from Gibcus et al. (2018). The in silico studies enabled us to fine-tune the hyperparameters of ChromMovie, whereas the real-life data helped us demonstrate the algorithm's effectiveness in studying changes in single-cell chromatin conformation.
Benchmarking on in silico models
To validate our model, we first tested it on an artificial in silico model. We chose a process involving the contraction of a ring-like zigzag structure (see Fig. 1A) with a constant distance between consecutive beads. Based on this “ground-truth” structure, we generated a number of contacts for each frame, proportional to the 3D distance between loci, which were then used as input for ChromMovie. This allowed us to assess how well the model reconstructed the original structure by comparing it to the modeled structures using the root mean square deviation (RMSD) measure.
ChromMovie in silico analysis. (A) In silico example of a ring-forming, contracting zigzag structure used for initial validation. (B) Results of 1000 runs of the ChromMovie simulation on the in silico model. Root mean square deviation (RMSD) was used to compare with the original structure. The top right corner shows a zoomed-in view of the fitted Loess curve, indicating a clear minimum. (C) Examples of the force potentials used in ChromMovie. From top to bottom, harmonic excluded volume (EV) potential, harmonic backbone (BB) potential with linear approximation for larger distances, Gaussian single-cell (SC) potential, and harmonic frame force (FF) potential. (D) Selected diagnostic plots from the ChromMovie reporter. The mean radius of gyration indicates greater compaction for frames closer to the end, consistent with the original structure. P(s) curve allows for analysis of the contact frequency distribution. Local loci variability helps visualize regions of the structure that experience the greatest changes during the studied cellular process. (E) Single-cell contact violations across different ChromMovie runs, comparing cases with the gradual increase of the respective force coefficient turned on or kept constant.
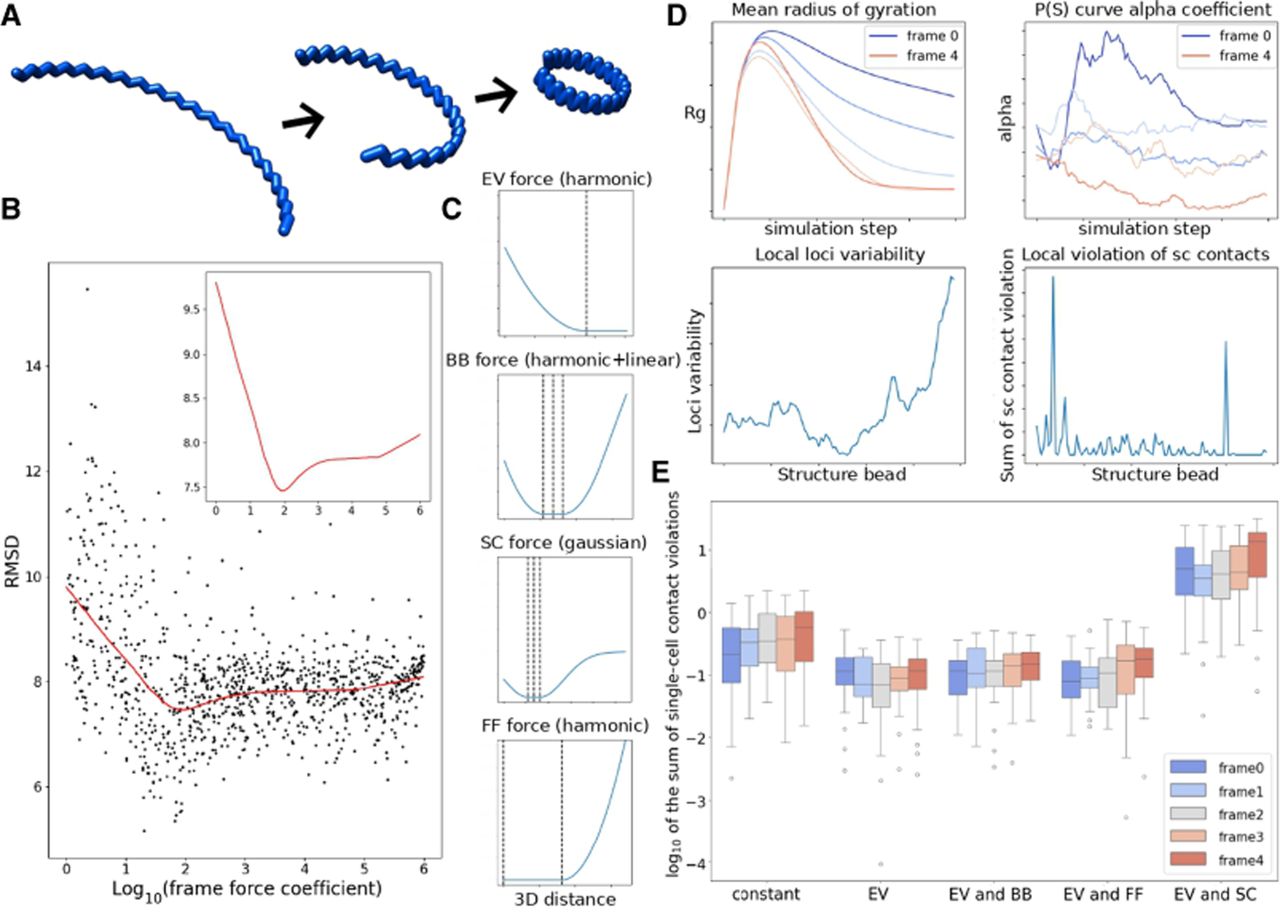
We initially used this approach to validate the core concept of ChromMovie, which is to enhance general MD chromatin reconstruction by using connections between frames. For this, we performed 1000 runs of ChromMovie algorithm with different hyperparameter sets. The coefficients for EV, BB, and SC were kept constant at 103, whereas the coefficient for FF was drawn randomly on a logarithmic scale between zero and 106. For smaller values of kFF, the model should generally behave as an independent modeling strategy, similar to how most models operate by treating each single-cell contact map separately.
The results of this analysis are shown in Figure 1B. Each point on the plot represents a single hierarchical ChromMovie simulation. A Loess curve was fitted to the data, with a zoom-in view provided in the top left corner. The analysis revealed a clear minimum RMSD around kFF ≈ 94.1. Notably, at this FF coefficient value, the reconstruction was significantly enhanced compared to the independent modeling with kFF ≈ 0. Although this result was obtained from an in silico example, it provides initial evidence that our approach can improve MD chromatin reconstructions. It also suggests that the FF coefficient should be set approximately one order of magnitude smaller than the other force coefficients.
This result was obtained with all force potentials being harmonic, along with linearization at larger distances. However, alternative formulas for force potentials can also be used. Figure 1C shows example set of forces that can be used. ChromMovie also automatically computes a variety of metrics based on the simulation results, which are summarized in PDF reports. Figure 1D showcases some of these metrics. These include the structures’ radius of gyration (Rg) and the α coefficient from the estimated contact probability scales curve P(s) ∝ s−α (as defined in, e.g., Lieberman-Aiden et al. 2009), both of which are computed across all structure frames and simulation time. Other metrics include local loci variability, local violations of SC contacts, mean violations of all four main force field components, as well as general MD metrics such as energy and temperature during the simulation.
We hypothesize that the local violation detected by ChromMovie (Fig. 1D, bottom right corner) could help identify loci with problematic local topology and knotting. This could also be useful in studies exploring the role of topoisomerases in organizing mitotic chromosomes (Hildebrand et al. 2024). However, further investigation is required.
The validity of gradually increasing force coefficients was also tested. In this study, we performed 1000 hierarchical ChromMovie simulations, with force coefficients either gradually increasing or remaining constant. The results of this analysis are presented in Figure 1E. We successfully confirmed that applying a gradual increase of the EV coefficient during the simulation significantly improved reconstruction reliability, as measured by the sum of single-cell contact violations (distances between the 3D simulation results and the upper bound for the flat bottom of the SC potential). This finding supports similar claims made in previous studies (Stevens et al. 2017; Rothörl et al. 2023), in which adding a gradual increase of the EV coefficient (“EV” group) significantly reduced contact violations compared to constant coefficients (“constant” group). However, the effectiveness of this approach was dependent on the specific set of force hyperparameters, and the gradual increase did not consistently enhance the simulation results. Moreover, we were unable to validate the efficacy of a gradual increase for other forces, despite its application in certain studies (Rothörl et al. 2023). We conclude that, in the case of ChromMovie, the overall success of this approach may be context dependent and is not guaranteed to improve every simulation scenario.
Benchmarking on ChAIR data set
ChAIR (Chai et al. 2025) is a high-throughput method that simultaneously measures gene expression, chromatin accessibility, and chromatin interactions in single cells. By leveraging a microfluidic platform, it can analyze 6000−8000 cells in a single reaction, providing insights into the 3D epigenomic mechanisms that regulate transcription. Cells with similar transcriptomic profiles during the cell cycle or maturation process were grouped into metacells with same amount of chromatin contacts to increase data volume and reduce stochasticity (see Fig. 2A,B). This data set was selected to validate our model using real single-cell contact data with specific information about a particular cellular process, namely, cell cycle progression. The data set comprised 102 metacells, representing the progression through the interphase trajectory phases of the cell cycle, specifically G1, S, and G2M.
Validation of ChromMovie using ChAIR data. (A) Visualization of single-cell ChAIR data for the K562 cell line using 2D principal component analysis (PCA) (see Chai et al. 2025). (B) The same single-cell data with metacells highlighted as alternating stripes to indicate grouping. (C,D) Representative single-cell contact maps for Chromosome 12, illustrating a more relaxed chromatin state during the S phase (C) and a more condensed state in the G2M phase (D). (E,F) Corresponding 3D chromatin structures generated by ChromMovie for the contact maps shown in C and D, respectively. (G) The mean radius of gyration across all 102 metacells throughout cell cycle progression, comparing ChromMovie and NucDynamics. (H) Mean RMSD values plotted as a function of frame shifts, assessing structural consistency between consecutive frames in both ChromMovie and NucDynamics models.
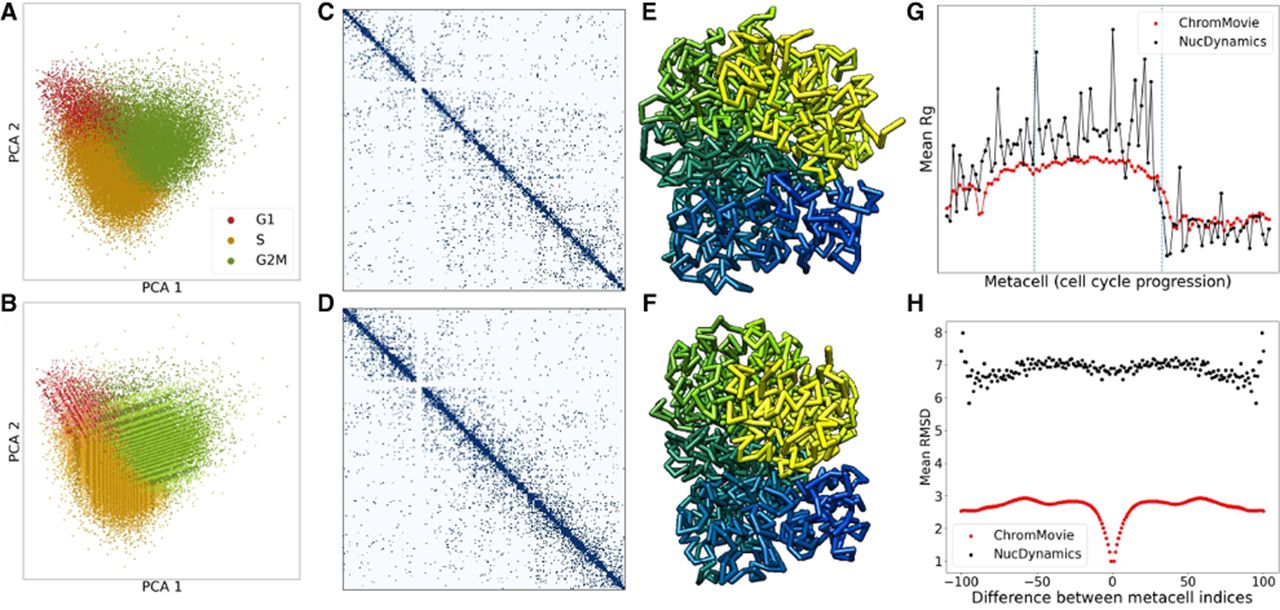
Based on the contact data derived from these metacells (see Fig. 2C,D), we generated 3D chromatin structure models using both ChromMovie and NucDynamics. For both algorithms, hierarchical modeling was applied with a consistent final resolution of 100 kb. Our analysis revealed that both methods were capable of reconstructing the chromosome compaction pattern observed during cell cycle progression, as described in previous studies (Nagano et al. 2017), from early G1 to late G2M phase (Fig. 2G). Chromatin compaction was quantified using the mean radius of gyration of overlapping structural bead segments. Notably, although both methods successfully captured cell cycle dynamics, the structures produced by ChromMovie exhibited considerably lower variability, which aligns with the expected regularizing effect of the frame forces.
Furthermore, we evaluated whether ChromMovie could not only accurately recreate cell cycle progression dynamics but also achieve smoother transitions and greater similarity between consecutive frames, thereby producing a more biologically relevant evolution of 3D chromatin structure. To this end, the RMSD was computed for all frame pairs in both ChromMovie and NucDynamics structures. The mean RMSD differences were used to assess the degree of metacell displacement between consecutive frames (Fig. 2H). This analysis provided insights into the correlation of each frame's structure within the overall “movie” of cell cycle progression. The results demonstrated that the ChromMovie-generated structures exhibited significantly higher similarity across frames compared with those obtained from the independent NucDynamics simulations, thereby validating the robustness of our approach.
Spatial modeling of genomic features in single cells
Having confirmed that ChromMovie can successfully reproduce key chromatin dynamics associated with cell cycle progression, as reported in previous studies, and does so in a smoother and more continuous manner, we next aimed to evaluate whether the method can also capture other established features of nuclear chromatin compaction. To this end, we tested ChromMovie using diploid cell maturation contact data from Chai et al. (2025), derived from vascular mouse brain tissue. The mouse cells were analyzed at 2, 11, 95, 365, and 720 days, resulting in five distinct frames for the ChromMovie simulation. Because the original data set did not exclusively represent a single cell type, we subsampled the contact data to 5000 contacts per frame to ensure consistency. This data set allowed us to assess whether ChromMovie could recapitulate well-known phenomena such as the emergence of chromosomal territories within the nucleus and the segregation of chromatin compartments.
Figure 3A shows an example frame of the results of this analysis with distinct chromosomal territories marked by contrasting colors. To check whether the chromosomal territories pattern correspond to those reported by the previous studies, we estimated the degree of interchromosomal intermingling. We followed the definition of intermingling as defined by Meng et al. (2021) as the percentage of chromosome beads surrounded by at least four other beads from a different chromosome within a threshold distance of two bead diameters. In our case, the bead diameter can be defined as the optimal distance of the backbone force dBB described previously.
Analysis of ChromMovie-derived structural features using single-cell data. (A) ChromMovie reconstruction of a single-cell, whole-genome diploid mouse nucleus. Individual chromosomes are shown in distinct colors to visualize chromosomal territories. (B) Quantification of interchromosomal intermingling based on the structure in A. Maternal chromosomes are labeled with the suffix “-M”; paternal chromosomes, with “-P.” (C) ChromMovie model of the same cell highlighting chromatin compartmentalization. Compartment A (red) and compartment B (blue) are visualized in a central nuclear cross-section. Gray segments represent regions with unknown compartment (mostly centromeres and telomeres). (D) Radial distribution of compartments A and B based on the model in C, demonstrating preferential localization of active (A) and inactive (B) regions within the nuclear volume. (E) Radial distribution of RNA-seq signal from the ChAIR data set, showing that transcriptionally active regions are enriched closer to the nuclear center. (F) Radial distribution of ATAC-seq signal from the same data set, indicating increased chromatin accessibility near the nuclear interior. (G) Validation of ChromMovie structural models using 3D-FISH probe data from Beagrie et al. (2017). Each point represents a unique combination of cell, frame force coefficient, and the corresponding quantile (0.50, 0.75, or 0.95) of the correlation distribution between modeled and experimental distances. Loess trend lines are shown for each quantile to highlight the effect of frame force regularization.
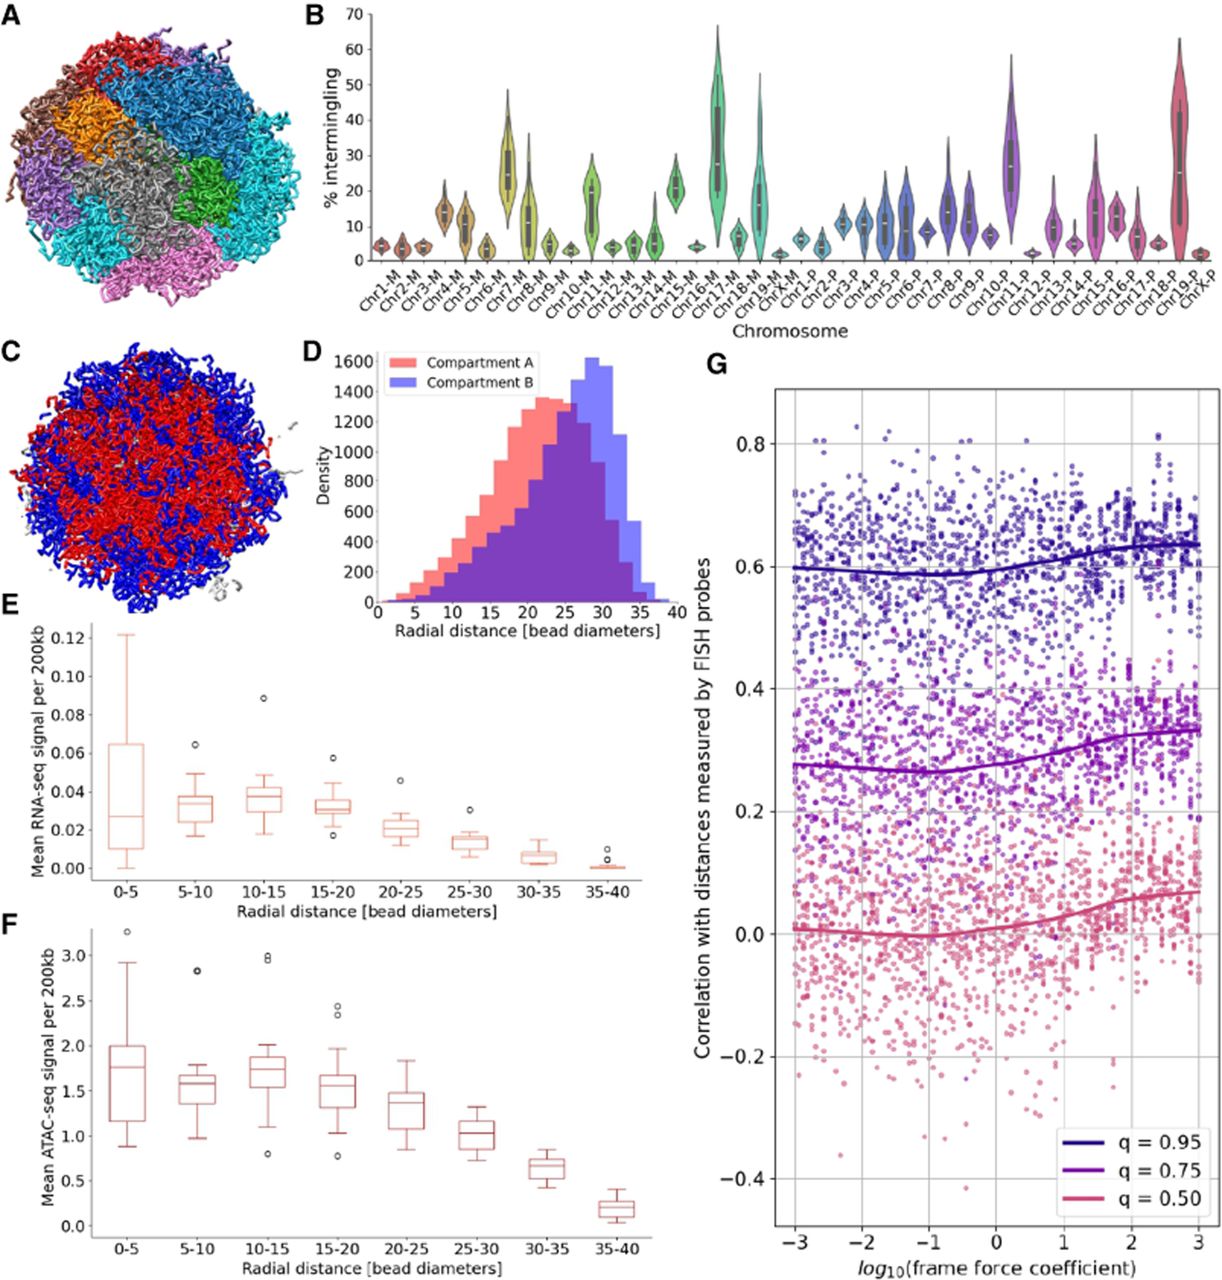
The results of this analysis are summarized in Figure 3B. We observed intermingling values ranging from ∼5% to 20%, consistent with previously reported ranges (Stevens et al. 2017; Meng et al. 2021). However, we note that some chromosomes in our diploid model exhibited a comparatively higher degree of intermingling. Using the same simulation, we also demonstrated that ChromMovie is capable of capturing key features of compartment segregation. Specifically, we observed that the transcriptionally active compartments A preferentially localize toward the nuclear center, whereas the B compartments tend to occupy the peripheral regions of the nucleus (Fig. 3C,D), a result consistent with previous studies (Su et al. 2020).
Additionally, ChAIR data provide a unique opportunity to simultaneously analyze single-cell contact data along with transcriptomic (RNA-seq) and chromatin accessibility (ATAC-seq) information. To assess whether our computational framework can generate meaningful spatial distributions for these genomic features, we conducted an integrative analysis using a subset of 15 Patski mouse cells. These cells were selected to meet the following criteria: (1) each contained at least 6000 chromatin contacts; (2) all three interphase stages (G1, S, and G2/M) were equally represented with five cells each; and (3) the selected cells formed a closed ring of consecutive points on the PCA plot in Figure 2A, representing a continuous trajectory through the cell cycle.
We performed a ChromMovie simulation at 200 kb resolution using 15 frames, each corresponding to one of the selected cells, thereby modeling a full cycle of cell progression. For each simulation frame, we computed the average number of single-cell RNA-seq reads mapped to chromatin beads as a function of their radial distance from the center of mass of the nucleus. The same analysis was repeated for the ATAC-seq signal.
We observed that both RNA-seq and ATAC-seq signals were most concentrated at close to intermediate radial distances from the nuclear center (five to 20 bead diameters), with the signal intensity gradually decreasing at larger distances (Fig. 3E,F).
These observations align with established biological knowledge: The nuclear periphery is typically associated with densely packed, transcriptionally inactive heterochromatin, whereas the nuclear interior is enriched with open, transcriptionally active euchromatin. Consequently, both higher ATAC-seq signal and RNA-seq read density are expected to localize closer to the nucleus center, reflecting regions of increased chromatin accessibility and active gene expression.
Validation with 3D-FISH
A widely used approach for validating 3D chromatin models is to compare their predictions with independent microscopy-based data (Li et al. 2023). Such methods include, among others, FISH, X-ray tomography, STORM, and DNA tracing techniques.
Here, following the example of several previous studies (Zhu and Wang 2019; Meng et al. 2021; Zha et al. 2021), we used the 3D-FISH data set from Beagrie et al. (2017) as an independent means of validating our methodology. This data set includes eight pairs of fluorescent probes located on Chromosomes 3 and 11, with each pair associated with a set of spatial distance measurements. For validation purposes, the median value of these distances was used, serving as a ground-truth reference for comparison with our modeled chromatin structures. Although 3D-FISH data were obtained from mouse embryonic stem cells (mESs), whereas contact data were derived from the Patski mouse fibroblast cell line, both data sets used for this validation originate from the mouse embryo.
We performed this validation using the same 15 mouse cells representing cell cycle progression as described in the previous section. Prior studies have commonly assessed model accuracy by computing the Pearson's correlation between the median 3D-FISH distances and the corresponding Euclidean distances derived from computationally reconstructed chromatin structures. However, because our data are diploid, we adapted this procedure to account for the presence of both maternal and paternal chromosome copies. Rather than computing a single Pearson's correlation, we evaluated all possible pairwise combinations of maternal and paternal chromosome copies for each probe pair. For each combination, we computed a Pearson's correlation, resulting in a distribution of correlation values for each probe pair.
From these distributions, we extracted quantiles at the 0.5, 0.75, and 0.95 levels to assess model performance. Although the specific chromosome pairing observed in the 3D-FISH experiment remains unknown, a more accurate chromatin model should exhibit increased values across these correlation quantiles, indicating stronger concordance with the experimentally derived spatial constraints.
We employed this approach to validate the core concept underlying ChromMovie, namely, the inclusion of an additional force that connects consecutive frames in the simulation. Using the aforementioned 15 mouse cells, we performed ChromMovie simulations across 100 different values of the frame force coefficient, ranging from 10−3 to 103, to determine whether this parameter could improve the concordance with 3D-FISH data and, therefore, enhance the accuracy of chromatin structure reconstruction.
Figure 3G presents the three quantiles (q = 0.5, q = 0.75, q = 0.95) of the correlation distributions between modeled distances and the experimental FISH probe distances, plotted against varying frame force coefficients. Across all quantiles, we observed that low frame force values, at which the force is effectively negligible, consistently resulted in weaker correlations with the FISH data. In contrast, higher frame force coefficients yielded stronger correlations, with the trend plateauing around 102, which is a value comparable to the coefficients of other force field components. To assess statistical significance, we performed Wilcoxon rank-sum tests comparing quantile values for simulations with kFF < 1 versus those with kFF ≥ 1. All quantiles yielded highly significant P-values (P < 10−10), confirming that the inclusion of the frame force significantly improves model performance. These results support the conclusion that applying temporal regularization across single-cell simulations, by linking frames, can meaningfully enhance the fidelity of chromatin structure reconstruction, as measured by agreement with independent 3D-FISH data.
Mitotic chromosome formation
We additionally tested whether our model can be applied to the study of mitotic chromosome formation. To this end, we used chicken DT-40 cells from Gibcus et al. (2018), a data set that has been employed in a number of studies, including recent work on chromatin structure and modeling (Contessoto et al. 2025), as well as DNA tracing of mitotic chromosomes (Beckwith et al. 2025a). In our study, we analyzed eight time points spanning from chemically induced G2 arrest through 60 min into prophase and prometaphase.
Because ChromMovie is primarily designed as a single-cell model, whereas the Hi-C data from Gibcus et al. (2018) represent bulk-averaged contact maps, we first down-sampled each Hi-C matrix to 500,000 contacts. We then applied the ChromMovie algorithm at 50 kb resolution to chicken Chromosome 4 to estimate the trajectory of chromosomal changes during mitotic chromosome formation. The results of this analysis are shown in Figure 4A.
Analysis of ChromMovie performance on mitotic chromosome formation. (A) Original Hi-C contact matrices (top row) and simulation distance matrices (bottom row) from eight time points of mitotic chromosome formation. Region consists of chicken Chr 4: 1–2,000,000. (B) Spearman's correlation of the original Hi-C matrix of a whole chicken Chromosome 4 and the model's inverse distance matrices. Different levels of weighted logarithm down-sampling are present from 100% representing all of the contacts retained to 10%. (C) Spearman's correlation of the ensemble inverse distance matrices to the original Hi-C (dark green). Spearman's correlation of the 20 individual inverse distance matrices to the original Hi-C (olive-green).
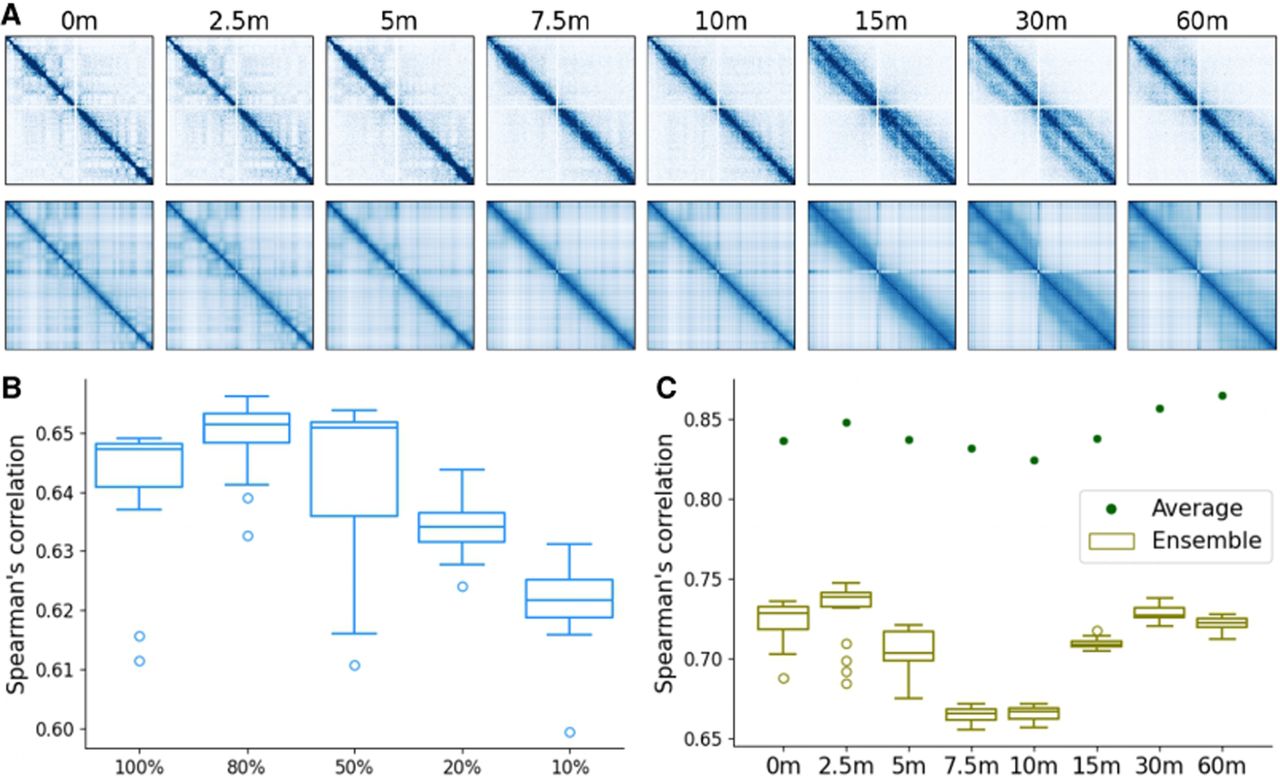
By comparing the original Hi-C maps with the distance matrices reconstructed from our model, we found that ChromMovie faithfully reproduces the main features of the experimental data. In particular, the model captures the progressive loss of compartmentalization and the increasing local chromatin compaction, as quantified by the radius of gyration (Fig. 4B).
Based on these results, we further investigated the robustness of our model to reduced data coverage by systematically down-sampling the input Hi-C maps. To this end, we applied a weighted logarithmic down-sampling scheme as described by Oliveira Junior et al. (2021b), retaining 100%, 80%, 50%, 20%, and 10% of contacts. Notably, these percentages refer to additional down-sampling of the Hi-C maps that had already been reduced to 500,000 contacts. We then assessed how down-sampling affected the model's ability to reproduce the original Hi-C data, as quantified by the Spearman's correlation between the experimental Hi-C matrices and the reconstructed distance matrices. The results of this analysis are shown in Figure 4B.
Finally, we performed an ensemble analysis to evaluate how well our model reproduces ensemble-level chromatin behavior. Starting from the original Hi-C maps, we randomly split all contacts into 20 equally sized submaps, each representing an ensemble member. By linking consecutive stages of mitotic chromosome formation, we applied ChromMovie independently to each subsample to generate ensembles of structural trajectories. The results of this analysis are shown in Figure 4C. For each trajectory and each time point, we computed the Spearman's correlation between the Hi-C contact matrices and the inverse of the corresponding structural distance matrices (using a simple 1/x transformation). We also performed an analogous comparison using the average of all inverted distance matrices and the same Hi-C maps. Although individual trajectories exhibited variable correlation with the original Hi-C data (approximately 0.66–0.75), the averaged distance matrices showed substantially higher agreement (correlation, 0.825–0.865). These results demonstrate that the model accurately reproduces ensemble behavior observed in bulk Hi-C data while preserving structural heterogeneity at the level of individual conformations.
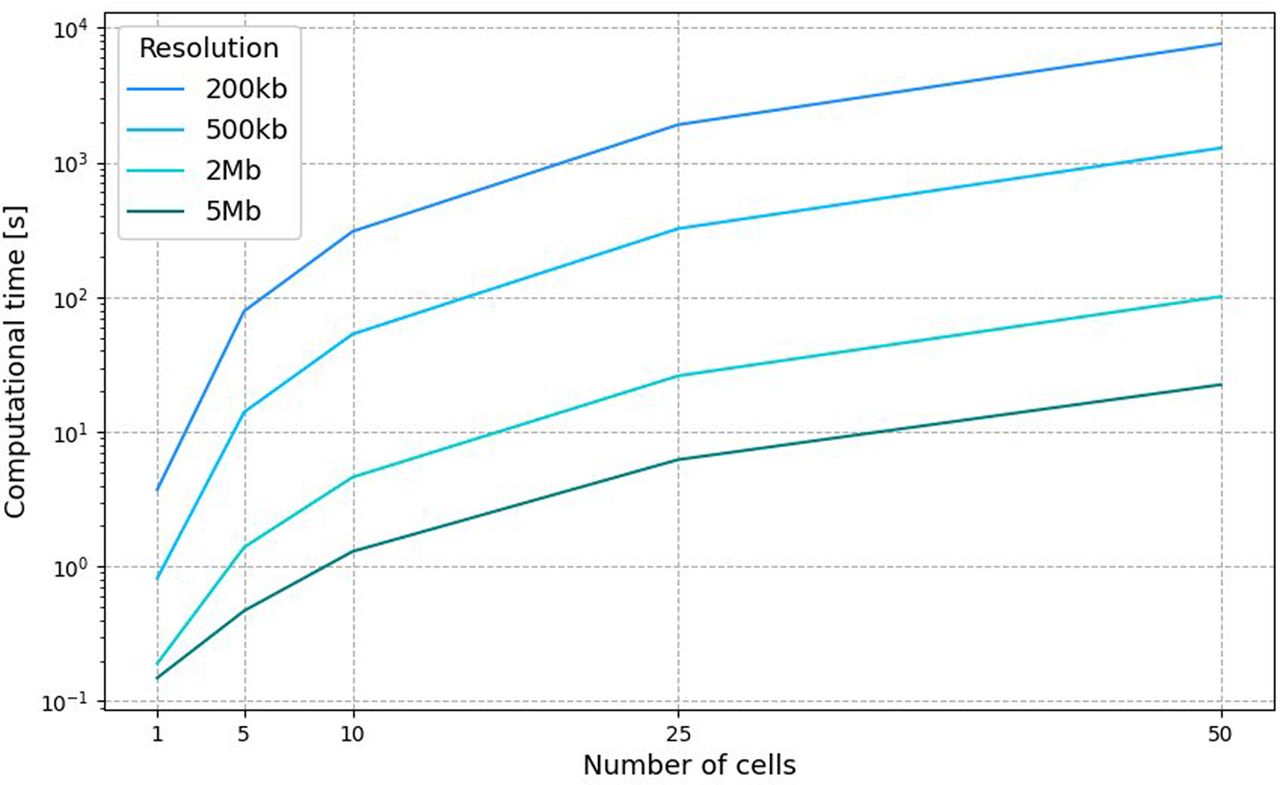
Computational time
We evaluated the computational time for the GPU simulation of the whole-genome ChromMovie simulation of the diploid mouse genome from Chai et al. (2025). Figure 5 shows the results of this analysis with respect to the number of cells used for the simulation and a number of resolutions: 5 Mb, 2 Mb, 500 kb, and 200 kb. All cells were selected so that their total number of contacts was around 2000 (±30). The calculations were performed on a single NVIDIA A100 GPU. We note that on average twofold increase of the simulation resolution and twofold increase in the number of cells in the simulation result in an approximately fourfold and approximately 2.5-fold increase in computational time, respectively.
Benchmarking of ChromMovie computational time on a single NVIDIA A100 GPU. For each number of cells, a multiresolution simulation was conducted for resolutions 5 Mb, 2 Mb, 500 kb, and 200 kb.
Discussion
The challenge of reconstructing chromatin folding at the chromosome level is a critical issue in biology and bioinformatics (Dekker and Mirny 2024). Significant attention has been given to deciphering the 3D chromatin structure at single-cell resolution, which reveals patterns related to the cell cycle and cell maturation (Nagano et al. 2017). In this work, we present ChromMovie: a comprehensive tool designed for studying 3D chromatin structures at the chromosome level throughout any linear cellular process, such as the cell cycle or cell maturation. Although some methods, like HSA (Zou et al. 2016), integrate multiple Hi-C data tracks, they primarily focus on integrating data from different restriction enzymes rather than incorporating single-cell information within the context of a specific cellular process. This focus on cellular process context is a core innovation of ChromMovie, and we consider it a novel contribution to the field. We believe that our software will be valuable for researchers studying the changes in 3D chromatin structure during various cellular processes.
We demonstrated that the frame force, a novel feature of our method compared with other approaches, improves the quality of chromatin structure reconstruction, both in the in silico studies and in real single-cell data. Additionally, we showed that ChromMovie effectively recreates chromosome compaction during cell cycle progression in a manner comparable to existing methods. Furthermore, we demonstrated that ChromMovie achieves reduced variance in single-cell structures, potentially capturing more biologically meaningful chromatin conformational changes.
In creating ChromMovie, we drew inspiration from various methods for 3D chromatin structure reconstruction that were developed previously (Banecki et al. 2024). A particularly influential model for us was NucDynamics (Stevens et al. 2017), which we emulated in several ways. In our algorithm, we aimed to incorporate the best practices from earlier models that provided valuable insights into single-cell chromatin dynamics. These practices include hierarchical modeling, manipulation of the excluded volume (EV) force, contact force proportional to the number of contacts in a bin, and the use of different formulas for attractive forces with linearization for long distances. ChromMovie represents an attempt to combine these established practices from the scHi-C modeling field into a novel idea of simultaneous scHi-C modeling.
As a model primarily designed for single-cell contact data, ChromMovie is relatively robust to the sparse coverage typical of single-cell and multiomics studies (e.g., Chai et al. 2025). In principle, ChromMovie could also be applied to other poorly sampled contact data sets, such as PaleoHi-C (Sandoval-Velasco et al. 2024), to help elucidate specific cellular processes captured in these experiments.
We also believe that both the fields of 3D chromatin modeling from single-cell Hi-C data (or from 3D contact data in general) and cellular TI methods can benefit from the development of joint models that leverage the strengths of both fields. To the best of our knowledge, ChromMovie is the first attempt at such a fusion. By developing ChromMovie, we aim to contribute to a more holistic approach to modeling chromatin changes in the context of the specific cellular processes they undergo. Finally, ChromMovie was designed to work with single-cell Hi-C data that have already been ordered in a linear fashion. Although this linear assumption is suitable for modeling processes like cell maturation, it may not capture the full scope of the spatiotemporal relationships between cells engaged in various cellular processes. We believe that, in the future, methods that incorporate a broader range of cellular trajectory topologies will be valuable to researchers studying chromatin structure dynamics at the single-cell level.
Model limitations
As a single-cell model, ChromMovie places less emphasis on explicitly generating structural ensembles than approaches based on averaged Hi-C data, such as maximum entropy methods. This focus also limits the model's ability to extrapolate results to previously unseen data sets. Although this limitation is shared by most single-cell modeling approaches and can be partially mitigated by running ChromMovie on multiple single-cell Hi-C contact maps to generate a natural ensemble, it remains an important distinction. In contrast to averaged Hi-C modeling strategies, which rely heavily on distribution estimation and ensemble sampling, ChromMovie emphasizes the reconstruction of individual chromatin conformations.
Methods
We identified three fundamental approaches for MD simulations of chromatin structures based on multiple scHi-C maps, which are graphically illustrated in Figure 6, C through E.
Independent approach: Each scHi-C map is processed separately using any existing chromatin reconstruction method, without incorporating information from other maps.
Sequential approach: Modeling begins with the first scHi-C map in the presumed order. The output of each simulation serves as the starting structure for the next, incorporating constraints from the subsequent scHi-C map.
Semidependent approach: Each scHi-C map is modeled with its own set of constraints, but additional restraints ensure that structures from consecutive maps remain spatially aligned by applying forces that link corresponding chromatin beads.
Overview of the ChromMovie algorithm. (A) The algorithm takes an ordered list of scHi-C maps representing different time points of a cellular process. It then simulates all time points simultaneously, generating an ordered list of 3D structures as the result. (B) The four main types of forces used in the ChromMovie simulation: repulsive forces, backbone forces, contact forces, and frame forces. (C–E) Three approaches to modeling multiple ordered scHi-C maps: independent modeling (C), sequential modeling (D), and parallel simultaneous modeling (E). ChromMovie implements a form of simultaneous modeling, which, to our knowledge, is the first of its kind in the field of chromatin modeling.
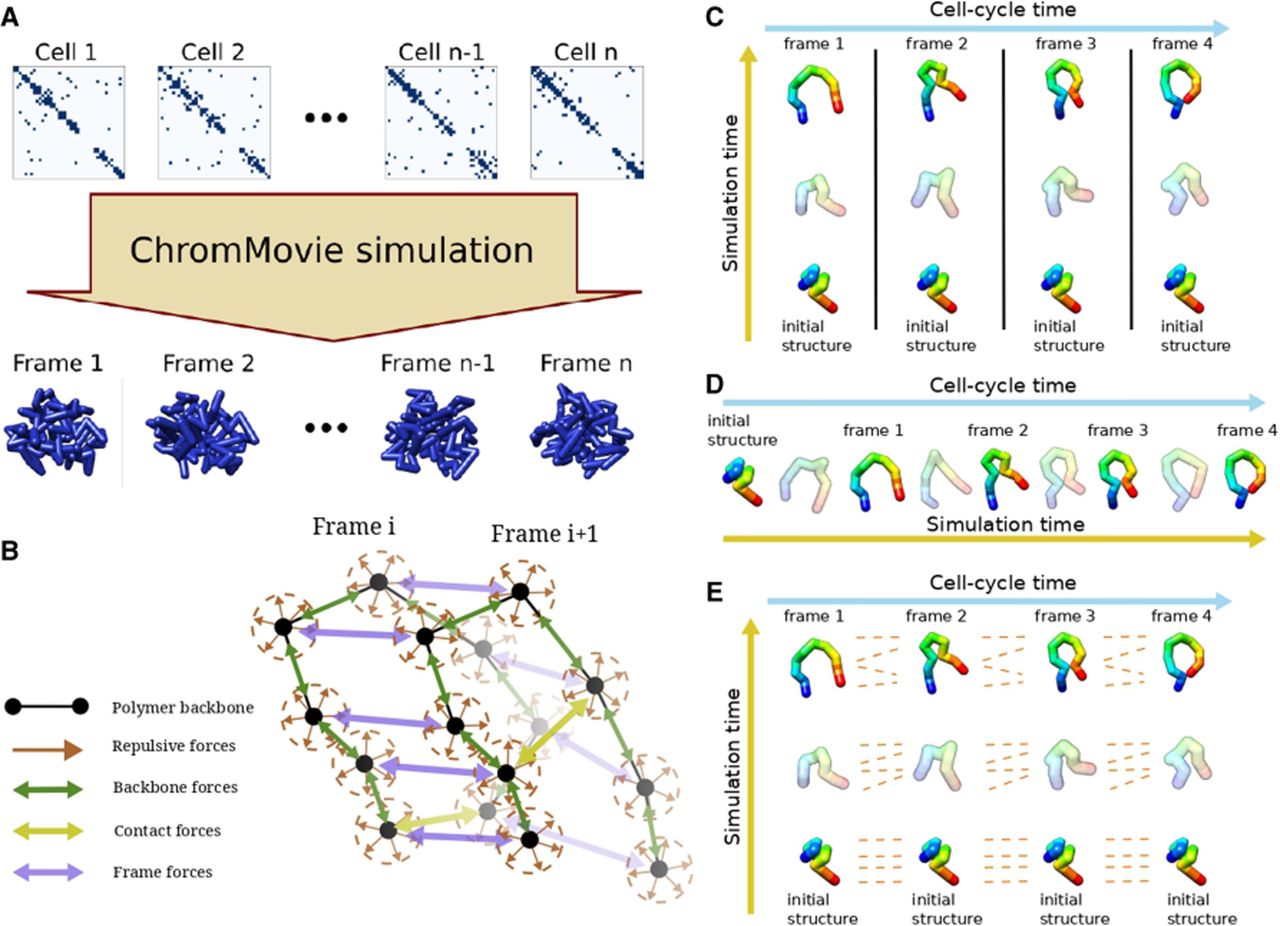
The two alternative approaches aim to reduce the risk of overfitting while incorporating contextual information from neighboring scHi-C maps. The sequential approach achieves this by explicitly integrating structural information from previous frames, using each reconstructed chromatin structure as the starting point for the next phase of modeling. As a result, although indirectly, information from all preceding frames influences the reconstruction of a given frame.
However, although the independent approach disregards both preceding and subsequent frames when modeling single-cell chromatin structures, the sequential approach also fails to incorporate information from later frames that could further refine the reconstruction. To fully leverage the available information encoded in cellular trajectories, we developed a third strategy: the simultaneous approach (Fig. 6E). By introducing connections between consecutive frames along the cellular trajectory, this approach utilizes information from both earlier and later pseudo–time points. ChromMovie is the first method designed to integrate this temporal context, enhancing the accuracy of single-cell chromatin conformation reconstruction while capturing its dynamic changes throughout a cellular process.
Force field
As outlined in a recent review (Banecki et al. 2024), most existing methods for 3D chromatin structure reconstruction define their potential function using a few fundamental components. These typically include repulsive forces applied to all possible pairs of chromatin beads, as well as attractive forces. The attractive forces are primarily applied to (1) the chromatin polymer backbone, ensuring connectivity between consecutive beads along the chromatin chain, and (2) interactions between beads linked by scHi-C contacts. Our simulation follows this general force field framework while introducing an additional fourth type of force (Fig. 6B). This force is designed to connect corresponding chromatin beads across different pseudo–time frames, capturing the continuity of chromatin dynamics during processes such as the cell cycle or cell maturation.
Let n be the number of pseudo–time frames to be modeled and m the number of chromatin beads in each frame. The input to our simulation consists of an ordered list of n binary matrices each of size m × m, encoding the loci connected by single-cell contacts. Let vi,j = (xi,j, yi,j, zi,j) denote the 3D position of the jth chromatin bead of the ith pseudo–time frame, corresponding to the single-cell contact matrix . Furthermore, let d(v1, v2) represent the Euclidean distance between the vectors v1 and v2.
With these definitions, the four main components of our general potential function, in its simplest form, are as follows:
First, the strict harmonic potential is often considered too stringent, as it can strongly influence simulation dynamics (Zhu and Wang 2019). This potential function rapidly increases to large values with even small deviations from the optimal target distance dopt, which could lead to significant conflicts with other forces in the system and make it harder for the simulation to reach a satisfactory potential optimum. To address this issue, ChromMovie incorporates several effective strategies from previous studies. One such strategy is replacing parts of the quadratic function with linear sections. This is done by introducing a “flat bottom” potential between 0.8 · dopt and 1.2 · dopt (similar to the method of Stevens et al. 2017) or approximating the quadratic function with a linear function for larger distances (e.g., Nagano et al. 2013 or Stevens et al. 2017). These modifications create a less stringent restraint, allowing for a wider range of possible distances and a more gradual increase in energy when the distance requirement is not met during the simulation. Finally, if an upper limit on the force is required, a Gaussian potential can also be used (as in the work of Zhu and Wang 2019). In ChromMovie, the choice between using Gaussian, harmonic, or harmonic with linear end potentials is left to the user.
Following the example of several previous methods (e.g., Szalaj et al. 2016; Stevens et al. 2017; Rosenthal et al. 2019; Meng et al. 2021; Rothörl et al. 2023), ChromMovie is also a hierarchical model. Starting at the lowest resolution, the simulation is performed at each resolution specified by the user. After each round of MD simulation, the resulting structure is interpolated so that the number of beads in the structure matches the corresponding resolution. Naturally, the optimal distances for all forces must be rescaled after each resolution change and interpolation. In this case, we assumed that the optimal distances provided by the user represent the distances between beads at the final (and lowest) resolution. The optimal distances for intermediate resolutions are determined using a power–law relationship with a coefficient of 1/3 to ensure a smooth transition between resolutions.
The final improvement pertains to the handling of single-cell contact information. An enhancement to the classical MD chromatin simulation involves tuning the optimal distance for single-cell contacts according to the number of contacts in the corresponding scHi-C map entry. This allows us to effectively utilize the number of contacts between each pair of beads without resorting to the binarization of contact matrices, as seen in some previous methods (Hirata et al. 2016). Following the approach outlined by Stevens et al. (2017), we set the optimal distance for contact loci to be proportional to c−1/3, where c is the number of contacts between two chromatin beads. Additionally, ChromMovie offers an optional feature that discards “violated” contacts, those for which the 3D distance fails to converge to the desired range within the simulation time.
Simulation
The MD simulation in ChromMovie is performed using a standard Langevin integrator. The initial structure for the simulation is a self-avoiding random walk. To avoid issues with initial discordance and violations of the forces that connect consecutive cellular beads, the same initial structure is applied to all frames. The simulation is performed hierarchically, meaning that after the simulation is over for a particular resolution, the structure beads are interpolated in preparation for the next phase of the simulation with a finer resolution. Each simulation phase is parallelized to enhance computational time and take advantage of GPU computing.
Avoiding local minima in simulations is a common challenge, particularly in MD simulations and optimization tasks. In our algorithm, the goal of a successful cellular trajectory reconstruction is to satisfy the restraints on chromatin backbone closeness, single-cell contacts, and the forces keeping consecutive cellular frames together. The force counteracting these restraints is the EV force, which is applied to all structure beads within a given frame (but not between frames).
To enhance the algorithm's ability to reach the potential minimum without violating the imposed restraints, some models (e.g., Rothörl et al. 2023) gradually reinforce the force coefficients throughout the simulation. Based on this idea, we have found that adjusting coefficients during simulation may help the model satisfy single-cell restraints (see Results). ChromMovie allows users to enable or disable gradual reinforcement of the coefficients across all four force field components. The coefficient reinforcement scheme is similar to the one used by Stevens et al. (2017) and is based on arctan function. During the simulation, the initial coefficient kXX,init specified by the user is multiplied by this function, starting with a small coefficient and gradually reaching the full value of kXX,init toward the end, as described below:
Here the f is the elapsed proportion of simulation, and α is the parameter controlling the steepness of the transition. In our model we used α = 10, same as by Stevens et al. (2017).
The compartments used in this study were taken from the 4D Nucleome data portal (https://data.4dnucleome.org/) and are freely accessible under the accession code 4DNFI24OBK5V. The ChAIR data from Chai et al. (2025) is accessible from the National Genomics Data Center (NGDC) BioProject database (https://ngdc.cncb.ac.cn/bioproject/) under accession number PRJCA024774. The mitotic transition data from Gibcus et al. (2018) are accessible from the NCBI Gene Expression Omnibus (GEO; https://www.ncbi.nlm.nih.gov/geo/) under accession number GSE102740.
Visualizations of in silico and ChromMovie structures in Figure 6, panels A, C, D, and E; Figure 1A; Figure 2, panels E and F; and Figure 3, panels A and C were performed using the UCSF Chimera software (Pettersen et al. 2004).
The exact parameters used for each of the ChromMovie simulations described in this paper are provided in Supplemental Methods.
Code availability
ChromMovie source code is publicly available at GitHub (https://github.com/SFGLab/ChromMovie) and as Supplemental Code.
Competing interest statement
The authors declare no competing interests.
Acknowledgments
Research was funded by Warsaw University of Technology within the Excellence Initiative: Research University (IDUB) program. This work has been supported by Polish National Science Centre (2020/37/B/NZ2/03757). H.C. was supported by the National Natural Science Foundation of China (NNSFC) (32400426). Y.R. was supported by the NNSFC (32250710678). Computations were performed thanks to the Laboratory of Bioinformatics and Computational Genomics, Faculty of Mathematics and Information Science, Warsaw University of Technology using Artificial Intelligence HPC platform financed by Polish Ministry of Science and Higher Education (decision no. 7054/IA/SP/2020 of 2020-08-28). The work was cosupported by National Institute of Health USA 4DNucleome grant 1U54DK107967-01 and “Nucleome Positioning System for Spatiotemporal Genome Organization and Regulation.”
Author contributions: K.H.B. and D.P. conceived the idea of the study. K.H.B. implemented the method and conducted the experiments. K.H.B. and D.P. analyzed the results. K.H.B., H.C., Y.R., and D.P. wrote and reviewed the manuscript.
Notes
[1] Supplementary material [Supplemental material is available for this article.]
[2] Article published online before print. Article, supplemental material, and publication date are at https://www.genome.org/cgi/doi/10.1101/gr.280985.125.
[3] Freely available online through the Genome Research Open Access option.
References
- ↵Abbas A, He X, Niu J, Zhou B, Zhu G, Ma T, Song J, Gao J, Zhang MQ, Zeng J. 2019. Integrating Hi-C and FISH data for modeling of the 3D organization of chromosomes. Nat Commun 10: 2049. 10.1038/s41467-019-10005-6
- ↵Angel JC, El Amraoui N, Gürsoy G. 2025. pC-SAC: a method for high-resolution 3D genome reconstruction from low-resolution Hi-C data. Nucleic Acids Res 53: gkaf289. 10.1093/nar/gkaf289
- ↵Arsuaga J, Jayasinghe RG, Scharein RG, Segal MR, Stolz RH, Vazquez M. 2015. Current theoretical models fail to predict the topological complexity of the human genome. Front Mol Biosci 2: 48. 10.3389/fmolb.2015.00048
- ↵Bacher R, Kendziorski C. 2016. Design and computational analysis of single-cell RNA-sequencing experiments. Genome Biol 17: 63. 10.1186/s13059-016-0927-y
- ↵Banecki K, Korsak S, Plewczynski D. 2024. Advancements and future directions in single-cell Hi-C based 3D chromatin modeling. Comput Struct Biotechnol J 23: 3549–3558. 10.1016/j.csbj.2024.09.026
- ↵Beagrie RA, Scialdone A, Schueler M, Kraemer DCA, Chotalia M, Xie SQ, Barbieri M, De Santiago I, Lavitas LM, Branco MR, 2017. Complex multi-enhancer contacts captured by genome architecture mapping. Nature 543: 519–524. 10.1038/nature21411
- ↵Beckwith KS, Brunner A, Morero NR, Jungmann R, Ellenberg J. 2025a. Nanoscale DNA tracing reveals the self-organization mechanism of mitotic chromosomes. Cell 188: 2656–2669.e17. 10.1016/j.cell.2025.02.028
- ↵Beckwith KS, Ødegård-Fougner Ø, Morero NR, Barton C, Schueder F, Tang W, Alexander S, Peters JM, Jungmann R, Birney E, 2025b. Nanoscale 3D DNA tracing in non-denatured cells resolves the cohesin-dependent loop architecture of the genome in situ. Nat Commun 16: 6673. 10.1038/s41467-025-61689-y
- ↵Bintu B, Mateo LJ, Su JH, Sinnott-Armstrong NA, Parker M, Kinrot S, Yamaya K, Boettigerand AN, Zhuang X. 2018. Super-resolution chromatin tracing reveals domains and cooperative interactions in single cells. Science 362: 139–148. 10.1126/science.aau1783
- ↵Brackey CA, Marenduzzo D, Gilbert N. 2020. Mechanistic modeling of chromatin folding to understand function. Nat Methods 17: 767–775. 10.1038/s41592-020-0852-6
- ↵Cannoodt R, Saelens W, Saeys Y. 2016. Computational methods for trajectory inference from single-cell transcriptomics. Eur J Immunol 46: 2496–2506. 10.1002/eji.201646347
- ↵Carstens S, Nilges M, Habeck M. 2016. Inferential structure determination of chromosomes from single-cell Hi-C data. PLoS Comput Biol 12: e1005292. 10.1371/journal.pcbi.1005292
- ↵Caudai C, Salerno E. 2024. Complementing Hi-C information for 3D chromatin reconstruction by ChromStruct. Front Bioinform 3: 1287168. 10.3389/fbinf.2023.1287168
- ↵Caudai C, Zoppè M, Tonazzini A, Merelli I, Salerno E. 2021. Integration of multiple resolution data in 3D chromatin reconstruction using chromStruct. Biology (Basel) 10: 338. 10.3390/biology10040338
- ↵Chai H, Huang X, Xiong G, Huang J, Pels KK, Meng L, Han J, Tang D, Pan G, Deng L, 2025. Tri-omic single-cell mapping of the 3D epigenome and transcriptome in whole mouse brains throughout the lifespan. Nat Methods 22: 994–1007. 10.1038/s41592-025-02658-7
- ↵Cheng RR, Contessoto VG, Lieberman-Aiden E, Wolynes PG, Di Pierro M, Onuchic JN. 2020. Exploring chromosomal structural heterogeneity across multiple cell lines. eLife 9: e60312. 10.7554/eLife.60312
- ↵Contessoto VG, Oliveira ABJr, Brahmachari S, Wolynes PG, Di Pierro M, Onuchic JN. 2025. Energy landscape analysis of the development of the chromosome structure across the cell cycle. Proc Natl Acad Sci 122: e2425225122. 10.1073/pnas.2425225122
- ↵Cremer T, Cremer M, Hübner B, Strickfaden H, Smeets D, Popken J, Sterr M, Markaki Y, Rippe K, Cremer C. 2015. The 4D nucleome: evidence for a dynamic nuclear landscape based on co-aligned active and inactive nuclear compartments. FEBS Lett 589: 2931–2943. 10.1016/j.febslet.2015.05.037
- ↵Cremer T, Cremer M, Hübner B, Silahtaroglu A, Hendzel M, Lanctôt C, Strickfaden H, Cremer C. 2020. The interchromatin compartment participates in the structural and functional organization of the cell nucleus. Bioessays 42: e1900132. 10.1002/bies.201900132
- ↵Dautle MA, Chen Y. 2025. Single-cell Hi-C technologies and computational data analysis. Adv Sci 12: e2412232. 10.1002/advs.202412232
- ↵Deconinck L, Cannoodt R, Saelens W, Deplancke B, Saeys Y. 2021. Recent advances in trajectory inference from single-cell omics data. Curr Opin Syst Biol 27: 100344. 10.1016/j.coisb.2021.05.005
- ↵Dekker J, Mirny LA. 2024. The chromosome folding problem and how cells solve it. Cell 187: 6424–6450. 10.1016/j.cell.2024.10.026
- ↵Di Pierro M, Zhang B, Lieberman-Aiden E, Wolynes PG, Onuchic JN. 2016. Transferable model for chromosome architecture. Proc Natl Acad Sci 113: 12168–12173. 10.1073/pnas.161360711
- ↵Di Pierro M, Cheng RR, Lieberman-Aiden E, Wolynes PG, Onuchic JN. 2017. De novo prediction of human chromosome structures: epigenetic marking patterns encode genome architecture. Proc Natl Acad Sci 114: 12126–12131. 10.1073/pnas.1714980114
- ↵Du JH, Chen T, Gao M, Wang J. 2024. Joint trajectory inference for single-cell genomics using deep learning with a mixture prior. Proc Natl Acad Sci 121: e2316256121. 10.1073/pnas.231625612
- ↵Eastman P, Galvelis R, Peláez RP, Abreu CRA, Farr SE, Gallicchio E, Gorenko A, Henry MM, Hu F, Huang J, 2024. OpenMM 8: molecular dynamics simulation with machine learning potentials. J Phys Chem B 128: 109–116. 10.1021/acs.jpcb.3c06662
- ↵Fang T, Liu Y, Woicik A, Lu M, Jha A, Wang X, Li G, Hristov B, Liu Z, Xu H, 2024. Enhancing Hi-C contact matrices for loop detection with Capricorn: a multiview diffusion model. Bioinformatics 40: i471–i480. 10.1093/bioinformatics/btae211
- ↵Flyamer IM, Gassler J, Imakaev M, Brandão HB, Ulianov SV, Abdennur N, Razin SV, Mirny LA, Tachibana-Konwalski K. 2017. Single-nucleus Hi-C reveals unique chromatin reorganization at oocyte-to-zygote transition. Nature 544: 110–114. 10.1038/nature21711
- ↵Fullwood MJ, Wei CL, Liu ET, Ruan Y. 2009. Next-generation DNA sequencing of paired-end tags (PET) for transcriptome and genome analyses. Genome Res 19: 521–532. 10.1101/gr.074906.107
- ↵Galitsyna AA, Gelfand MS. 2021. Single-cell Hi-C data analysis: safety in numbers. Brief Bioinform 22: bbab316. 10.1093/bib/bbab316
- ↵Gao R, Ferraro TN, Chen L, Zhang S, Chen Y. 2025. Enhancing single-cell and bulk Hi-C data using a generative transformer model. Biology (Basel) 14: 288. 10.3390/biology14030288
- ↵Gibcus JH, Samejima K, Goloborodko A, Samejima I, Naumova N, Nuebler J, Kanemaki MT, Xie L, Paulson JR, Earnshaw WC, 2018. A pathway for mitotic chromosome formation. Science 359: eaao6135. 10.1126/science.aao6135
- ↵Harris HL, Gu H, Olshansky M, Wang A, Farabella I, Eliaz Y, Kalluchi A, Krishna A, Jacobs M, Cauer G, 2023. Chromatin alternates between A and B compartments at kilobase scale for subgenic organization. Nat Commun 14: 3303. 10.1038/s41467-023-38429-1
- ↵Hildebrand EM, Polovnikov K, Dekker B, Liu Y, Lafontaine DL, Fox AN, Li Y, Venev SV, Mirny LA, Dekker J. 2024. Mitotic chromosomes are self-entangled and disentangle through a topoisomerase-II-dependent two-stage exit from mitosis. Mol Cell 84: 1422–1441.e14. 10.1016/j.molcel.2024.02.025
- ↵Hirata Y, Oda A, Ohta K, Aihara K. 2016. Three-dimensional reconstruction of single-cell chromosome structure using recurrence plots. Sci Rep 6: 34982. 10.1038/srep34982
- ↵Hong Y, Li H, Long C, Liang P, Zhou J, Zuo Y. 2024. An increment of diversity method for cell state trajectory inference of time-series scRNA-seq data. Fundam Res 4: 770–776. 10.1016/j.fmre.2024.01.020
- ↵Hsieh TH, Weiner A, Lajoie B, Dekker J, Friedman N, Rando OJ. 2015. Mapping nucleosome resolution chromosome folding in yeast by micro-C. Cell 162: 108–119. 10.1016/j.cell.2015.05.048
- ↵Jerkovic I, Cavalli G. 2021. Understanding 3D genome organization by multidisciplinary methods. Nat Rev Mol Cell Biol 22: 511–528. 10.1038/s41580-021-00362-w
- ↵Jiang Q, Zhang S, Wan L. 2022. Dynamic inference of cell developmental complex energy landscape from time series single-cell transcriptomic data. PLoS Comput Biol 18: e1009821. 10.1371/journal.pcbi.1009821
- ↵Kadlof M, Banecki K, Chiliński M, Plewczynski D. 2024. Chromatin image-driven modelling. Methods 226: 54–60. 10.1016/j.ymeth.2024.04.006
- ↵Kim HJ, Yardımcı GG, Bonora G, Ramani V, Liu J, Qiu R, Lee C, Hesson J, Ware CB, Shendure J, 2020. Capturing cell type-specific chromatin compartment patterns by applying topic modeling to single-cell Hi-C data. PLoS Comput Biol 16: e1008173. 10.1371/journal.pcbi.1008173
- ↵Kos PI, Galitsyna AA, Ulianov SV, Gelfand MS, Razin SV, Chertovich AV. 2021. Perspectives for the reconstruction of 3D chromatin conformation using single cell Hi-C data. PLoS Comput Biol 17: e1009546. 10.1371/journal.pcbi.1009546
- ↵Krzak M, Raykov Y, Boukouvalas A, Cutillo L, Angelini C. 2019. Benchmark and parameter sensitivity analysis of single-cell RNA sequencing clustering methods. Front Genet 10: 1253. 10.3389/fgene.2019.01253
- ↵Lacen AN, Lee HT. 2024. Tracing the chromatin: from 3C to live-cell imaging. Chem Biomed Imaging 2: 659–682. 10.1021/cbmi.4c00033
- ↵Lajoie BR, Dekker J, Kaplan N. 2015. The hitchhiker's guide to Hi-C analysis: practical guidelines. Methods 72: 65–75. 10.1016/j.ymeth.2014.10.031
- ↵Lao Z, Kamat K, Jiang Z, Zhang B. 2024. OpenNucleome for high resolution nuclear structural and dynamical modeling. eLife 13: RP93223. 10.7554/eLife.93223
- ↵Li Z, Portillo-Ledesma S, Schlick T. 2023. Techniques for and challenges in reconstructing 3D genome structures from 2D chromosome conformation capture data. Curr Opin Cell Biol 83: 102209. 10.1016/j.ceb.2023.102209
- ↵Lieberman-Aiden E, Van Berkum NL, Williams L, Imakaev M, Ragoczy T, Telling A, Amit I, Lajoie BR, Sabo PJ, Dorschner MO, 2009. Comprehensive mapping of long-range interactions reveals folding principles of the human genome. Science 326: 289–293. 10.1126/science.1181369
- ↵Lyu H, Liu E, Wu Z, Li Y, Liu Y, Yin X. 2022. scHiCPTR: unsupervised pseudotime inference through dual graph refinement for single-cell Hi-C data. Bioinformatics 38: 5151–5159. 10.1093/bioinformatics/btac670
- ↵Ma R, Huang J, Jiang T, Ma W. 2024. A mini-review of single-cell Hi-C embedding methods. Comput Struct Biotechnol J 23: 4027–4035. 10.1016/j.csbj.2024.11.002
- ↵MacKay K, Kusalik A. 2020. Computational methods for predicting 3D genomic organization from high-resolution chromosome conformation capture data. Brief Funct Genomics 19: 292–308. 10.1093/bfgp/elaa004
- ↵Meluzzi D, Arya G. 2020. Computational approaches for inferring 3D conformations of chromatin from chromosome conformation capture data. Methods 181-182: 24–34. 10.1016/j.ymeth.2019.08.008
- ↵Meng L, Wang C, Shi Y, Luo Q. 2021. Si-C is a method for inferring super-resolution intact genome structure from single-cell Hi-C data. Nat Commun 12: 4369. 10.1038/s41467-021-24662-z
- ↵Menon R, Chowdhury M, Oluwadare O. 2025. ScHiCAtt: enhancing single-cell Hi-C data resolution using attention-based models. Comput Struct Biotechnol J 27: 978–991. 10.1016/j.csbj.2025.02.031
- ↵Mumbach MR, Rubin AJ, Flynn RA, Dai C, Khavari PA, Greenleaf WJ, Chang HY. 2016. HiChIP: efficient and sensitive analysis of protein-directed genome architecture. Nat Methods 13: 919–922. 10.1038/nmeth.3999
- ↵Nagano T, Lubling Y, Stevens TJ, Schoenfelder S, Yaffe E, Dean W, Laue ED, Tanay A, Fraser P. 2013. Single-cell Hi-C reveals cell-to-cell variability in chromosome structure. Nature 502: 59–64. 10.1038/nature12593
- ↵Nagano T, Lubling Y, Várnai C, Dudley C, Leung W, Baran Y, Mendelson-Cohen N, Wingett S, Fraser P, Tanay A. 2017. Cell-cycle dynamics of chromosomal organisation at single-cell resolution. Nature 547: 61–67. 10.1038/nature23001
- ↵Oliveira Junior AB, Contessoto VG, Mello MF, Onuchic JN. 2021a. A scalable computational approach for simulating complexes of multiple chromosomes. J Mol Biol 433: 166700. 10.1016/j.jmb.2020.10.034
- ↵Oliveira Junior AB, Estrada CP, Lieberman-Aiden E, Contessoto VG, Onuchic JN. 2021b. Chromosome modeling on downsampled Hi-C maps enhances the compartmentalization signal. J Phys Chem B 125: 8757–8767. 10.1021/acs.jpcb.1c04174
- ↵Oluwadare O, Highsmith M, Cheng J. 2019. An overview of methods for reconstructing 3-D chromosome and genome structures from Hi-C data. Biol Proced Online 21: 7. 10.1186/s12575-019-0094-0
- ↵Paulsen J, Gramstad O, Collas P. 2015. Manifold based optimization for single-cell 3D genome reconstruction. PLoS Comput Biol 11: e1004396. 10.1371/journal.pcbi.1004396
- ↵Pettersen EF, Goddard TD, Huang CC, Couch GS, Greenblatt DM, Meng EC, Ferrin TE. 2004. UCSF chimera – a visualization system for exploratory research and analysis. J Comput Chem 25: 1605–1612. 10.1002/jcc.20084
- ↵Portillo-Ledesma S, Li Z, Schlick T. 2023. Genome modeling: from chromatin fibers to genes. Curr Opin Struct Biol 78: 102506. 10.1016/j.sbi.2022.102506
- ↵Quinodoz SA, Ollikainen N, Tabak B, Palla A, Schmidt JM, Detmar E, Lai MM, Shishkin AA, Bhat P, Takei Y, 2018. Higher-order inter-chromosomal hubs shape 3D genome organization in the nucleus. Cell 174: 744–757.e24. 10.1016/j.cell.2018.05.024
- ↵Ramani V, Deng X, Qiu R, Gunderson KL, Steemers FJ, Disteche CM, Noble WS, Duan Z, Shendure J. 2017. Massively multiplex single-cell Hi-C. Nat Methods 14: 263–266. 10.1038/nmeth.4155
- ↵Rao SSP, Huntley MH, Durand NC, Stamenova EK, Bochkov ID, Robinson JT, Sanborn AL, Machol I, Omer AD, Lander ES, 2014. A 3D map of the human genome at kilobase resolution reveals principles of chromatin looping. Cell 159: 1665–1680. 10.1016/j.cell.2014.11.021
- ↵Rosenthal M, Bryner D, Huffer F, Evans S, Srivastava A, Neretti N. 2019. Bayesian estimation of three-dimensional chromosomal structure from single-cell Hi-C data. J Comput Biol 26: 1191–1202. 10.1089/cmb.2019.0100
- ↵Rothörl J, Brems MA, Stevens TJ, Virnau P. 2023. Reconstructing diploid 3D chromatin structures from single cell Hi-C data with a polymer-based approach. Front Bioinform 3: 1284484. 10.3389/fbinf.2023.1284484
- ↵Saelens W, Cannoodt R, Todorov H, Saeys Y. 2019. A comparison of single-cell trajectory inference methods. Nat Biotechnol 37: 547–554. 10.1038/s41587-019-0071-9
- ↵Sandoval-Velasco M, Dudchenko O, Rodríguez JA, Pérez Estrada C, Dehasque M, Fontsere C, Mak SST, Khan R, Contessoto VG, Oliveira Junior AB, 2024. Three-dimensional genome architecture persists in a 52,000-year-old woolly mammoth skin sample. Cell 187: 3541–3562.e51. 10.1016/j.cell.2024.06.002
- ↵Sekelja M, Paulsen J, Collas P. 2016. 4D nucleomes in single cells: what can computational modeling reveal about spatial chromatin conformation? Genome Biol 17: 54. 10.1186/s13059-016-0923-2
- ↵Shi Y, Wan J, Zhang X, Liang T, Yin Y. 2024. ScCRT: a contrastive-based dimensionality reduction model for scRNA-seq trajectory inference. Brief Bioinform 25: bbae204. 10.1093/bib/bbae204
- ↵Shtengel G, Galbraith JA, Galbraith CG, Lippincott-Schwartz J, Gillette JM, Manley S, Sougrat R, Waterman CM, Kanchanawong P, Davidson MW, 2009. Interferometric fluorescent super-resolution microscopy resolves 3D cellular ultrastructure. Proc Natl Acad Sci 106: 3125–3130. 10.1073/pnas.0813131106
- ↵Smolander J, Junttila S, Elo LL. 2023. Cell-connectivity-guided trajectory inference from single-cell data. Bioinformatics 39: btad515. 10.1093/bioinformatics/btad515
- ↵Stegle O, Teichmann SA, Marioni JC. 2015. Computational and analytical challenges in single-cell transcriptomics. Nat Rev Genet 16: 133–145. 10.1038/nrg3833
- ↵Stevens TJ, Lando D, Basu S, Atkinson LP, Cao Y, Lee SF, Leeb M, Wohlfahrt KJ, Boucher W, O'Shaughnessy-Kirwan A, 2017. 3D structure of individual mammalian genomes studied by single cell Hi-C. Nature 544: 59–64. 10.1038/nature21429
- ↵Su JH, Zheng P, Kinrot SS, Bintu B, Zhuang X. 2020. Genome scale imaging of the 3D organization and transcriptional activity of chromatin. Cell 182: 1641–1659.e26. 10.1016/j.cell.2020.07.032
- ↵Szalaj P, Michalski PJ, Wróblewski P, Tang Z, Kadlof M, Mazzocco G, Ruan Y, Plewczynski D. 2016. 3D-GNOME: an integrated web service for structural modeling of the 3D genome. Nucleic Acids Res 44: W288–W293. 10.1093/nar/gkw437
- ↵Trzaskoma P, Ruszczycki B, Lee B, Pels KK, Krawczyk K, Bokota G, Szczepankiewicz AA, Aaron J, Walczak A, Śliwińska MA, 2020. Ultrastructural visualization of 3D chromatin folding using volume electron microscopy and DNA in situ hybridization. Nat Commun 11: 2120. 10.1038/s41467-020-15987-2
- ↵Wang Y, Cheng J. 2025. Reconstructing 3D chromosome structures from single-cell Hi-C data with SO(3)-equivariant graph neural networks. NAR Genom Bioinform 7: lqaf027. 10.1093/nargab/lqaf027
- ↵Wang Y, Guo Z, Cheng J. 2023. Single-cell Hi-C data enhancement with deep residual and generative adversarial networks. Bioinformatics 39: btad458. 10.1093/bioinformatics/btad458
- ↵Wettermann S, Brems M, Siebert JT, Vu GT, Stevens TJ, Virnau P. 2020. A minimal Gō-model for rebuilding whole genome structures from haploid single-cell Hi-C data. Comput Mater Sci 173: 109178. 10.1016/j.commatsci.2019.109178
- ↵Wu Y, Shi Z, Zhou X, Zhang P, Yang X, Ding J, Wu H. 2024. ScHiCyclePred: a deep learning framework for predicting cell cycle phases from single-cell Hi-C data using multi-scale interaction information. Commun Biol 7: 923. 10.1038/s42003-024-06626-3
- ↵Yang T, Wang S. 2024. Image-based 3D genomics through chromatin tracing. Nat Rev Method Primers 4: 76. 10.1038/s43586-024-00354-y
- ↵Yang R, Karbalayghareh A, Leslie CS. 2024. HiC2Self: self-supervised denoising for bulk and single-cell Hi-C contact maps. bioRxiv 10.1101/2024.11.21.624767
- ↵Ye Y, Gao L, Zhang S. 2019. Circular trajectory reconstruction uncovers cell-cycle progression and regulatory dynamics from single-cell Hi-C maps. Adv Sci 6: 1900986. 10.1002/advs.201900986
- ↵Zha M, Wang N, Zhang C, Wang Z. 2021. Inferring single-cell 3D chromosomal structures based on the Lennard-Jones potential. Int J Mol Sci 22: 5914. 10.3390/ijms22115914
- ↵Zhang R, Zhou T, Ma J. 2022a. Multiscale and integrative single-cell Hi-C analysis with Higashi. Nat Biotechnol 40: 254–261. 10.1038/s41587-021-01034-y
- ↵Zhang R, Zhou T, Ma J. 2022b. Ultrafast and interpretable single-cell 3D genome analysis with fast-Higashi. Cell Syst 13: 798–807.e6. 10.1016/j.cels.2022.09.004
- ↵Zhang Y, Tran D, Nguyen T, Dascalu SM, Harris FC. 2023. A robust and accurate single-cell data trajectory inference method using ensemble pseudotime. BMC Bioinform 24: 55. 10.1186/s12859-023-05179-2
- ↵Zhang K, Zhu J, Kong D, Zhang Z. 2024a. Modeling single cell trajectory using forward-backward stochastic differential equations. PLoS Comput Biol 20: e1012015. 10.1371/journal.pcbi.1012015
- ↵Zhang Y, Boninsegna L, Yang M, Misteli T, Alber F, Ma J. 2024b. Computational methods for analysing multiscale 3D genome organization. Nat Rev Genet 25: 123–141. 10.1038/s41576-023-00638-1
- ↵Zhen C, Wang Y, Geng J, Han L, Li J, Peng J, Wang T, Hao J, Shang X, Wei Z, 2022. A review and performance evaluation of clustering frameworks for single-cell Hi-C data. Brief Bioinform 23: bbac385. 10.1093/bib/bbac385
- ↵Zheng M, Tian SZ, Capurso D, Kim M, Maurya R, Lee B, Piecuch E, Gong L, Zhu JJ, Li Z, 2019. Multiplex chromatin interactions with single-molecule precision. Nature 566: 558–562. 10.1038/s41586-019-0949-1
- ↵Zheng Y, Shen S, Keleş S. 2022. Normalization and de-noising of single-cell Hi-C data with BandNorm and scVI-3D. Genome Biol 23: 222. 10.1186/s13059-022-02774-z
- ↵Zheng J, Yang Y, Dai Z. 2023. Subgraph extraction and graph representation learning for single cell Hi-C imputation and clustering. Brief Bioinform 25: bbad379. 10.1093/bib/bbad379
- ↵Zhou X, Wu H. 2025. scHiClassifier: a deep learning framework for cell type prediction by fusing multiple feature sets from single-cell Hi-C data. Brief Bioinform 26: bbaf009. 10.1093/bib/bbaf009
- ↵Zhou J, Ma J, Chen Y, Cheng C, Bao B, Peng J, Sejnowski TJ, Dixon JR, Ecker JR. 2019. Robust single-cell Hi-C clustering by convolution- and random-walk–based imputation. Proc Natl Acad Sci 116: 14011–14018. 10.1073/pnas.1901423116
- ↵Zhou T, Zhang R, Ma J. 2021. The 3D genome structure of single cells. Annu Rev Biomed Data Sci 4: 21–41. 10.1146/annurev-biodatasci-020121-084709
- ↵Zhu H, Wang Z. 2019. SCL: a lattice-based approach to infer 3D chromosome structures from single-cell Hi-C data. Bioinformatics 35: 3981–3988. 10.1093/bioinformatics/btz181
- ↵Zou C, Zhang Y, Ouyang Z. 2016. HSA: integrating multi-track Hi-C data for genome-scale reconstruction of 3D chromatin structure. Genome Biol 17: 40. 10.1186/s13059-016-0896-1