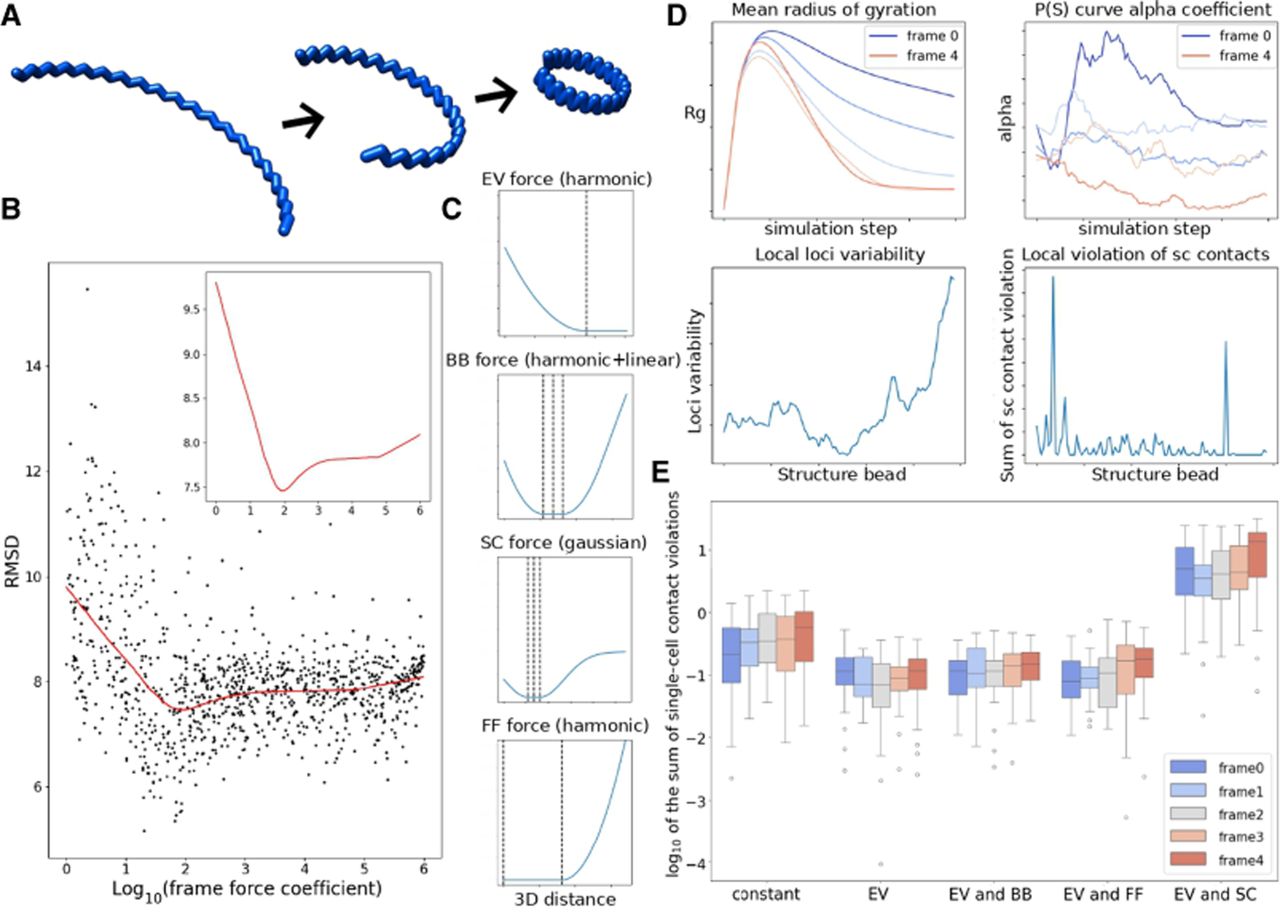
ChromMovie in silico analysis. (A) In silico example of a ring-forming, contracting zigzag structure used for initial validation. (B) Results of 1000 runs of the ChromMovie simulation on the in silico model. Root mean square deviation (RMSD) was used to compare with the original structure. The top right corner shows a zoomed-in view of the fitted Loess curve, indicating a clear minimum. (C) Examples of the force potentials used in ChromMovie. From top to bottom, harmonic excluded volume (EV) potential, harmonic backbone (BB) potential with linear approximation for larger distances, Gaussian single-cell (SC) potential, and harmonic frame force (FF) potential. (D) Selected diagnostic plots from the ChromMovie reporter. The mean radius of gyration indicates greater compaction for frames closer to the end, consistent with the original structure. P(s) curve allows for analysis of the contact frequency distribution. Local loci variability helps visualize regions of the structure that experience the greatest changes during the studied cellular process. (E) Single-cell contact violations across different ChromMovie runs, comparing cases with the gradual increase of the respective force coefficient turned on or kept constant.