

Abstract
The popularity of microRNA expression analyses is reflected by the existence of thousands of sRNA-seq studies in which matched total RNA-seq data are often unavailable. The lack of paired sequencing experiments limits the analysis of microRNA–gene regulatory networks. Here, we explore whether protein-coding gene expression can be quantified directly from transcript fragments present in sRNA-seq experiments. We analyze studies containing matched total RNA and small RNA from four human tissues and recover transcript fragments from the sRNA-seq data sets. We find that the expression levels of protein-coding gene transcripts derived from sRNA-seq data sets are comparable to those from total RNA-seq experiments (R2 ranging from 0.33 to 0.76). Analyses across multiple tissues and species show similar correlations, indicating that the approach is applicable across organisms. We confirm that transcript half-life and the expression of housekeeping or highly abundant genes do not bias the results. Analysis of the expression of both microRNAs and coding genes from the same sRNA-seq experiments demonstrates that known microRNA–target interactions are, as expected, inversely correlated with the expression profiles of these microRNA–mRNA pairs. For a dual mRNA/miRNA profile, we recommend sequencing the ≥25 nucleotide fraction at 5 million or more reads. To confirm the utility of this approach, we apply our method to breast cancer sRNA-seq data sets lacking total RNA-seq data and achieve 75% recall and 64% accuracy comparing inferred coding gene expression with qPCR-validated targets. Our findings demonstrate that quantifying mRNA fragments from sRNA-seq experiments provides a reliable approach to investigate microRNA–mRNA interactions when total RNA-seq is unavailable.
The analysis of gene expression is a cornerstone of functional genomics. Early works in molecular biology on gene expression were limited, because purified RNA is unstable and difficult to work with. However, the discovery (and use in the laboratory) of reverse transcriptase, permitting the controlled synthesis of RNAs into cDNAs (Maniatis et al. 1976), and the development of microarrays first (Schena et al. 1995) and high-throughput sequencing later (Margulies et al. 2005) boosted our capacity to analyze transcriptomes. Nowadays, the most common technique to analyze gene expression is RNA sequencing (RNA-seq). This technique consists of first isolating RNA from a sample, reverse-transcribing it into stable cDNA, and finally sequencing using (mostly) Illumina technology (Bentley et al. 2008). RNA-seq has multiple technical variations, either to identify specific types of transcripts or to characterize other RNA products. For instance, small RNA sequencing (sRNA-seq) is a specific technique to sequence small RNAs, mostly microRNAs (miRNAs) (Grimson et al. 2007; Ruby et al. 2007). To perform sRNA-seq, a size selection step is introduced, in which cDNA sequences are selected to be in a particular size range. Some sRNA-seq experiments are also coupled with ribosomal RNA (rRNA) depletion to ensure that the samples to be sequenced are enriched in miRNAs and not in rRNAs.
miRNAs are short noncoding RNAs ∼22 nucleotides (nt) in length that play a crucial role in post-transcriptional regulation by targeting messenger RNA (mRNA) for degradation or translational repression (Shang et al. 2023). These small but important molecules are involved in a variety of cellular processes, including development, differentiation, and apoptosis (Ratti et al. 2020). The discovery that miRNAs target transcripts by partial pairwise complementarity permitted the development of multiple target prediction methods (Enright et al. 2003; Lai et al. 2003; Lewis et al. 2003). In mammals, targeted transcripts are in most cases degraded (Baek et al. 2008). Thus, the joint analysis of miRNA and transcript expression can be used to identify miRNA/transcript interactions in combination with other miRNA target prediction programs (van Dongen et al. 2008).
Because the discovery that a deletion of two intronic miRNAs was associated with chronic lymphocytic leukemia (Calin et al. 2002), the significance of miRNAs in cancer biology has been increasingly recognized (Vannini et al. 2018). The importance of miRNAs in cancer and other diseases is mirrored by the existence of thousands of publications for which sRNA-seq has been performed, either in cells or laboratory-controlled samples or in patient-derived material. However, in many instances, only small RNAs were analyzed, and no matched full transcriptome analysis exists. These studies, which utilized precious clinical samples, can be reanalyzed as better methods and algorithms are developed to study sRNA-seq. Unfortunately, changes in gene expression associated with changes in miRNA levels cannot be studied in principle as no matching transcriptomic RNA-seq was performed. In this context, we studied whether sRNA-seq experiments contained sufficient fragments from protein-coding transcripts to do a simultaneous analysis of miRNAs and their targets from the same sequencing library. The proposed streamlined approach will not only reduce costs but also simplify experimental workflows, making the simultaneous analysis of transcriptomes and small RNAs affordable and efficient.
Results
Gene expression changes determined using sRNA-seq data correlate with RNA-seq across a range of human tissues
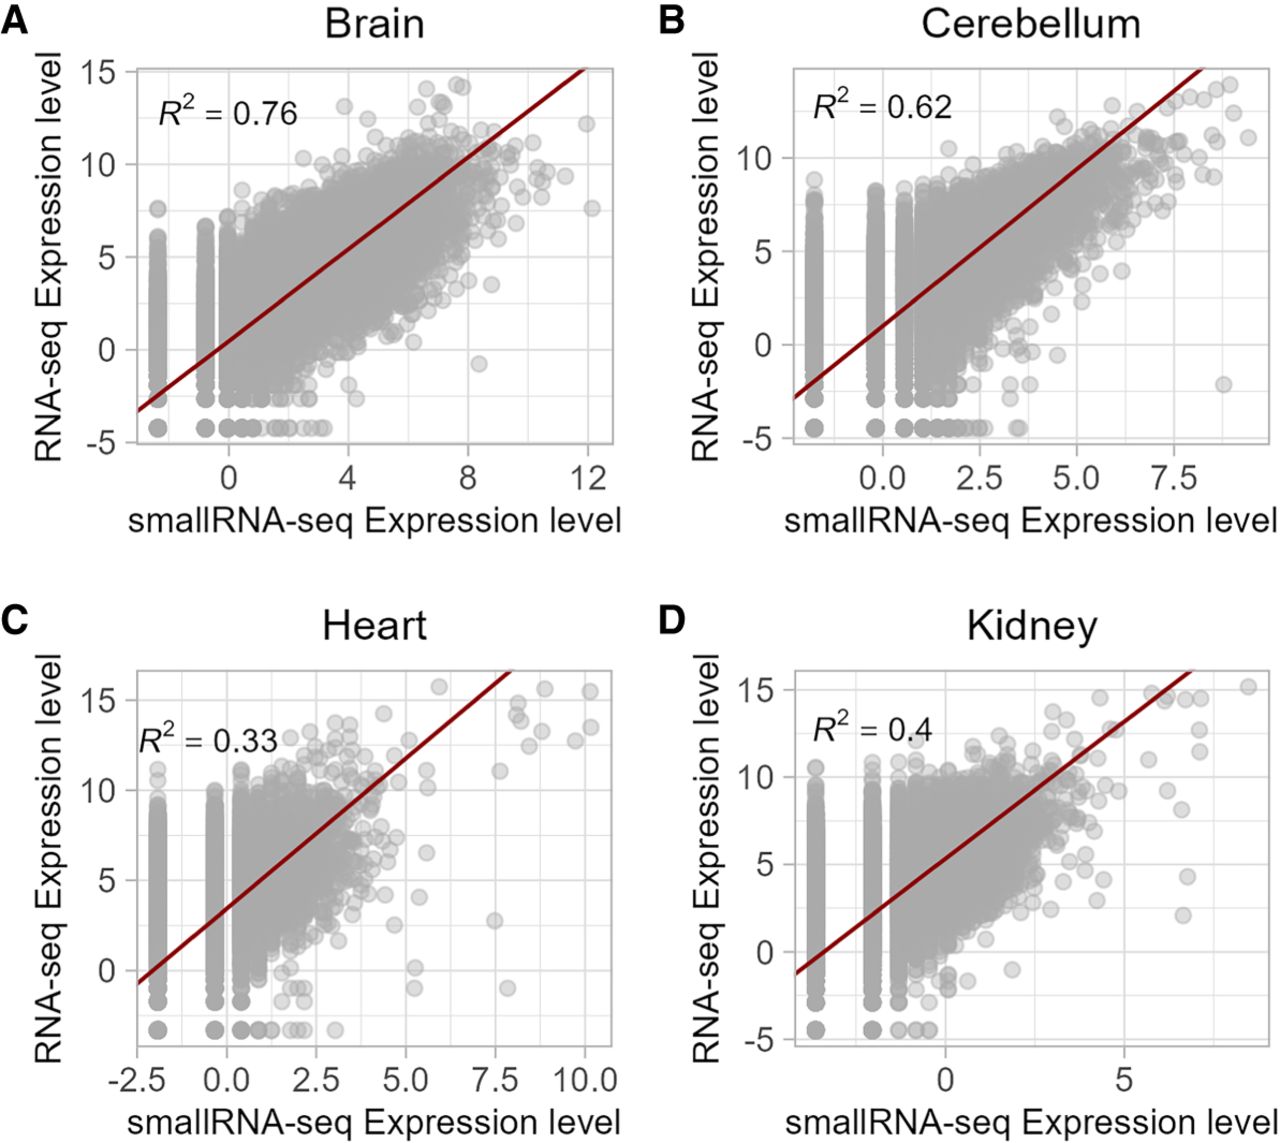
To investigate the potential of sRNA-seq for the analysis of protein coding gene expression, we made use of the sRNA-seq data sets generated by Meunier et al. (2013). These data sets contain the miRNA expression levels of multiple healthy tissues in several vertebrates. The very same group (Kaessmann laboratory) also generated total RNA-seq data sets from (mostly) the same tissue samples (Brawand et al. 2011). Hence, we first selected four human tissues for which comparable small and total RNA-seq data sets are available: brain, cerebellum, heart, and kidney. Both total and small RNA-seq data sets were processed to identify fragments mapping to annotated transcripts. For the analysis, we excluded the noncoding RNAs and only considered protein-coding genes. The expression levels between bona fide reads from RNA-seq and from fragments derived from sRNA-seq experiments were comparable for all four tissues, especially for the brain (Fig. 1A), although the association was also comparably high for the cerebellum (Fig. 1B), heart (Fig. 1C), and kidney (Fig. 1D). The correlation between gene expression levels from the RNA-seq and sRNA-seq libraries was highest in brain (R2 = 0.76) and cerebellum (R2 = 0.62).
Comparison of the expression levels of protein-coding transcripts from RNA-seq and sRNA-seq matches data sets. Noncoding RNAs were removed from the data set and only protein-coding genes included. The normalized expression level (VOOM transform; see Methods) from matched samples was plotted for brain (A), cerebellum (B), heart (C), and kidney (D) healthy human samples (Brawand et al. 2011; Meunier et al. 2013). A regression line was fitted in all four plots (red line), and the coefficient of determination (R2) was given within the plot.
Gene expression changes determined using sRNA-seq data correlate with RNA-seq across a range of tissues from different species
As described above, sRNA-seq can be used to investigate gene expression changes in human tissues. To expand this analysis, we compared the expression level from small RNA and total RNA data sets for two additional species: mouse and chicken. For all of the tissues analyzed, the regression fit was significant, and for the majority, the coefficient of determination (R2) was >50% (Table 1). More specifically, for heart tissues, in both mice and chickens, the association was particularly high (R2 ∼ 70%).
Association between gene expression inferred from small RNA data sets and total RNA expression levels
| Species | Tissue | R2 | P |
|---|---|---|---|
| Mouse | Brain | 0.517 | <0.001 |
| Mouse | Cerebellum | 0.530 | <0.001 |
| Mouse | Heart | 0.692 | <0.001 |
| Mouse | Kidney | 0.475 | <0.001 |
| Mouse | Testis | 0.409 | <0.001 |
| Chicken | Brain | 0.561 | <0.001 |
| Chicken | Cerebellum | 0.448 | <0.001 |
| Chicken | Heart | 0.713 | <0.001 |
| Chicken | Testis | 0.292 | <0.001 |
[i] R2-values were derived from comparing the expression values for coding genes extracted from small (Meunier et al. 2013) and total (Brawand et al. 2011) RNA libraries (regression test).
Some samples showed higher R2-values than others, and these were different across species. For instance, human brain expression is better captured by sRNA-seq compared with heart expression, but this pattern is reversed in mice. This may be because of differences in sequencing depth across samples. However, there is no association between sequenced reads per genome megabase and R2 (R = −0.016, P = 0.958, Pearson's correlation test) (Supplemental Table 1). However, if we consider only reads that after adapter removal were >25 nt (unlikely to be miRNAs), an association between the number of sequenced reads and R2 becomes clear (R = 0.663, P = 0.026) (Supplemental Table 1) if we exclude the two testes samples. This is expected because testes are rich in piRNAs, which are longer than miRNAs and are likely to represent a significant fraction of the analyzed reads (Sun et al. 2022). In addition, given the potential impact of repeated sequences, we also investigated the relative role of read complexity in the sequencing libraries. To do so, we computed the normalized Shannon entropy based in the uniqueness of sequencing reads (ranging from zero if all reads are the same to one if all reads are unique) and built a multivariate linear model to regress R2 with two independent variables: complexity and sequencing depth (Supplemental Table 1). When all samples are considered, we found no association between either sequencing depth or complexity and R2 (depth: P = 0.158; complexity: P = 0.587). If the two testes samples are removed (as above), only sequencing depth seems to be associated with R2 (complexity: P = 0.319; depth: P = 0.0.031). From this analysis, we conclude that although sequence complexity may have an impact, sequencing depth is a major determinant of whether small RNA libraries can be used to successfully measure coding gene expression levels.
Transcript half-life has a negligible effect on small RNA expression estimates across tissues
To evaluate potential biases in the transcript coverage between total and small RNA libraries, we computed the relative enrichment of mapped reads in untranslated regions compared to the coding sequence for each transcript. For the four human total RNA sets analyzed previously, there was a clear enrichment in reads mapping to the CDS compared with both 3′ UTR and 5′ UTR. In small RNA libraries, there were mixed results: For heart and kidney, there was an enrichment in reads mapping to both UTRs; for cerebellum, an enrichment in CDS and 3′ UTR compared to 5′ UTR; and for brain, the pattern was comparable to total RNA libraries (enrichment in CDSs) (Supplemental Fig. 1). This result is consistent with the better coverage of non-miRNA sequences in small RNAs from brain compared to other tissues.
The expression levels quantified from the small RNA libraries could be associated with degradation fragments from transcripts. We explored this by quantifying the impact of total RNA levels (RNA-seq expression) and the half-life of transcripts in the estimation of gene expression from small RNA libraries. For brain samples, there is a significant inverse association between half-life and the gene expression levels quantified from sRNA-seq (P = 0.000017) (Supplemental Table 2), but the effect size is negligible (slope = −0.017) compared with the impact of the total RNA level of the gene transcript (P < 0.00001, slope = 0.659). The interaction term of the regression is negligible. A comparable effect is observed in the other studied samples (Supplemental Table 2). In conclusion, although the half-life of transcripts does have a significant effect on the estimated expression values from small RNA libraries, the size effect is negligible compared with the actual expression levels from total RNA libraries. Transcript half-life is therefore unlikely to impact/bias our analysis pipeline.
The association between the differentially expressed genes identified using sRNA-seq and RNA-seq is not due to codetection of housekeeping genes
The association between small RNA and total RNA expression could be partly owing to the codetection of highly expressed housekeeping genes. To rule this out, we functionally annotated the top 10% of the highest expressed genes form the small RNA inferences from human samples. Table 2 shows the top three most enriched terms for cellular component (Gene Ontology) and KEGG pathways. The enriched terms were consistent with the expected functional features of the analyzed data sets. For instance, both the brain and cerebellum expression from small RNAs was enriched in genes associated with neural cell body or presynapse; the cerebellum was specifically enriched in glutamatergic synapse (a type of synapse enriched in cerebellum); and the brain was enriched in thyroid hormone signaling, which has a more important role in the adult brain that in the cerebellum. Likewise, the kidney is enriched in lysine degradation, which predominantly occurs in the liver and kidney (Vaz and Wanders 2002), and the heart is enriched in hypertrophic cardiomyopathy associated genes (Sorajja et al. 2000).
CC and KEGG enrichment analysis for highly expressed genes from small RNA data sets
| Tissue | Annotation | Enriched term | Enrichment | Q-value |
|---|---|---|---|---|
| Brain | KEGG | Long-term potentiation | 3.8 | 1.59 × 10⁻¹⁰ |
| Brain | KEGG | Thyroid hormone signaling pathway | 2.9 | 9.69 × 10⁻¹⁰ |
| Brain | KEGG | Circadian entrainment | 3.1 | 4.10 × 10⁻⁹ |
| Cerebellum | KEGG | Glutamatergic synapse | 3.5 | 3.50 × 10⁻¹⁴ |
| Cerebellum | KEGG | Circadian entrainment | 3.4 | 4.26 × 10⁻¹¹ |
| Cerebellum | KEGG | Long-term potentiation | 3.9 | 7.63 × 10⁻¹¹ |
| Heart | KEGG | Focal adhesion | 3.2 | 1.05 × 10⁻¹³ |
| Heart | KEGG | Proteoglycans in cancer | 2.9 | 2.85 × 10⁻¹⁰ |
| Heart | KEGG | Hypertrophic cardiomyopathy (HCM) | 3.7 | 5.84 × 10⁻⁸ |
| Kidney | KEGG | Focal adhesion | 2.3 | 1.51 × 10⁻⁷ |
| Kidney | KEGG | Lysine degradation | 3.6 | 3.35 × 10⁻⁷ |
| Kidney | KEGG | Adherens junction | 3.3 | 3.35 × 10⁻⁷ |
| Brain | CC (GO) | Neuronal cell body | 2.6 | 0 |
| Brain | CC (GO) | Presynapse | 2.7 | 0 |
| Brain | CC (GO) | Cytoplasmic region | 2.6 | 0 |
| Cerebellum | CC (GO) | Neuronal cell body | 2.8 | 0 |
| Cerebellum | CC (GO) | Presynapse | 3.0 | 0 |
| Cerebellum | CC (GO) | Cytoplasmic region | 2.4 | 0 |
| Heart | CC (GO) | Actin cytoskeleton | 2.9 | 0 |
| Heart | CC (GO) | Cell-substrate junction | 3.5 | 0 |
| Heart | CC (GO) | Cell-substrate adherens junction | 3.5 | 0 |
| Kidney | CC (GO) | Cell-substrate junction | 3.0 | 0 |
| Kidney | CC (GO) | Cell-substrate adherens junction | 3.0 | 0 |
| Kidney | CC (GO) | Focal adhesion | 3.1 | 0 |
[i] CC (GO): Cellular component (Gene Ontology).
miRNA expression is associated with target gene expression quantified using sRNA-seq
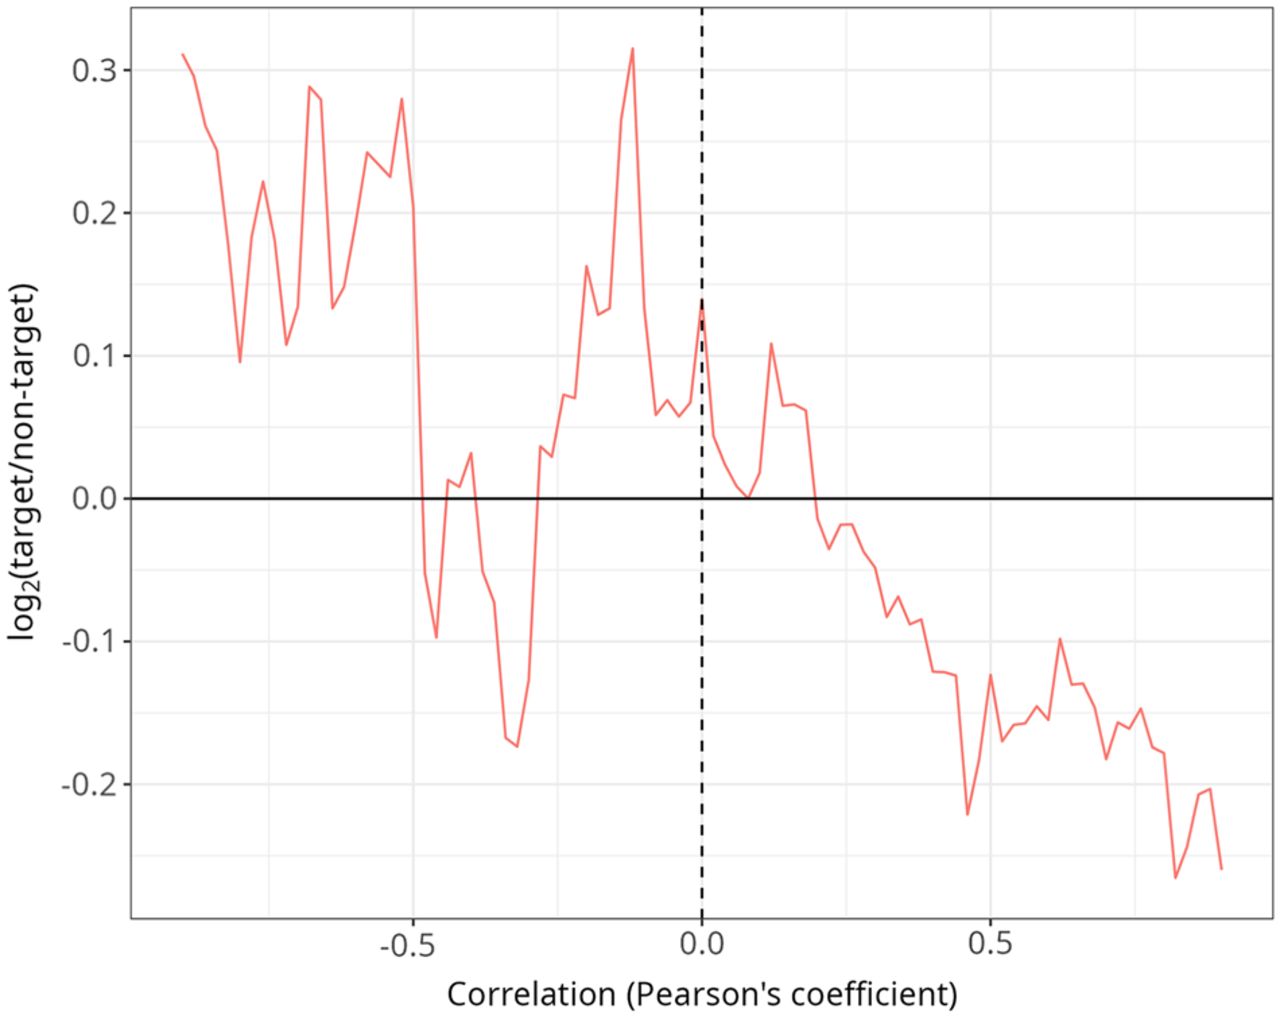
Given that we successfully measured coding gene expression levels from fragments present in sRNA-seq data sets, we also quantified the expression level of miRNAs and compared the expression profile between all miRNA/coding gene pairs from the same sRNA-seq. Then, we identified those pairs with known interactions previously described in the literature as compiled in miRTarBase (see Methods). In this analysis, we used all the samples available for small RNAs, which include, on top of the four human tissues studied already, a sample from testes. By plotting the ratio of known miRNA–target interactions as a function of the expression correlation, we clearly observe that anticorrelated pairs are enriched in target interactions, whereas highly correlated pairs show a paucity of targets (Fig. 2). This indicates that the joint analysis of miRNAs and their potential targets, solely generated from sRNA-seq experiments, can be used to study the function of miRNAs in specific tissues.
Coexpression of miRNAs and their targets within sRNA-seq experiments. For all pairwise comparisons between a miRNA and a protein-coding gene, the x-axis gives the correlation of expression values in the human samples in Figure 1, and the y-axis shows the log-odds ratio of the proportion of validated target pairs with respect to the total number of pairs in the bin. Each value in the x-axis is a bin of size ±0.2 around the x-axis value in a sliding window analysis with step size of 0.02.
Gene expression analysis, performed on small RNA patient data sets, successfully identifies genes linked to breast cancer
To evaluate whether this methodology can extract useful information from clinical samples, we studied 24 samples from 12 patients with breast cancer sequenced by Meerson et al. (2019); this study focused on miRNAs, and only sRNA-seq was performed. This allowed us to perform a paired analysis (two conditions: matched tumor vs. nontumor) to identify genes differentially expressed in breast cancer. The expression levels of miRNAs and coding genes were quantified from the sRNA-seq data sets, and we performed differential gene expression analysis for both. The analysis of miRNAs reveals that dozens of miRNAs are differentially expressed between tumor and nontumor samples correcting for batch (patient). More specifically, for a false-discovery rate or 1% and a log2 fold-change difference of at least 1/–1, we identified 54 upregulated and 29 downregulated miRNAs in breast cancer samples. Among miRNAs, the most significant changes are for MIR144 (downregulated in tumors) and MIR429 (upregulated in tumors) (Supplemental Figs. 2, 3).
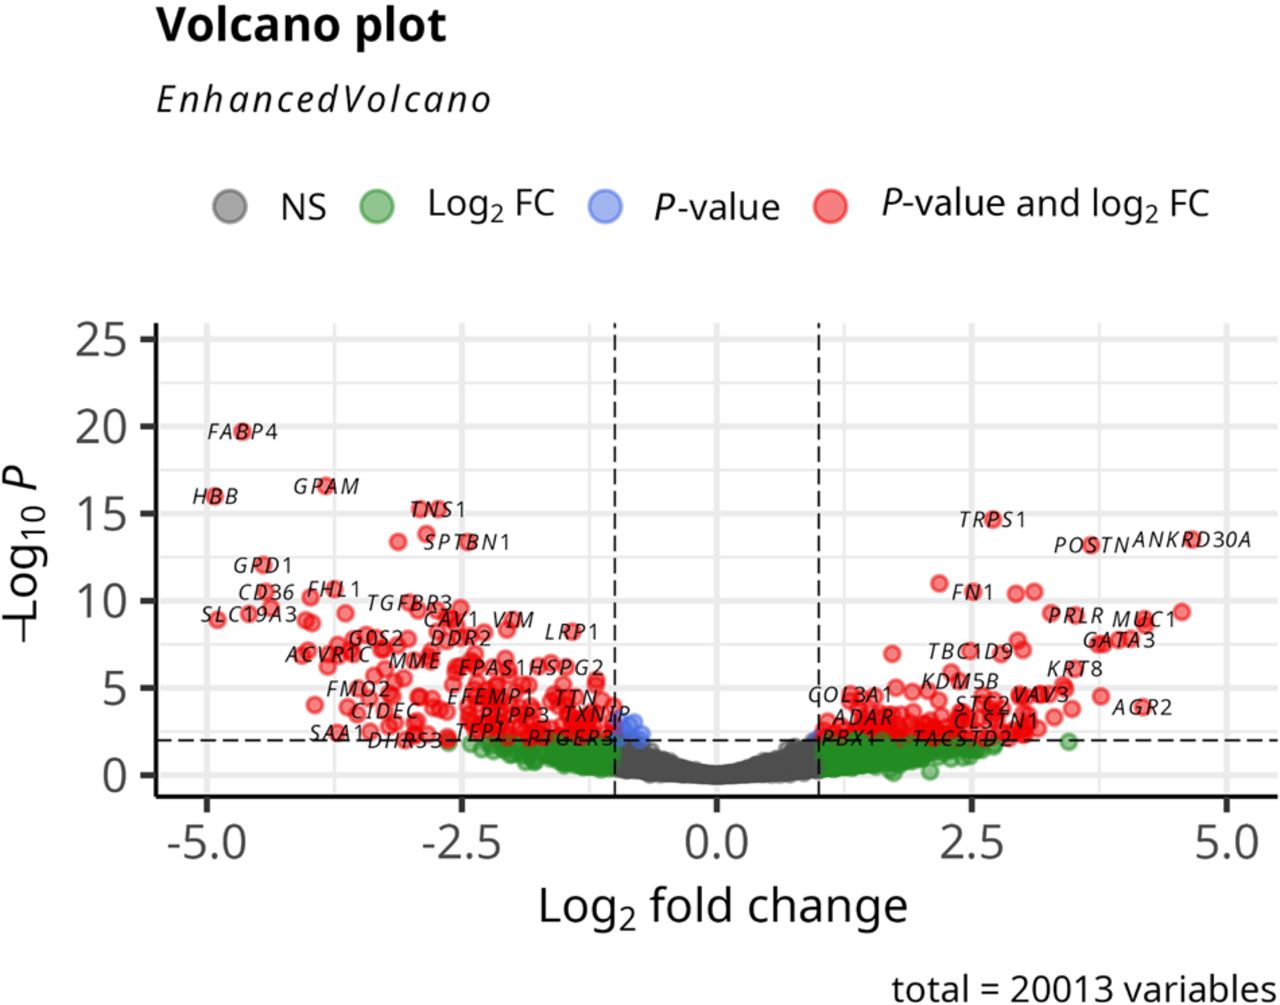
Importantly, the limited number of reads mapped to coding genes in the sRNA-seq was sufficient to permit differential gene expression analysis, and many coding genes were found to be up- and downregulated in tumors (Fig. 3; Supplemental Fig. 4). The functional annotation of upregulated genes from this analysis reveals an enrichment in functional categories (within the biological process domain in Gene Ontology) related with cell proliferation, as expected for cancer samples (Table 3). Also, the annotation to disease-related databases (OMIM and Glad4U) consistently shows an enrichment in breast cancer–related categories (Table 4). These results confirm that the differentially regulated genes identified from the sRNA-seq experiments are consistent with those expected from breast cancer samples.
Differential gene expression of protein-coding genes from breast cancer paired sRNA-seq experiments. Volcano plot representing the expression fold-change (DESeq2) on the x-axis of paired breast cancer samples (see main text) against the −log10 of the Q-value (FDR-corrected P-value) generated during the differential gene expression analysis. Identified differentially expressed genes are shown in red.
Gene Ontology enrichment analysis for upregulated genes
| Gene Set | Description | Size | Expect | Ratio | Q-value |
|---|---|---|---|---|---|
| GO:0009888 | Tissue development | 428 | 23.033 | 1.9537 | 0.008030 |
| GO:0043588 | Skin development | 65 | 3.4980 | 4.0023 | 0.008030 |
| GO:0048856 | Anatomical structure development | 1154 | 62.102 | 1.4170 | 0.008030 |
| GO:0042060 | Wound healing | 160 | 8.6104 | 2.6712 | 0.008030 |
| GO:0030855 | Epithelial cell differentiation | 151 | 8.1261 | 2.7073 | 0.008030 |
| GO:0009611 | Response to wounding | 186 | 10.010 | 2.4976 | 0.008030 |
| GO:0032502 | Developmental process | 1240 | 66.731 | 1.3787 | 0.008030 |
| GO:0060429 | Epithelium development | 271 | 14.584 | 2.1256 | 0.014430 |
| GO:0007275 | Multicellular organism development | 1052 | 56.613 | 1.4131 | 0.021660 |
| GO:0048731 | System development | 961 | 51.716 | 1.4309 | 0.035011 |
[i] (Size) Size of the category, (expect) expected number of genes from query in category, and (ratio) ratio of observed over expected number of genes.
Disease categories enrichment for upregulated genes in OMIM and GLAD4U
| Gene Set | Description | Size | Expect | Ratio | Q-value |
|---|---|---|---|---|---|
| 114480a | Breast cancer | 7 | 0.026 | 76.095 | 0.001574 |
| 176807a | Prostate cancer | 7 | 0.026 | 38.048 | 0.069562 |
| 601626a | Leukemia, acute myeloid | 7 | 0.026 | 38.048 | 0.069562 |
| PA446482b | Skin and connective tissue diseases | 113 | 6.396 | 4.8466 | 1.382 × 10⁻¹¹ |
| PA445676b | Skin diseases | 121 | 6.849 | 4.5262 | 5.572 × 10⁻¹¹ |
| PA443560b | Breast neoplasms | 140 | 7.925 | 3.7857 | 1.574 × 10⁻⁸ |
| PA443559b | Breast diseases | 128 | 7.245 | 3.7266 | 2.040 × 10⁻⁷ |
| PA445062b | Neoplasms | 223 | 12.62 | 2.7728 | 1.578 × 10⁻⁶ |
| PA447242b | Epithelial cancers | 124 | 7.019 | 3.5618 | 1.813 × 10⁻⁶ |
| PA446646b | Carcinoma, ductal, breast | 34 | 1.925 | 6.7549 | 2.223 × 10⁻⁶ |
| PA165108776b | Infiltrating duct carcinoma of breast | 34 | 1.925 | 6.7549 | 2.223 × 10⁻⁶ |
| PA445058b | Neoplasm metastasis | 157 | 8.887 | 3.1507 | 2.399 × 10⁻⁶ |
| PA443610b | Carcinoma | 159 | 9.000 | 3.1111 | 2.901 × 10⁻⁶ |
Analysis of gene expression data in sRNA-seq can be used to identify/validate miRNA target regulation
To analyze the potential of our approach for identifying miRNA target sites, we first identified canonical sites in miRNA–transcript pairs. We then quantified enrichment as the proportion observed in experimentally validated targets relative to nonvalidated targets. More specifically, we computed the log-odds ratio of the proportion of validated target sites for (1) upregulated and downregulated miRNAs compared with downregulated transcripts and (2) upregulated and downregulated miRNAs compared with upregulated transcripts. Our results indicate that for downregulated miRNAs, there is a statistical enrichment in validated targets compared with upregulated miRNAs when we considered downregulated transcripts (P = 0.0025) (Table 5). This indicates that when we identify pairs of down-miR:up-transcript, we can identify functional target sites. However, in the reverse case (up-miR:down-transcript), the association was not statistically significant, although there was an enrichment in targets (Table 5).
Enrichment in validated targets for differentially expressed microRNAs
| Numerator | Denominator | Odds ratio | z-score | P-value |
|---|---|---|---|---|
| miR up:transcript down | miR down:transcript down | 0.864 | −1.098 | 0.863 |
| miR down:transcript up | miR up:transcript up | 1.458 | 2.805 | 0.003 |
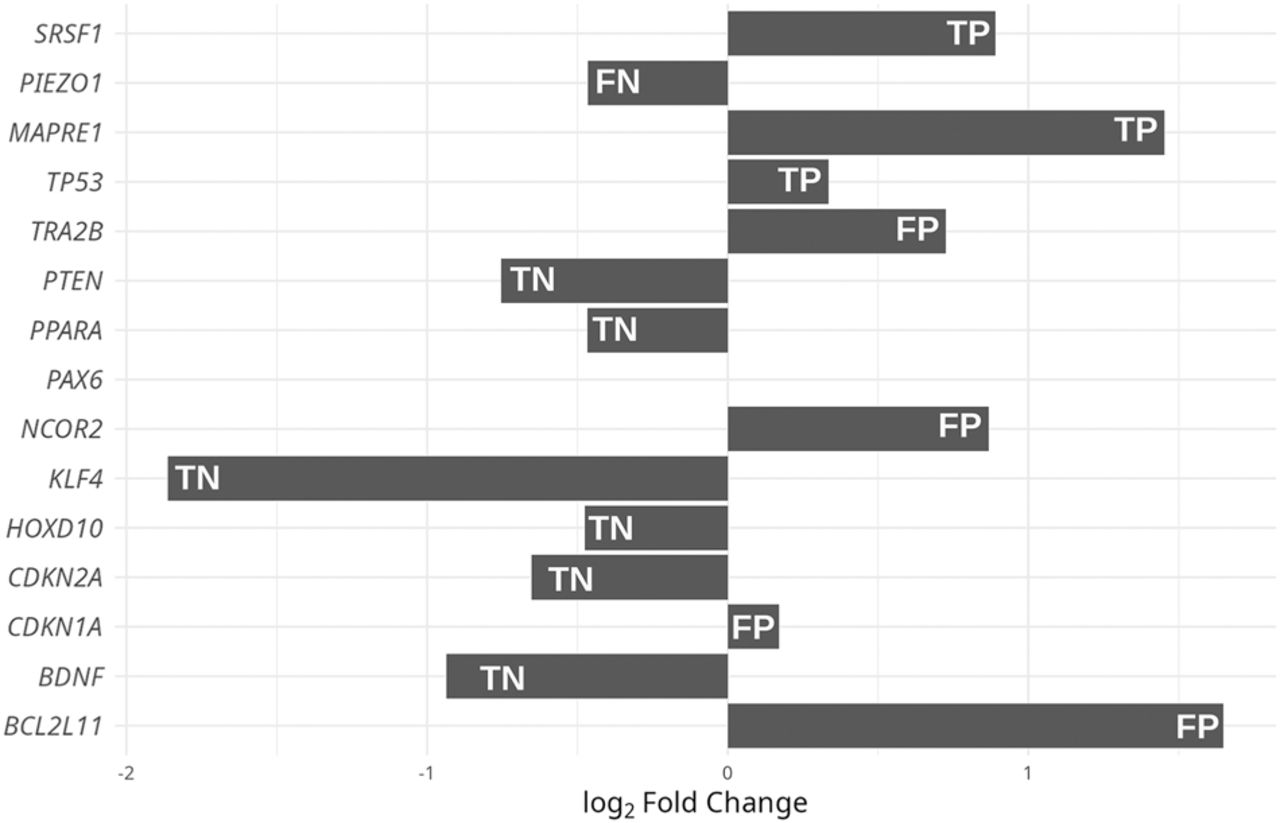
In the original paper studying small RNAs in breast cancer samples, the authors validated the targets of miR-10b-5p using qPCR. They considered 15 known targets: BCL2L11, BDNF, CDKN1A, CDKN2A, HOXD10, KLF4, MAPRE1, NCOR2, PAX6, PIEZO1, PPARa, PTEN, SRSF1, TP53, and TRA2B. Of those, they found anticorrelated expression of miR-10b-5p with MAPRE1, PIEZ01, SRSF1, and TP53. We used these data to validate our approach by analyzing our gene expression calculated levels from small RNA libraries, focusing on genes that have an opposite expression fold-change (cancer vs. normal) with respect to miR-10b-5p (Fig. 4). For all 14 genes (PAX6 was excluded as we did not detect any reads mapped to it), we found that three out of the four validated targets were upregulated in our analysis (miR-10b-5p is downregulated in breast cancer), representing a 75% recall. Considering all of the 14 predicted targets, we also computed a precision of 43% and an accuracy of 64%. If we increase the log2 fold-change threshold to determine which genes are upregulated according to our DGE analysis and compare it again to the gold standard, we observed, as expected, that the recall decreases and the precision increases. However, the accuracy remains high for log2 fold-change thresholds between zero and two, with values around 70% (Supplemental Fig. 5). This, together with the previous analysis, suggests that the use of small RNA data sets can be used to identify and validate miRNA targets.
Fold-change of miR-10b-5p target genes. Fold-change of target genes inferred from small RNA libraries. The first four (top) genes are validated miR-10-5p targets according to the method of Meerson et al. (2019). All others are nonvalidated targets. Genes are labeled, according to how their expression level compared with those expected from the gold standard, as true positive (TP), false positive (FP), true negative (TN), and false negative (FN).
Discussion
In this work we first compared the expression levels of protein-coding sequences from matched RNA-seq and sRNA-seq experiments across different vertebrate species and in multiple tissues to investigate if the fragments present in sRNA-seq can be used to recover biologically and clinically meaningful mRNA signatures, therefore enabling dual analysis (miRNA and mRNA) from a single library and sequencing run. Importantly, our approach captures >50% of variance across these different sample types. We also observed good correlations in our analysis of mouse and chicken data sets, confirming that the usefulness of our approach is not limited to human data.
The association between RNA-seq and our mRNA predictions from sRNA-seq was different for different tissues and was not always consistent across species. We showed that a high association (determination coefficient) is associated with a high sequencing depth when we exclude reads of size ≤25 nt (likely miRNAs) except for testis samples (piRNAs). In addition, we showed that read complexity of sRNA-seq experiments is not a determinant either. It is therefore recommended that ≥25 nt fraction at a sequencing depth of 5 million or more reads should be used per sample when performing sRNA-seq for dual profiling. In contrast, degradation bias (half-life analysis) and noise from housekeeping genes do not appear to have a significant effect upon or bias our approach. For the latter, Gene Ontology analysis identified tissue-specific pathways, reinforcing that the signal is biologically specific rather than dominated by ubiquitous transcripts.
We also analyzed paired breast cancer and normal samples for which only small RNA-seq data were available, and we successfully identified differentially expressed miRNAs and coding genes, as well as potential miRNA–transcript interactions. Our approach was confirmed using miRNA targets that have been previously validated (Meerson et al. 2019). Validation against qPCR-confirmed miR-10b-5p targets achieved 75% recall and 43% precision, illustrating a practical utility for target nomination from sRNA-seq alone.
Although the computational prediction of miRNA targets has been relatively successful in the past (see Introduction), experimental techniques have improved our ability to detect/confirm bona fide targets. These techniques are diverse and include variations of immunoprecipitation and expression analysis (for review, see Thomson et al. 2011). The joint analysis of the gene expression of both miRNAs and their potential targets has been successfully used in the past, starting with the pioneering work by Huang et al. (2007). In that article, the authors describe a method that builds regulatory networks by combining the expression profile of matched miRNA/mRNA microarray experiments. Ever since, other studies using RNA-seq/sRNA-seq-matched experiments have been used to identify miRNA targets (e.g., Jacobsen et al. 2013). A step further, in part to avoid unwanted effects owing to differences in sample/library preparation, is the use of the same high-throughput expression experiment to study simultaneously both miRNAs and their potential targets. Two works from the Banfi laboratory exploited this idea in two different ways (Gennarino et al. 2009, 2012). First, considering that many intronic miRNAs have their expression linked to that of their host gene (Baskerville and Bartel 2005), they use gene expression microarrays to identify genes with anticorrelated expression with the host gene as a proxy of intronic miRNA/target interaction (Gennarino et al. 2009). Second, they considered, again using microarray experiments, that targets of the same miRNA are coexpressed, and they used this to identify miRNA targets (Gennarino et al. 2012). In this work, we go a step further and study, as far as we are aware for the first time, simultaneously the expression level of miRNAs and their potential targets from the same sRNA-seq experiments.
The use of anticorrelation between miRNAs and their specific targets as a means of identifying potential, biologically relevant regulatory interactions, although widely employed (including in the present study), has certain limitations. First, miRNA targeting is a post-transcriptional regulatory mechanism, and when miRNA–target pairing is partially complementary, as is typically the case in animals, protein synthesis is repressed (Bartel 2009). However, target RNA stability is also influenced by miRNA targeting, and particularly for miRNAs exerting strong regulatory effects, target degradation is expected (Baek et al. 2008; Selbach et al. 2008), thereby justifying the use of transcriptomic approaches to study miRNA targets. Second, the regulatory impact of miRNAs can be complex and involve multiple regulatory steps. In this context, anticorrelation between a miRNA and a transcript does not necessarily indicate the presence of a functional target site. Regulatory network–aware tools, such as those described above (Huang et al. 2007), account for the transcriptional responses of multiple miRNAs and transcripts. Future iterations of our method should therefore incorporate this capability.
Further work is necessary to better understand the factors that will allow for the systematic analysis of both miRNAs and their targets from the same sRNA-seq experiments, but from the outcomes of this work, this approach is valid and will provide useful data to better understand miRNA–target gene regulatory networks. It will also enable users to predict gene expression changes from published data sets in which only small RNA-seq data are available and from future studies in which resources or samples are limited, ensuring that the maximum amount of information is extracted from each experiment.
Methods
Data sets and databases
The total tissue RNA expression data sets were those from Brawand et al. (2011) available at the European Nucleotide Archive (ENA; https://www.ebi.ac.uk/ena) under accession number PRJNA143627. The small RNA human tissue expression data sets are from Meunier et al. (2013) under accession number PRJNA174234. The small RNA and total RNA experiments were performed by the same group. Gene annotations (CDS and UTRs) are from Ensembl version 113 (October 2024) retrieved with biomaRt (Kinsella et al. 2011). Breast cancer (patients) data were retrieved from Meerson et al. (2019) under accession PRJNA494326. Experimentally validated mRNA targets are from miRTarBase (v 9.0) (Chou et al. 2018), and canonical miRNA targets were predicted using seedVicious (v1.3) (Marco 2018).
Analysis of coding gene and miRNA expression
Adaptors were removed from reads with cutadapt (v3.7) (Martin 2011), and reads were mapped to the human genome hg38 with HISAT2 (v2.2.1) (Kim et al. 2019) with default parameters. We then used featureCounts (v2.0.2) (Liao et al. 2014) to count the number of reads in each feature. For human transcripts, we used the annotation in GENCODE (v43) (Frankish et al. 2019), and for miRNAs, we used miRBase (v22.1) (Kozomara et al. 2019). When comparing the expression profile of RNA-seq and sRNA-seq experiments for the same tissues/samples, we first used the Voom transformation on read counts (Law et al. 2014) using limma (v3.52.2) (Ritchie et al. 2015). The computation of log2 fold-change expression values and the differential gene expression analysis were done with DESeq2 (v1.36.0) (Love et al. 2014), including a patient term in the model (expression ∼ patient+ tumour). For the analysis of transcript half-life, we used the information from Tani et al. (2012) and then build a regression model small_RNA ∼ total_RNA + half-life + interaction to evaluate the relative impact of transcript half-life compared with the transcript abundance based on levels from the total RNA libraries. All statistical analyses and figures were done using R (v4.2.1) (R Core Team 2004). Functional annotation was performed with WebGestalt 2024 (Elizarraras et al. 2024), setting a minimum number of elements per category to five, using the list of genes that passed the DESeq2 default filtering as the background list, and leaving other options as default. The categories evaluated were biological process in Gene Ontology (The Gene Ontology Consortium 2000), OMIM (Hamosh et al. 2005), and GLAD4U (Jourquin et al. 2012). Volcano plots were drawn with the EnhancedVolcano R package (https://github.com/kevinblighe/EnhancedVolcano).
Code availability
All results and scripts generated in this study are available at GitHub (https://github.com/antoniomarco/CDS_from_sRNAseq) and as Supplemental Code.
Competing interest statement
The authors declare no competing interests.
Acknowledgments
We acknowledge the use of the high-performance computing facility (Ceres) and its associated support services at the University of Essex in the completion of this work. This work was funded by a Biotechnology and Biological Sciences Research Council (BBSRC) Impact Accelerator Award BB/X511171/1. A.A. was funded by the Ministry of Science and Education, Republic of Azerbaijan. G.N.B. is also supported by BBSRC grants BB/W020033/1 and BB/X018997/1. For the purpose of open access, the authors have applied a Creative Commons Attribution (CC BY) license to any Author Accepted Manuscript version arising.
Author contributions: A.M. and G.N.B. conceived and devised the project, interpreted the results, and wrote the manuscript; A.E., A.A., and A.M. performed the analyses.
Notes
[7] Supplementary material [Supplemental material is available for this article.]
[8] Article published online before print. Article, supplemental material, and publication date are at https://www.genome.org/cgi/doi/10.1101/gr.281364.125.
References
- ↵Baek D, Villén J, Shin C, Camargo FD, Gygi SP, Bartel DP. 2008. The impact of microRNAs on protein output. Nature 455: 64–71. 10.1038/nature07242
- ↵Bartel DP. 2009. MicroRNAs: target recognition and regulatory functions. Cell 136: 215–233. 10.1016/j.cell.2009.01.002
- ↵Baskerville S, Bartel DP. 2005. Microarray profiling of microRNAs reveals frequent coexpression with neighboring miRNAs and host genes. RNA 11: 241–247. 10.1261/rna.7240905
- ↵Bentley DR, Balasubramanian S, Swerdlow HP, Smith GP, Milton J, Brown CG, Hall KP, Evers DJ, Barnes CL, Bignell HR, 2008. Accurate whole human genome sequencing using reversible terminator chemistry. Nature 456: 53–59. 10.1038/nature07517
- ↵Brawand D, Soumillon M, Necsulea A, Julien P, Csárdi G, Harrigan P, Weier M, Liechti A, Aximu-Petri A, Kircher M, 2011. The evolution of gene expression levels in mammalian organs. Nature 478: 343–348. 10.1038/nature10532
- ↵Calin GA, Dumitru CD, Shimizu M, Bichi R, Zupo S, Noch E, Aldler H, Rattan S, Keating M, Rai K, 2002. Frequent deletions and down-regulation of micro- RNA genes miR15 and miR16 at 13q14 in chronic lymphocytic leukemia. Proc Natl Acad Sci 99: 15524–15529. 10.1073/pnas.242606799
- ↵Chou C-H, Shrestha S, Yang C-D, Chang N-W, Lin Y-L, Liao K-W, Huang W-C, Sun T-H, Tu S-J, Lee W-H, 2018. miRTarBase update 2018: a resource for experimentally validated microRNA-target interactions. Nucleic Acids Res 46: D296–D302. 10.1093/nar/gkx1067
- ↵Elizarraras JM, Liao Y, Shi Z, Zhu Q, Pico AR, Zhang B. 2024. WebGestalt 2024: faster gene set analysis and new support for metabolomics and multi-omics. Nucleic Acids Res 52: W415–W421. 10.1093/nar/gkae456
- ↵Enright A, John B, Gaul U, Tuschl T, Sander C, Marks D. 2003. MicroRNA targets in Drosophila. Genome Biol 5: R1. 10.1186/gb-2003-5-1-r1
- ↵Frankish A, Diekhans M, Ferreira A-M, Johnson R, Jungreis I, Loveland J, Mudge JM, Sisu C, Wright J, Armstrong J, 2019. GENCODE reference annotation for the human and mouse genomes. Nucleic Acids Res 47: D766–D773. 10.1093/nar/gky955
- ↵The Gene Ontology Consortium. 2000. Gene Ontology: tool for the unification of biology. Nat Genet 25: 25–29. 10.1038/75556
- ↵Gennarino VA, Sardiello M, Avellino R, Meola N, Maselli V, Anand S, Cutillo L, Ballabio A, Banfi S. 2009. MicroRNA target prediction by expression analysis of host genes. Genome Res 19: 481–490. 10.1101/gr.084129.108
- ↵Gennarino VA, D'Angelo G, Dharmalingam G, Fernandez S, Russolillo G, Sanges R, Mutarelli M, Belcastro V, Ballabio A, Verde P, 2012. Identification of microRNA-regulated gene networks by expression analysis of target genes. Genome Res 22: 1163–1172. 10.1101/gr.130435.111
- ↵Grimson A, Farh KK-H, Johnston WK, Garrett-Engele P, Lim LP, Bartel DP. 2007. MicroRNA targeting specificity in mammals: determinants beyond seed pairing. Mol Cell 27: 91–105. 10.1016/j.molcel.2007.06.017
- ↵Hamosh A, Scott AF, Amberger JS, Bocchini CA, McKusick VA. 2005. Online Mendelian Inheritance in Man (OMIM), a knowledgebase of human genes and genetic disorders. Nucleic Acids Res 33: D514–D517. 10.1093/nar/gki033
- ↵Huang JC, Babak T, Corson TW, Chua G, Khan S, Gallie BL, Hughes TR, Blencowe BJ, Frey BJ, Morris QD. 2007. Using expression profiling data to identify human microRNA targets. Nat Methods 4: 1045–1049. 10.1038/nmeth1130
- ↵Jacobsen A, Silber J, Harinath G, Huse JT, Schultz N, Sander C. 2013. Analysis of microRNA-target interactions across diverse cancer types. Nat Struct Mol Biol 20: 1325–1332. 10.1038/nsmb.2678
- ↵Jourquin J, Duncan D, Shi Z, Zhang B. 2012. GLAD4U: deriving and prioritizing gene lists from PubMed literature. BMC Genomics 13(Suppl 8): S20. 10.1186/1471-2164-13-S8-S20
- ↵Kim D, Paggi JM, Park C, Bennett C, Salzberg SL. 2019. Graph-based genome alignment and genotyping with HISAT2 and HISAT-genotype. Nat Biotechnol 37: 907–915. 10.1038/s41587-019-0201-4
- ↵Kinsella RJ, Kähäri A, Haider S, Zamora J, Proctor G, Spudich G, Almeida-King J, Staines D, Derwent P, Kerhornou A, 2011. Ensembl BioMarts: a hub for data retrieval across taxonomic space. Database (Oxford) 2011: bar030. 10.1093/database/bar030
- ↵Kozomara A, Birgaoanu M, Griffiths-Jones S. 2019. miRBase: from microRNA sequences to function. Nucleic Acids Res 47: D155–D162. 10.1093/nar/gky1141
- ↵Lai EC, Tomancak P, Williams RW, Rubin GM. 2003. Computational identification of Drosophila microRNA genes. Genome Biol 4: R42. 10.1186/gb-2003-4-7-r42
- ↵Law CW, Chen Y, Shi W, Smyth GK. 2014. Voom: precision weights unlock linear model analysis tools for RNA-seq read counts. Genome Biol 15: R29. 10.1186/gb-2014-15-2-r29
- ↵Lewis BP, Shih I, Jones-Rhoades MW, Bartel DP, Burge CB. 2003. Prediction of mammalian microRNA targets. Cell 115: 787–798. 10.1016/S0092-8674(03)01018-3
- ↵Liao Y, Smyth GK, Shi W. 2014. featureCounts: an efficient general purpose program for assigning sequence reads to genomic features. Bioinformatics 30: 923–930. 10.1093/bioinformatics/btt656
- ↵Love MI, Huber W, Anders S. 2014. Moderated estimation of fold change and dispersion for RNA-seq data with DESeq2. Genome Biol 15: 550. 10.1186/s13059-014-0550-8
- ↵Maniatis T, Kee SG, Efstratiadis A, Kafatos FC. 1976. Amplification and characterization of a beta-globin gene synthesized in vitro. Cell 8: 163–182. 10.1016/0092-8674(76)90001-5
- ↵Marco A. 2018. SeedVicious: analysis of microRNA target and near-target sites. PLoS One 13: e0195532. 10.1371/journal.pone.0195532
- ↵Margulies M, Egholm M, Altman WE, Attiya S, Bader JS, Bemben LA, Berka J, Braverman MS, Chen Y-J, Chen Z, 2005. Genome sequencing in microfabricated high-density picolitre reactors. Nature 437: 376–380. 10.1038/nature03959
- ↵Martin M. 2011. Cutadapt removes adapter sequences from high-throughput sequencing reads. EMBnetjournal 17: 10–12. 10.14806/ej.17.1.200
- ↵Meerson A, Eliraz Y, Yehuda H, Knight B, Crundwell M, Ferguson D, Lee BP, Harries LW. 2019. Obesity impacts the regulation of miR-10b and its targets in primary breast tumors. BMC Cancer 19: 86. 10.1186/s12885-019-5300-6
- ↵Meunier J, Lemoine F, Soumillon M, Liechti A, Weier M, Guschanski K, Hu H, Khaitovich P, Kaessmann H. 2013. Birth and expression evolution of mammalian microRNA genes. Genome Res 23: 34–45. 10.1101/gr.140269.112
- ↵Ratti M, Lampis A, Ghidini M, Salati M, Mirchev MB, Valeri N, Hahne JC. 2020. MicroRNAs (miRNAs) and long non-coding RNAs (lncRNAs) as new tools for cancer therapy: first steps from bench to bedside. Target Oncol 15: 261–278. 10.1007/s11523-020-00717-x
- ↵R Core Team. 2004. R: a language and environment for statistical computing. R Foundation for Statistical Computing, Vienna. https://www.R-project.org/ [accessed May 1, 2013].
- ↵Ritchie ME, Phipson B, Wu D, Hu Y, Law CW, Shi W, Smyth GK. 2015. limma powers differential expression analyses for RNA-sequencing and microarray studies. Nucleic Acids Res 43: e47. 10.1093/nar/gkv007
- ↵Ruby JG, Stark A, Johnston WK, Kellis M, Bartel DP, Lai EC. 2007. Evolution, biogenesis, expression, and target predictions of a substantially expanded set of Drosophila microRNAs. Genome Res 17: 1850–1864. 10.1101/gr.6597907
- ↵Schena M, Shalon D, Davis RW, Brown PO. 1995. Quantitative monitoring of gene expression patterns with a complementary DNA microarray. Science 270: 467–470. 10.1126/science.270.5235.467
- ↵Selbach M, Schwänhausser B, Thierfelder N, Fang Z, Khanin R, Rajewsky N. 2008. Widespread changes in protein synthesis induced by microRNAs. Nature 455: 58–63. 10.1038/nature07228
- ↵Shang R, Lee S, Senavirathne G, Lai EC. 2023. microRNAs in action: biogenesis, function and regulation. Nat Rev Genet 24: 816–833. 10.1038/s41576-023-00611-y
- ↵Sorajja P, Elliott PM, Mckenna WJ. 2000. The molecular genetics of hypertrophic cardiomyopathy: prognostic implications. Europace 2: 4–14. 10.1053/eupc.1999.0067
- ↵Sun YH, Lee B, Li XZ. 2022. The birth of piRNAs: how mammalian piRNAs are produced, originated, and evolved. Mamm Genome 33: 293–311. 10.1007/s00335-021-09927-8
- ↵Tani H, Mizutani R, Salam KA, Tano K, Ijiri K, Wakamatsu A, Isogai T, Suzuki Y, Akimitsu N. 2012. Genome-wide determination of RNA stability reveals hundreds of short-lived noncoding transcripts in mammals. Genome Res 22: 947–956. 10.1101/gr.130559.111
- ↵Thomson DW, Bracken CP, Goodall GJ. 2011. Experimental strategies for microRNA target identification. Nucleic Acids Res 39: 6845–6853. 10.1093/nar/gkr330
- ↵van Dongen S, Abreu-Goodger C, Enright AJ. 2008. Detecting microRNA binding and siRNA off-target effects from expression data. Nat Methods 5: 1023–1025. 10.1038/nmeth.1267
- ↵Vannini I, Fanini F, Fabbri M. 2018. Emerging roles of microRNAs in cancer. Curr Opin Genet Dev 48: 128–133. 10.1016/j.gde.2018.01.001
- ↵Vaz FM, Wanders RJA. 2002. Carnitine biosynthesis in mammals. Biochem J 361: 417–429. 10.1042/bj3610417