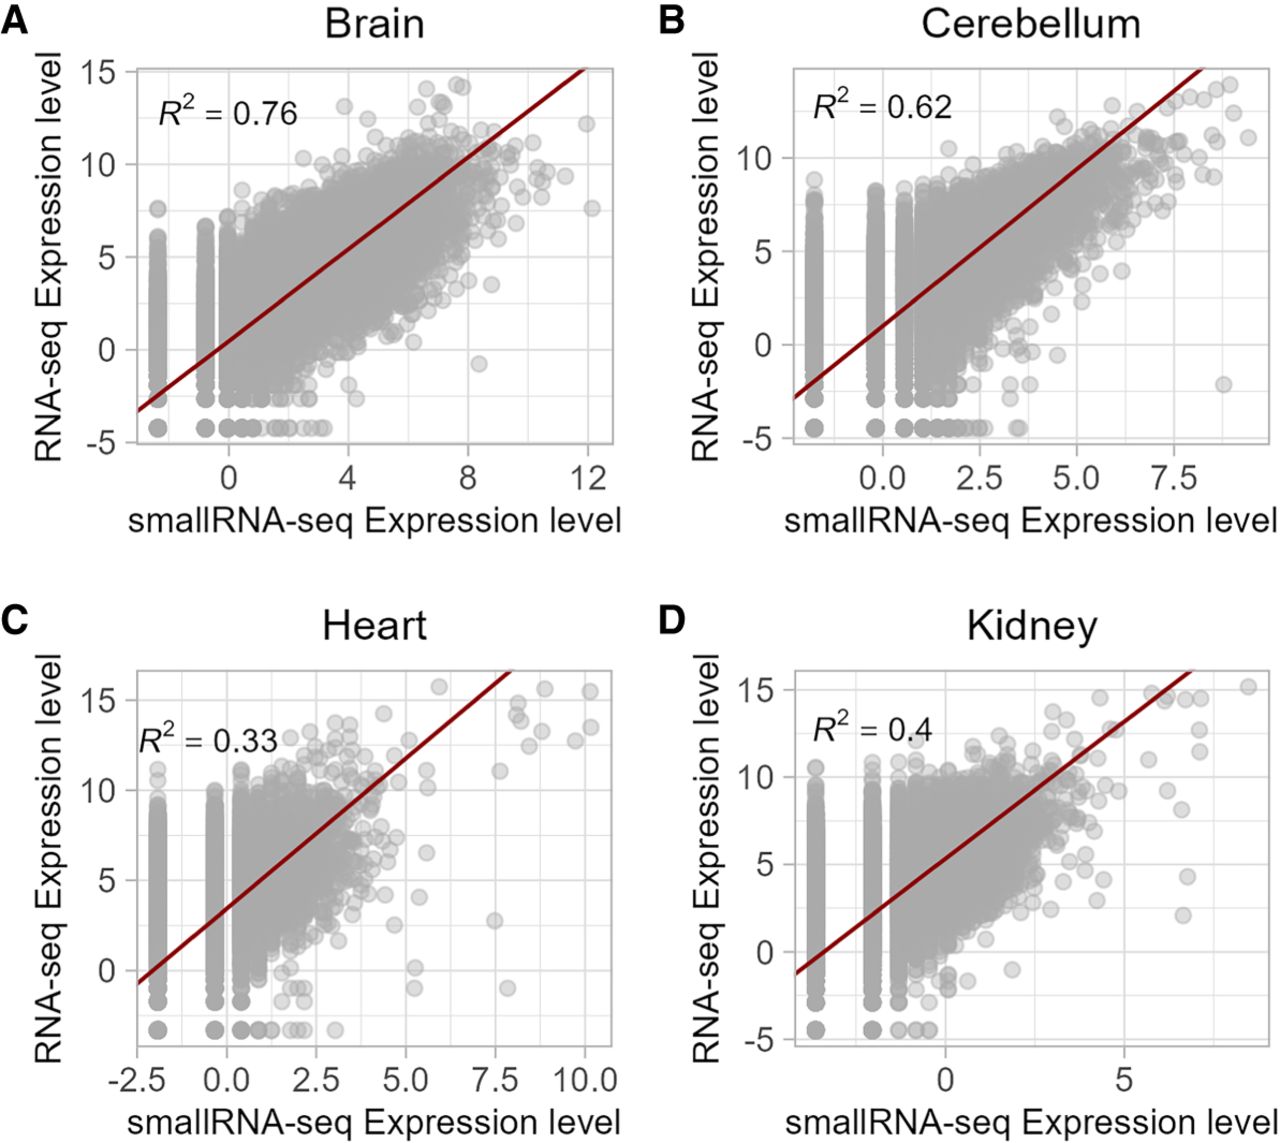
Figure 1.
Comparison of the expression levels of protein-coding transcripts from RNA-seq and sRNA-seq matches data sets. Noncoding RNAs were removed from the data set and only protein-coding genes included. The normalized expression level (VOOM transform; see Methods) from matched samples was plotted for brain (A), cerebellum (B), heart (C), and kidney (D) healthy human samples (Brawand et al. 2011; Meunier et al. 2013). A regression line was fitted in all four plots (red line), and the coefficient of determination (R2) was given within the plot.