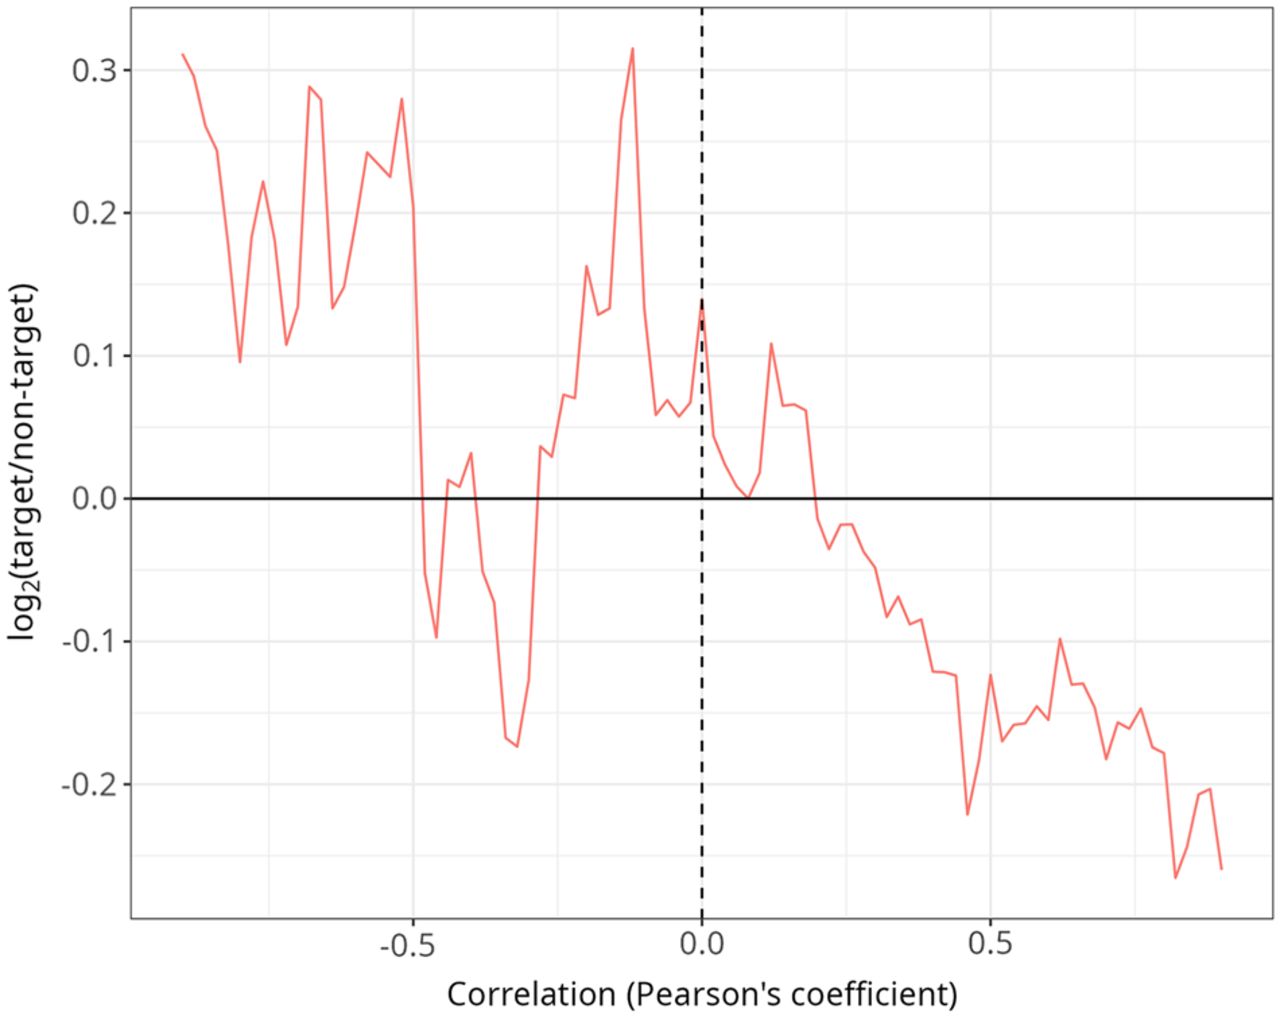
Figure 2.
Coexpression of miRNAs and their targets within sRNA-seq experiments. For all pairwise comparisons between a miRNA and a protein-coding gene, the x-axis gives the correlation of expression values in the human samples in Figure 1, and the y-axis shows the log-odds ratio of the proportion of validated target pairs with respect to the total number of pairs in the bin. Each value in the x-axis is a bin of size ±0.2 around the x-axis value in a sliding window analysis with step size of 0.02.