
Abstract
Telomeres gradually shorten at each cell division, and telomerase counteracts this shortening by elongating telomere sequences. This dynamic balance between elongation and shortening results in a steady-state telomere length (TL) distribution. Here, we develop a method for detecting telomeric sequences in Saccharomyces cerevisiae genomes from raw Oxford Nanopore Technologies (ONT) sequencing reads, providing a comprehensive view of TL distributions both genome-wide and at individual chromosome extremities. We analyze the TL distribution in 100 S. cerevisiae strains, representing the genetic and ecological diversity of the species. Our analysis reveals a large diversity in TL distributions within the species, largely driven by interextremity differences, ploidy level, and subtelomere structure. Polyploid strains display significantly longer telomeres than diploid and haploid strains, and experiments with artificially generated polyploids in two independent genetic backgrounds confirm that higher ploidy levels lead to telomere elongation. Furthermore, we find that the subtelomeric Y′ element exerts two distinct and opposing effects: (1) the presence of Y′ elements at a chromosome extremity is associated with shorter telomeres in cis, but (2) the overall Y′ element content in a strain correlates with longer telomeres. Finally, we show that the length of the shortest telomeres remains relatively constant across strains, suggesting a selective constraint at the species level. This study reveals the diversity of TL in S. cerevisiae and highlights key factors shaping TL distributions both genome-wide and at individual chromosome extremities.
Telomeres are repeated sequences found at chromosome extremities, which are essential for genome integrity and control of cell proliferation (Jain and Cooper 2010; Wellinger and Zakian 2012; de Lange 2018). These functions are tightly associated with the regulation of telomere length (TL). Indeed, telomeres are protected by proteins that prevent natural chromosome ends from being recognized as double-strand breaks, which would elicit a DNA damage response and inappropriate repair. In the budding yeast Saccharomyces cerevisiae, these include Rap1 and its cofactors Rif1/Rif2, which are bound to double-stranded DNA (dsDNA) in numbers roughly proportional to TL (Marcand et al. 1997; Levy and Blackburn 2004). In addition, owing to the incomplete replication of chromosome extremities, telomeres shorten at each cell division until they reach a critical length that triggers the DNA damage checkpoint and replicative senescence, a programmed cell cycle arrest that prevents further proliferation (Lundblad and Szostak 1989; Enomoto et al. 2002; Ijpma and Greider 2003). TL must therefore maintain a minimal length to allow for cell division. In most species, including budding yeast, this is accomplished by expressing the telomerase enzyme, which preferentially adds telomeric repeats to shorter telomeres (Greider and Blackburn 1985; Lundblad and Szostak 1989; Teixeira et al. 2004). In S. cerevisiae, telomerase is constitutively expressed, which leads to complex dynamics of progressive telomere shortening interrupted by stochastic elongation by the limiting amount of telomerase that acts on a few telomeres per cell cycle (Mozdy and Cech 2006; Gallardo et al. 2011; Xu et al. 2013). This length regulation ensures an overall equilibrium, but individual TLs are highly variable across different extremities in a given cell and also across different cells for a given extremity (Shampay and Blackburn 1988). TL is thus best described by a steady-state TL distribution, and each species appears to have it set at a characteristic length range (Blackburn and Chiou 1981; Walmsley and Petes 1985; Moyzis et al. 1988; Fajkus et al. 1995; Wicky et al. 1996; Shakirov and Shippen 2004; Cristofari and Lingner 2006; Gomes et al. 2011; Monaghan et al. 2018; Eberhard et al. 2019).
Despite this steady-state TL distribution, the average TL varies broadly across individuals and subpopulations within a species (Walmsley and Petes 1985; Allsopp et al. 1992; Shakirov and Shippen 2004; Gatbonton et al. 2006; Liti et al. 2009; Fulcher et al. 2015; Eberhard et al. 2019; D'Angiolo et al. 2023; O'Donnell et al. 2023; Karimian et al. 2024). In S. cerevisiae, early studies based on terminal restriction fragment Southern blots revealed moderate variations in the average TL in a limited number of laboratory and wild strains (Walmsley and Petes 1985; Gatbonton et al. 2006; Liti et al. 2009). More recently, larger variations in TL across natural isolates have been reported (D'Angiolo et al. 2023; O'Donnell et al. 2023). Using short-read whole-genome sequencing data, D'Angiolo and colleagues (2023) found that wild strains display shorter telomeres than strains from domesticated environments, a difference partially driven by mitochondrial metabolism. We previously generated telomere-to-telomere genome assemblies for 142 natural yeast isolates (the “Saccharomyces cerevisiae Reference Assembly Panel,” or ScRAP), which further allowed us to show that TL varies among chromosome extremities and across strains and that subtelomeric composition contributed to these variations (O'Donnell et al. 2023). Recently, Sholes and colleagues (2022) used Oxford Nanopore Technologies (ONT) sequencing to measure the full TL distribution and reported that in the W303 laboratory strain, each chromosome end had a specific and stable TL distribution. These observations, since then extended to human telomeres (Karimian et al. 2024; Sanchez et al. 2024; Schmidt et al. 2024), suggest the existence of chromosome-end-specific factors contributing to TL regulation.
Here, we used ONT sequencing to characterize the full TL distribution at each individual chromosome extremity and globally for 100 natural yeast strains. We aim at providing a representative view of TL diversity in S. cerevisiae and propose to uncover several features that may underlie TL variations both within and across genomes.
Results
Single-molecule sequencing provides a complete view of TL distribution
We developed a pipeline to identify telomeric sequences in individual ONT reads (Fig. 1A). After basecalling and adapter removal, the reads are mapped onto the genome assembly of the target strain. The reads that align with chromosome extremities are scanned for telomeric sequences using Telofinder, a script designed to specifically detect the degenerated yeast telomere motif TG1–3/C1–3A (O'Donnell et al. 2023). Finally, after filtering steps ensuring that the telomere sequences are not truncated or internal (Supplemental Fig. S1A), the lengths of all validated telomere sequences are aggregated into a high-resolution TL distribution (Fig. 1B,C). Importantly, because typical ONT reads are tens to hundreds of times longer than TL, the read length did not affect the computed TL distribution (Supplemental Fig. S1B), ensuring the robustness of the method with respect to variations during DNA extraction and sequencing.
High-resolution TL distribution from ONT sequencing. (A) Bioinformatic pipeline to retrieve TLs from single-molecule ONT sequencing. The raw electric signal from nanopores was basecalled using the super accuracy mode of Guppy (step 1). Barcodes and adapters were then removed by Porechop (step 2), and candidate sequences mapping to the telomere regions of the corresponding genome assembly were selected (step 3). The initial reads corresponding to these candidates were scanned for telomere sequences using Telofinder (step 4) and validated as telomeric reads if compliant with specific quality filters (step 5), including a mapping quality (MAPQ) threshold and a test for the presence of an adapter at the 3′ end of the molecule for TG(1–3) sequences (gray arrows). Global and extremity-specific TL distributions are then computed. (B) TL distributions of the wild-type W303 strain and its yku80Δ derivative, represented by a boxplot (top graph; successive box edges indicate 50%, 75%, 87.5%, 93.75%, etc., of the data) or by its density (bottom graph), obtained from ONT sequencing using the bioinformatic analysis pipeline described in A. The shaded area indicates the 95% confidence interval of the sampling noise, inferred from bootstrapping. The mean value is indicated by the dotted line. The detailed metrics are shown in the insets. (C) TL distribution of strain AHG, using data from O'Donnell et al. (2023) (Exp #1) and from a new sequencing (Exp #2). Same representation as in B.
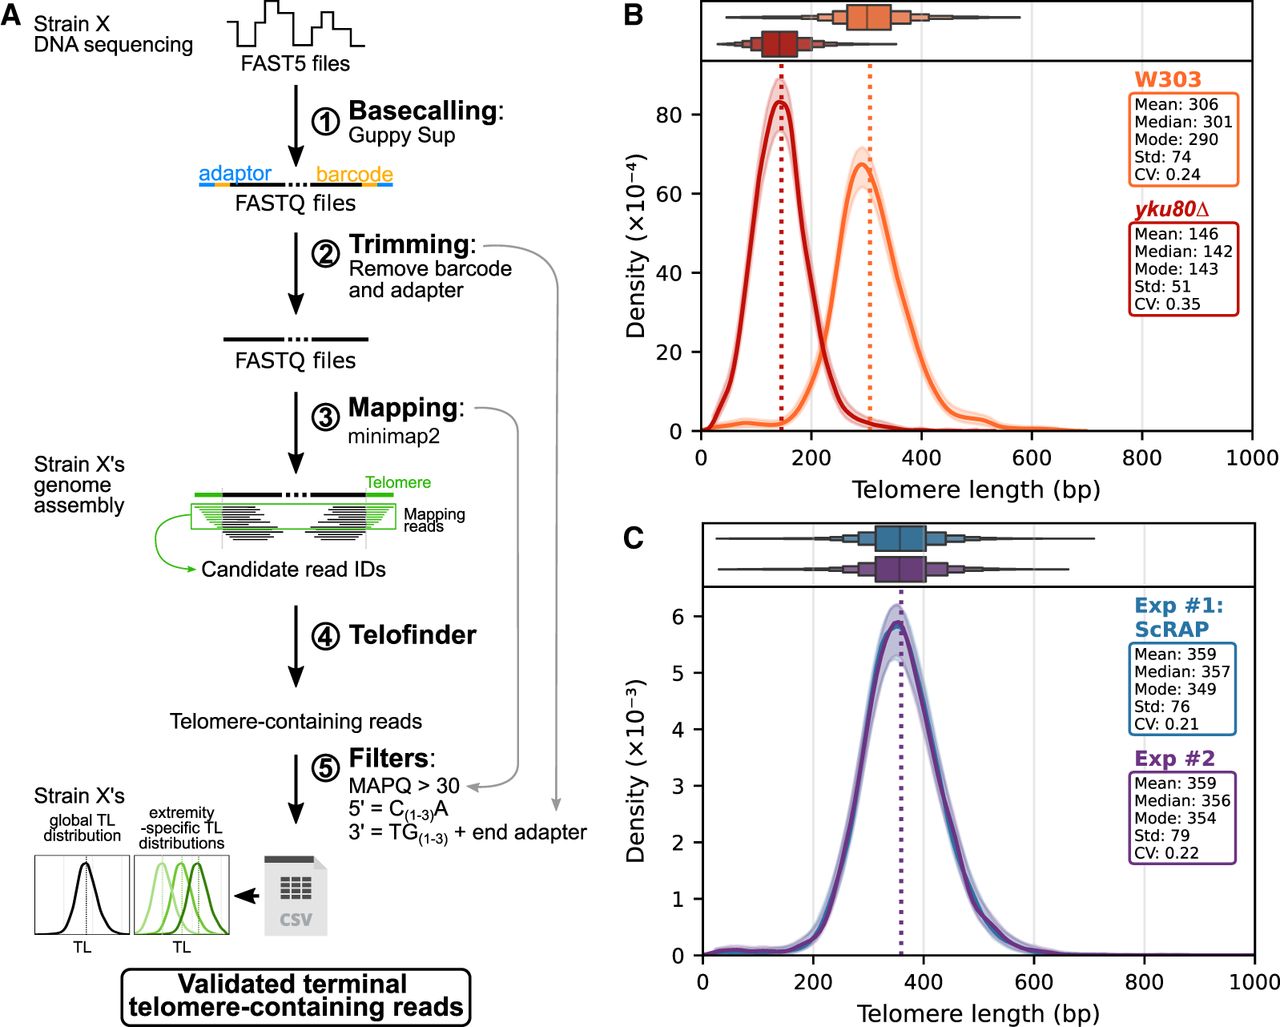
First, we tested the ability of our methodology to detect biologically relevant TL differences by comparing TL distributions between the wild-type (WT) W303 laboratory strain and its yku80Δ derivative, in which the function of the Ku complex is impaired, leading to significantly shorter telomeres (Porter et al. 1996). Our method measured a mean TL that was ∼164 bp shorter in yku80Δ compared with the WT (Fig. 1B; Supplemental Fig. S1C,D), which is fully consistent with previously reported estimates (Bertuch and Lundblad 2003; Chen et al. 2018). The TL distribution in the yku80Δ mutant was also narrower (average standard deviation of 60 bp compared with 77 bp in the WT), likely owing to constraints preventing telomeres from becoming too short.
Second, we tested the reproducibility of our methodology by comparing TL distributions between independent sequencing experiments derived from biological replicates. We used a natural strain isolated from pear must (AHG) for which the first set of reads was recovered from the ScRAP study (O'Donnell et al. 2023), and the second set of reads was obtained from a new ONT sequencing performed in the frame of this study. We found an excellent agreement between the results of two independent experiments (Fig. 1C). We also tested the robustness of TL distribution measurements across ONT technologies and sequenced biological replicates of the W303 strain and its yku80Δ derivative with both R9.4.1 flowcells and the currently available R10.4.1 flowcells. The two flowcell technologies yielded nearly identical distributions (Supplemental Fig. S1C–E). Nonetheless, for the sequencing based on the R9.4.1 flowcells, the comparison between TL distributions derived from the C-rich strand and the G-rich strand showed a minor difference in means (5–20 bp longer for the G-rich distribution), which was completely eliminated with the R10.4.1 flowcells (Supplemental Fig. S1E), indicating a slight technical, rather than biological, bias associated with R9.4.1 flowcells.
Overall, our method derives accurate, robust, and biologically informative TL distributions directly from ONT sequencing reads. It is highly versatile, as it can be applied to any S. cerevisiae sequencing data set without any particular telomere enrichment step, enabling the investigation of TL distribution diversity across numerous strains.
TL distributions are highly diverse across S. cerevisiae strains
We measured TL distributions in a panel of 100 strains, representing the ecological and geographical diversity of S. cerevisiae (Fig. 2A,B; O'Donnell et al. 2023). This representative data set provided a general overview of TL distribution at the species level by aggregating telomeric reads from all 100 strains (Supplemental Fig. S2A). The mean ± standard deviation TL was measured at 366 ± 137 bp, which is slightly longer than commonly reported estimates in laboratory strains (Wellinger and Zakian 2012), with the first and 99th TL percentiles at 112 and 827 bp, respectively.
Natural diversity of the TL distribution in S. cerevisiae. (A) Phylogenetic tree and clade classification from the work of O'Donnell et al. (2023). For each strain, the TL distribution is represented as a boxplot. (B) TL distributions for four strains, selected to illustrate the diversity in means and standard deviations. (C) Boxplots of the TL means of wild, domesticated, and human-associated strains. P-values from Tukey's HSD tests are shown (initial ANOVA test P-value = 0.22). (D) Boxplots of TL means of haploid, diploid, triploid, and tetraploid strains. P-values from Tukey's HSD tests are shown (initial ANOVA test P-value = 0.003). Nonsignificant differences are shown in gray; significant ones, in black.
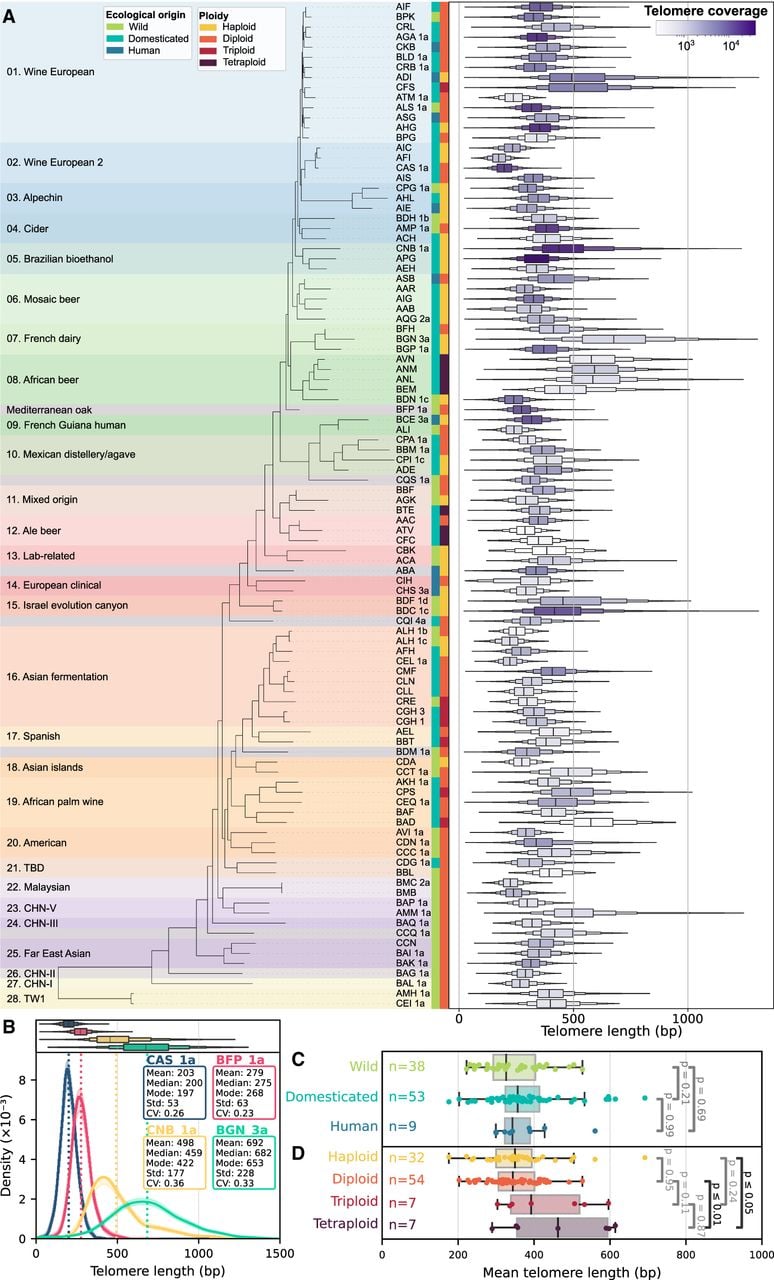
Among the strains, the mean TL varied significantly, ranging from 176 bp in strain AFI, associated with European wine, to 682 bp in strain BGN_3a, sampled from French dairy, with ∼50% of strains having TL means within the 300–400 bp range. Examples of four strains with diverse TL distributions in terms of means and standard deviations are shown in Figure 2B. Within the same clade, although some strains presented similar TL distributions (e.g., ADI and CFS, from clade “Wine European”), others exhibited vastly different ones (e.g., BAP_1a and AMM_1a, from clade “CHN-V”) (Fig. 2A; Supplemental Fig. S2B–D). Notably, differences between mean TLs did not correlate with phylogenetic distances, whether within or between clades (Supplemental Fig. S2B). A correlation could only be detected for the most closely related strains (r² = 0.4 for the top 4% closest pairs of strain) (Supplemental Fig. S2C). Overall, this level of TL variation across strains far exceeded that observed between biological replicates (Fig. 1C; Supplemental Fig. S1C,D), indicating that TL is controlled in a strain-specific manner.
Additionally, comparing TL distributions across strains revealed striking variations in other metrics, including several that were previously inaccessible. Notably, the standard deviation of the distributions varied from 44 to 228 bp, correlating with the mean (Supplemental Fig. S2E). The coefficient of variation (CV; computed as the standard deviation divided by the mean) was around 0.26 but varied from 0.19 to 0.39, indicating that the standard deviation did not simply scale with the mean TL (Supplemental Fig. S2F). Skewness displayed values from −0.51 to 4.79, with most strains (n = 85 out of 100) exhibiting positively skewed distributions, an asymmetry consistent with the counterselection of critically short telomeres, as supported by mathematical modeling (Xu et al. 2013). The robust kurtosis values ranged from 3.41 to 7.22, with a mean of 5.22, indicating a tendency toward leptokurtic distributions, namely, shaped with sharper peaks and heavier tails than a normal distribution, suggesting a rather loose regulation of very long telomeres.
The factors that control TL distributions and their variations across strains are not known. We tested whether the ecological origins of the strains could influence TL but did not find any significant difference in the mean TL (Fig. 2C). Although not significant in our results possibly because of the limited sample size, there was a trend toward longer telomeres in domesticated strains than in wild strains (Fig. 2C), which is consistent with recent findings (D'Angiolo et al. 2023).
Polyploidy leads to longer telomeres
We found that natural polyploids, particularly tetraploids, exhibited significantly longer mean TLs than haploids and diploids did (Fig. 2D), a trend that had been observed, although not statistically significant, in our previous study (O'Donnell et al. 2023). To experimentally test the effect of polyploidy on TL, we generated homozygous tetraploid strains by recursively crossing mating-proficient versions of two independent homozygous natural diploid strains (YPS128 from North America and DBVPG6044 from West Africa) with their haploid derivative (Supplemental Fig. S3A; Cubillos et al. 2009; Louvel et al. 2014). In both backgrounds, the tetraploid strain displayed a global TL mean substantially longer than the TL mean of the initial diploid strain (391 ± 83 bp compared to 324 ± 66 bp in YPS128 background; 453 ± 98 bp compared to 415 ± 96 bp in DBVPG6044 background) (Fig. 3A,B), and longer than the TL mean of the haploid derivatives (Supplemental Fig. S3B,C).
Tetraploids exhibit longer telomeres than isogenic homozygous diploids. (A) Global TL distributions of the natural North American diploid strain YPS128 and the experimentally generated isogenic tetraploid. (B) Global TL distributions of the natural West African diploid strain DBVPG6044 and the experimentally generated isogenic tetraploid. (C) Boxplots of extremity-specific TL distributions for all extremities, shown for the four strains from A and B (same color code).
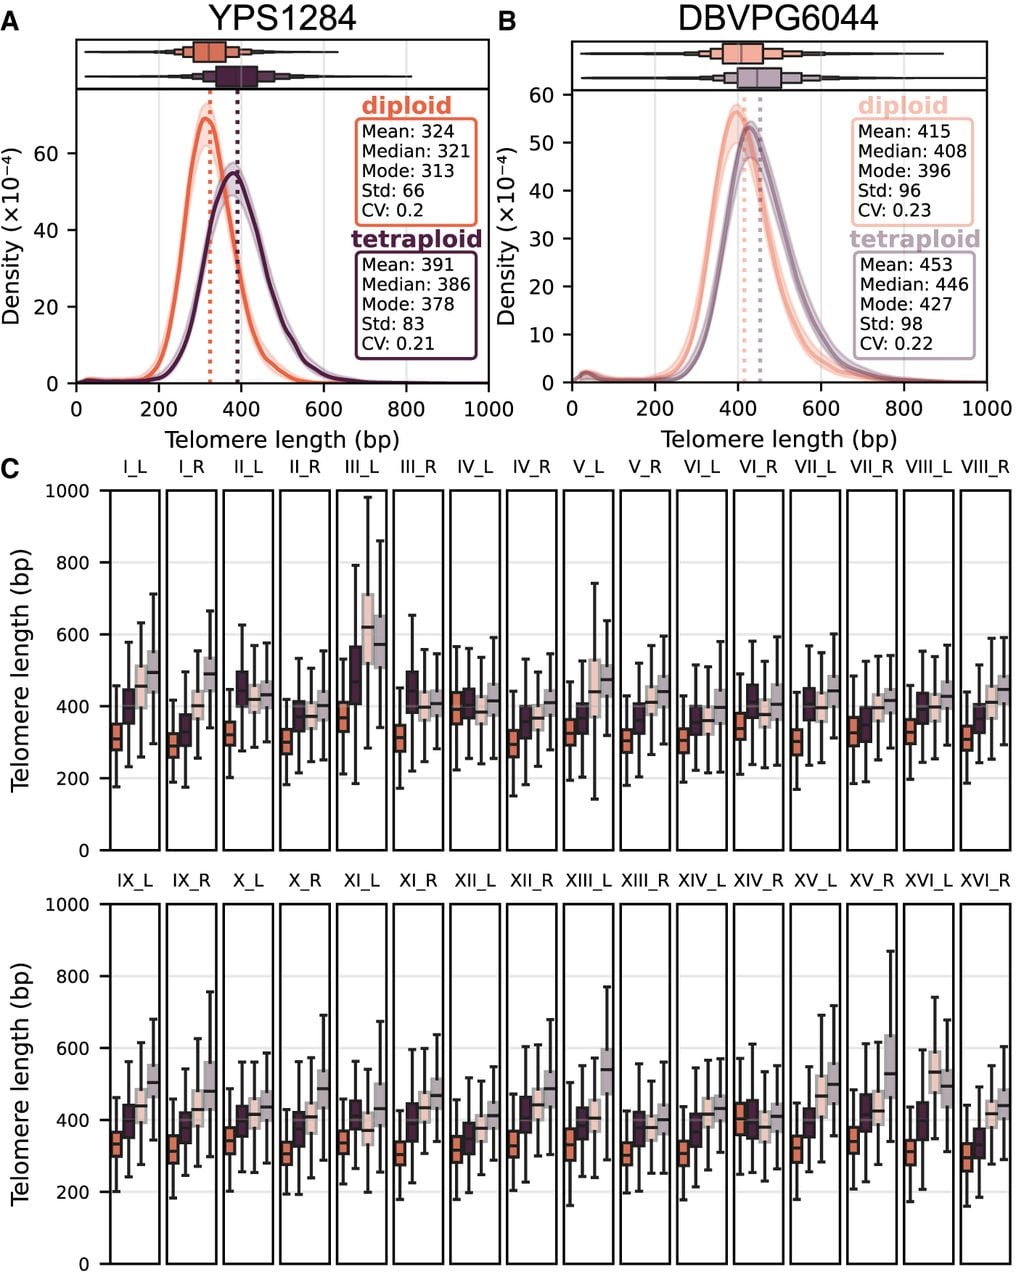
In addition, by assigning each telomere-containing read to a specific chromosome end using the subtelomere sequence as an anchor, our pipeline was also able to derive the complete distributions of extremity-specific TLs (Fig. 3C). The TL difference between the tetraploid and diploid strains was observed at 31 and 30 out of 32 individual chromosome extremities for YPS128 and DBVPG6044 backgrounds, respectively, indicating that TL elongation in the tetraploid strains reflects a genome-wide regulatory effect rather than changes at specific chromosome extremities (Fig. 3C). We thus conclude that ploidy increase beyond diploidy leads to longer telomeres.
TL distributions are extremity specific, and interextremity differences vary across strains
Chromosome-end-specific differences in steady-state TL have been reported in laboratory yeast strains, using ONT sequencing (Sholes et al. 2022). We previously extended this observation to diverse natural yeast strains using estimates based on genome assemblies (O'Donnell et al. 2023). These observations were enabled by the long reads allowing accurate anchoring of telomere sequences to their corresponding chromosome extremity.
Here, beyond deriving strain-specific TL distributions, we obtained the distributions of extremity-specific TLs (Fig. 4A). The means of these extremity-specific TL distributions correlated well with the TL values obtained from the genome assemblies (r2 = 0.9), with most values differing by <10% (Supplemental Fig. S4A). However, for 12% (respectively, 1%) of the extremities, the assembly-based TL values underestimated (respectively, overestimated) the mean TL by ≥20%. Importantly, the method presented in this work not only corrects for the assembly-level inaccuracies at telomeres but also provides whole extremity-specific TL distributions, which are not accessible from genome assemblies and contain much richer information.
Diversity of extremity-specific TL in natural S. cerevisiae strains. (A) TL distributions at every chromosome extremity for four selected strains, represented as boxplots with individual read TLs plotted as dots. (B) 2D plot displaying the CVs of extremity-specific TL means and the CVs of extremity-specific TL distributions CVs. Each strain is represented as a dot, and this 2D space is divided vertically and horizontally into two equally sized areas. Open dots indicate strains for which the sample size of the reads was insufficient for confident inference. The four strains shown in A as well as W303 and its yku80Δ derivative are labeled in color. (C) TL distributions at every chromosome extremity for W303 and its derived yku80Δ mutant.
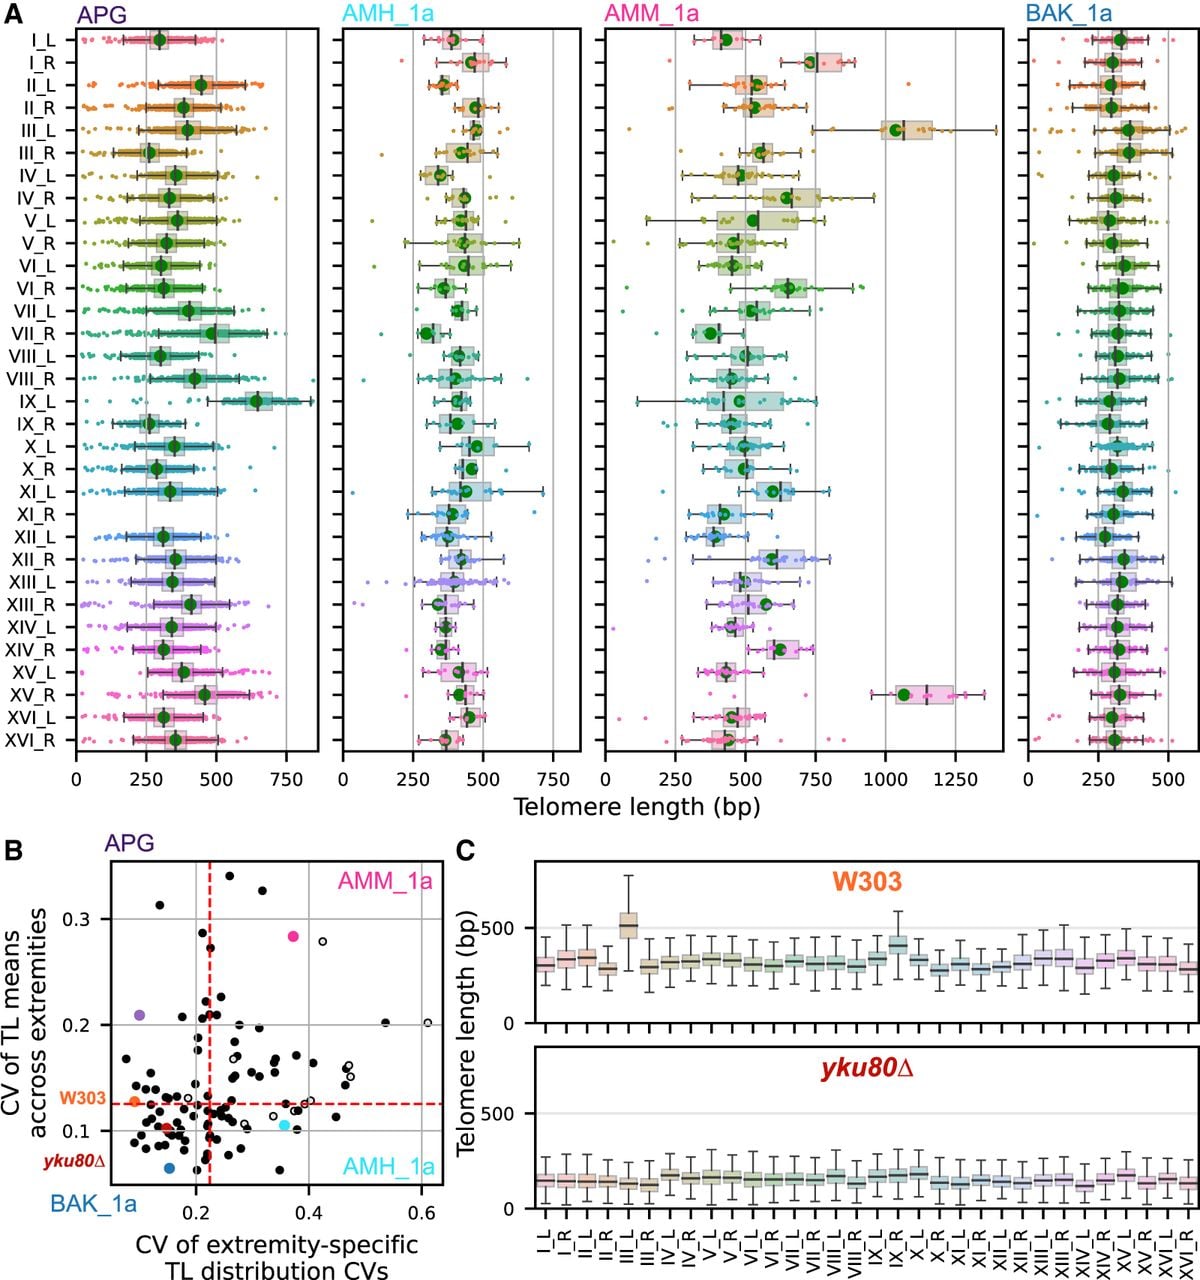
Although we confirmed that TL means were extremity specific for most strains, we found that the extent of the interextremity differences within a strain varied widely (Fig. 4A). For example, strain APG associated with Brazilian bioethanol exhibited differences in mean TL between extremities, whereas the standard deviation across extremities remained rather constant. Conversely, strain AMH_1a (clade “TW1”) presented variable standard deviations but quite homogeneous TL means. In contrast, in AMM_1a (clade “CHN-V”), both the TL means and standard deviations (and even CVs) were highly variable from extremity to extremity. Finally, other strains displayed similar extremity-specific TL distributions in terms of both the mean and standard deviation at all extremities (e.g., BAK_1a, from clade “Far East Asian”). To systematically survey the interextremity differences both in means and CVs (as illustrated by the four examples in Fig. 4A), we plotted the interextremity CV of the means and the interextremity CV of the CVs on a 2D graph for all strains (Fig. 4B). Here, the CV was chosen to measure variation preferentially over the standard deviation, because it allows direct comparison by normalizing the standard deviation by the mean. We took into account the possibility that, for some strains, the coverage by telomere-containing reads might be too low to confidently derive the interextremity CV of the means or CV of the CVs, and we estimated the minimum coverage required for each strain (Supplemental Fig. S4B–K). The coverage of 11 strains did not meet the criteria, and their interextremity CV of the mean or CV of the CVs were likely overestimated (Fig. 4B, open dots; for example, see Supplemental Fig. S4B,C).
Our panel of strains was spread over the 2D space of this plot, revealing distinct TL distribution patterns across extremities. We also placed W303 and its derived yku80Δ mutant on this plot, which revealed that they presented low interextremity variations (Fig. 4B). Upon closer inspection of their extremity-specific TL distributions, we found that the interextremity differences displayed in the WT W303 were suppressed in yku80Δ, particularly the longer TL at ChrIII_L (Fig. 4C). Overall, strains can exhibit high variability in extremity-specific mean TL or CV or both, suggesting different drivers of TL diversity within the same species.
Large global TL variations primarily result from interextremity differences
Given the substantial interextremity differences in mean TL observed at the strain level, we systematically investigated their contribution to global TL variations compared with the contribution of within-extremity variations. Put differently, do global strain-specific TL variations primarily reflect TL variations at each extremity, or are they driven by differences in the mean TL between extremities?
To quantify the contribution of interextremity differences for each strain, we computed the CV of the extremity-specific TL means, reflecting the interextremity variation, and plotted it against the CV of the global TL distribution (Fig. 5A, red, B). We found a strong correlation between these two values across strains (r2 = 0.82, P-value = 4 × 10⁻²⁵). The slope of the correlation was equal to 1.1, indicating that any increase in global TL variation stemmed mostly from accrued interextremity differences. Conversely, we plotted the mean of the CVs of extremity-specific TL distributions in a strain, reflecting the average within-extremity variation, against the CV of the global TL distribution (Fig. 5A, blue). We observed that the mean extremity-specific CV scaled with the global CV, with a much lower slope of 0.3 and correlation (r2 = 0.53, P-value = 1 × 10⁻⁸). Even strains with high global CVs (e.g., >0.3) still showed moderately increased extremity-specific CVs of 0.2–0.25, differing only slightly from strains with lower global CVs.
Contributions to global TL variations. (A) The mean of extremity-specific TL distribution CVs, reflecting the average within-extremity variation, is plotted against the global TL distribution CV as a blue dot for each strain. The CV of the distribution of extremity-specific TL means, reflecting interextremity variation, is plotted against the global TL distribution CV as a red dot for each strain. (B) Global TL distribution (blue; upper part of each graph) and distribution of extremity-specific TL means (salmon; lower part of each graph) are displayed for all strains, ranked by increasing median TL. A boxplot representing 50% of the values is superimposed on the density plot. (C) Median and first and 99th percentiles of the global TL distribution are displayed for each strain. Strains are ordered by increasing median TL. (D) The first (purple) and 99th (mauve) percentiles of the global TL distribution for each strain are plotted against the median TL, and the linear regressions are shown.
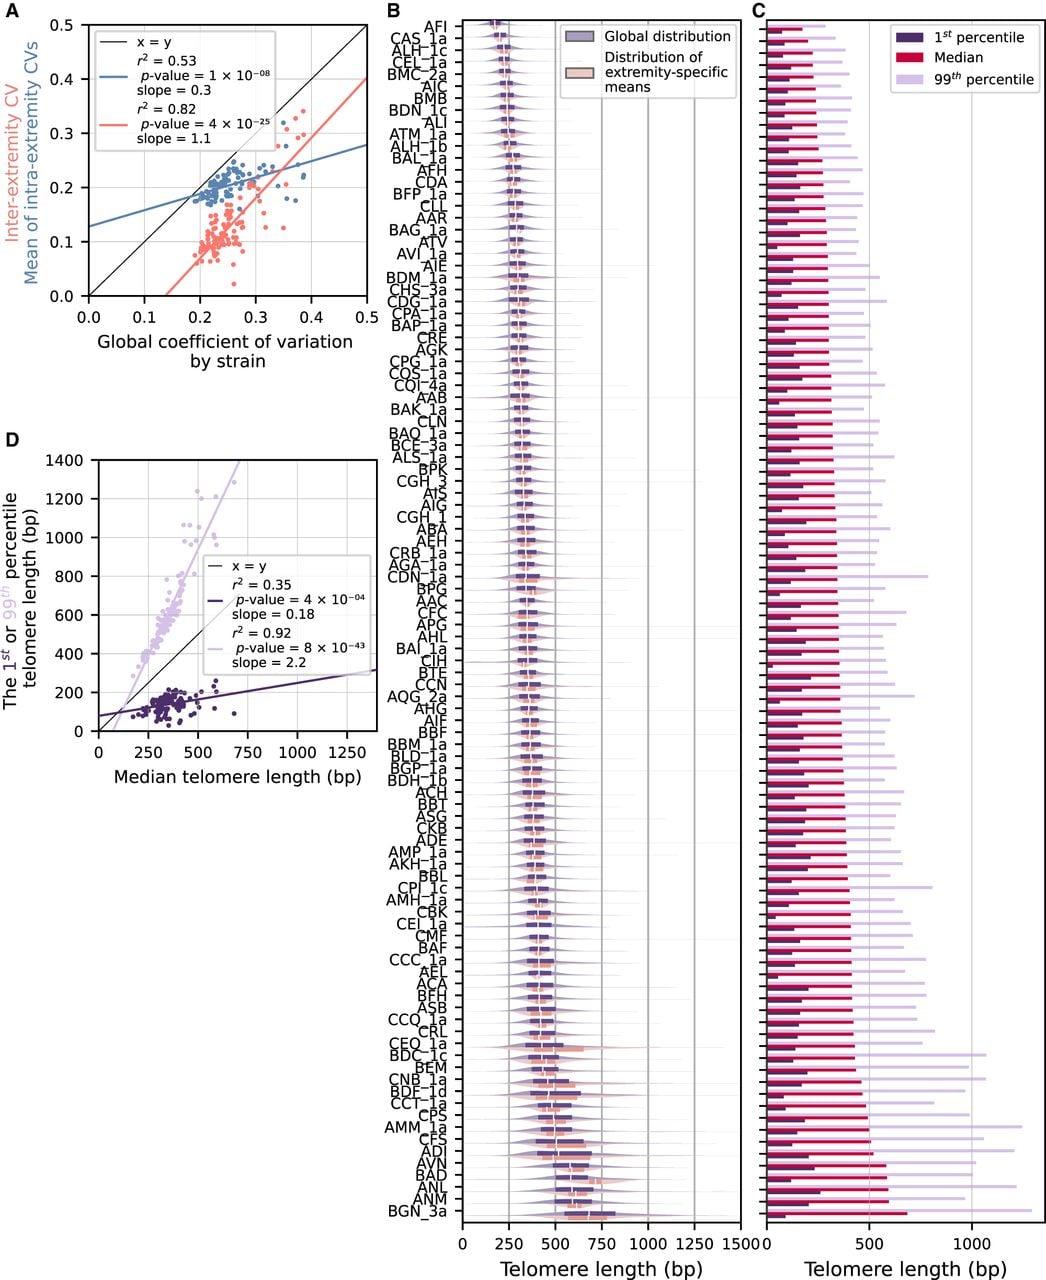
Thus, global TL distribution variation at the strain level comprises two components: the variations found at each extremity-specific TL distribution and the differences in TL between extremities. The latter accounts for most of the observed TL variations between strains.
The length of the shortest telomeres is constant at the species level
Telomerase acts preferentially on shorter telomeres and prevents them from reaching a critical length (Teixeira et al. 2004). Telomere elongation, combined with progressive telomere shortening, thus constrains the average length of the shortest telomeres in a population of cells. Given the extent of natural TL variations that we revealed, we wondered whether different strains presented different lengths for the shortest telomeres.
We thus calculated the lowest percentile of the TL distribution of each strain and compared it to the median TL (Fig. 5C). When plotted for all strains ranked according to increasing median TL, we found that the lowest percentile did not increase substantially and fluctuated around 138 ± 45 bp, whereas the 99th percentile (longest telomeres) did. To quantitatively evaluate this observation, we calculated the Pearson's correlation values of the first and 99th percentiles with the median and obtained correlations of r2 = 0.35 and 0.92, respectively (Fig. 5D). The value of the first percentile was thus only marginally correlated with the median TL length across strains.
To assess the extent to which the length of short telomeres was poorly correlated with the median, we plotted the Pearson's correlation between the nth percentile and the median TL and found that the second (or third, respectively) percentile had a r2 value of 0.66 (respectively, 0.81), which was significantly lower than the plateau at one (Supplemental Fig. S5A). For a haploid genome with 32 telomeres, the length of the shortest telomere should be found among the 1/32 = 3.1% lowest TL values in a distribution. The relatively weak correlation between the first and third percentiles and the median TL suggested that the length of the shortest telomere might be kept constant at the species level, regardless of the median TL.
Because extremity-specific differences in TL are observed in many strains, we wondered whether some particular chromosome extremities might bear shorter TLs more frequently than others do. We thus evaluated the representation of each extremity in the individual telomeres shorter than the first (or fifth, respectively) percentile across strains and found no significant enrichment of any of them (Supplemental Fig. S5B,C, respectively), indicating that the telomere of any chromosome extremity could be among the shortest. In contrast, we found an overrepresentation of ChrIII_L, ChrXII_R, ChrXIII_R, and ChrXV_R among telomeres longer than the 99th percentile (only ChrIII_L among telomeres longer than the 95th percentile) of the distributions across strains (Supplemental Fig. S5D,E). To perform further analysis, we then asked whether the shortest extremity-specific telomere on average in a strain would be enriched among the individual telomeres shorter than the first (or fifth, respectively) percentile (Supplemental Fig. S5F,G, respectively). For each strain, we ranked each chromosome extremity from the shortest associated mean TL to the longest associated mean TL and calculated their enrichment within the first (or fifth, respectively) percentile across strains. Even here, we barely found an enrichment for the strain-specific extremity associated with the shortest and second shortest mean TLs within the first percentile (the five shortest TLs were enriched within the fifth percentile, respectively), with Log2 enrichment values below one (or two, respectively) (Supplemental Fig. S5F,G, respectively). Conversely, extremities associated with greater mean TL in each strain were highly overrepresented within the 99th (or 95th, respectively) percentile or longer with Log2 enrichment values exceeding four (or two, respectively) (Supplemental Fig. S5H,I, respectively). Overall, we demonstrate that throughout the diversity of natural yeast strains, any chromosome extremity can bear the shortest telomere(s) with nearly equal frequency, an important finding to consider when studying the functional consequences of the shortest telomere(s).
Subtelomeric Y′ and Ty5 elements are associated with TL variation in cis
The observation that TL distributions are often extremity specific suggested the presence of cis regulatory elements. We thus compared extremity-specific TL distributions across strains, with or without elements commonly found at subtelomeres such as X and Y′ elements, as well as Ty5 retrotransposons. To account for different global TL means in different strains, we normalized each extremity-specific TL by the global TL mean of the corresponding strain, thus allowing the aggregation of normalized values across strains. The presence or absence of the X element in the adjacent subtelomere did not significantly affect the normalized extremity-specific mean TL (Fig. 6A). In contrast, the presence of Ty5 in the cis subtelomere was associated with a significantly greater normalized extremity-specific mean TL (Fig. 6B), although the imbalance between the number of subtelomeres with and without Ty5 prevented more detailed analyses at the level of each extremity across strains.
Association between the presence of subtelomeric elements and TL. (A) Distributions of the normalized extremity-specific TL means across the extremities of all strains, clustered according to the presence or absence of the X element in the corresponding subtelomere. The number of chromosome extremities in each group is indicated by “n”. The P-value from a Student's t-test is indicated. (B) Same as A but with respect to the presence or absence of the Ty5 retrotransposon in the corresponding subtelomere. (C) Same as A but with respect to the presence or absence of Y′ elements in the corresponding subtelomere. (D) Same as C but with respect to the number of tandem Y′ elements in the corresponding subtelomere. (E) For each strain, extremities are clustered according to the presence (green dots) or absence (red dots) of the Y′ element. For each strain and within each cluster, the average of normalized extremity-specific TLs is plotted against fraction of extremities with Y′ elements in the same strain.
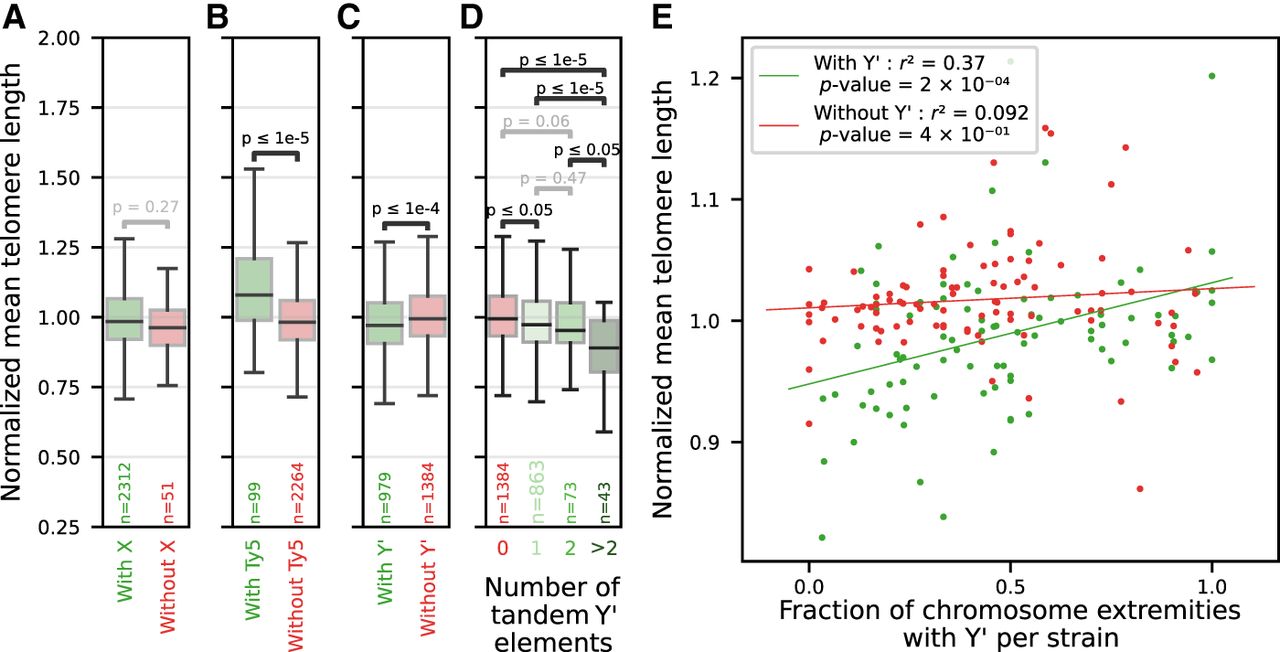
The presence of Y′ elements in the subtelomere was associated with a significantly lower normalized extremity-specific mean TL (Fig. 6C), as well as increased standard deviation, CV, and skewness (Supplemental Fig. S6A–C). This effect was significantly stronger for chromosome extremities bearing more than two Y′ elements in tandem (Fig. 6D). Looking closely at each chromosome extremity across strains, this negative association between presence of Y′ elements and TL was verified for 21 out of 32 extremities (66%) and was reversed only at four extremities (Supplemental Fig. S6D). Because interstitial telomere sequences (ITSs) are often found centromere-proximal to Y′ elements, they could act as a likely negative regulator of TL in cis, but we did not detect a significant correlation between the normalized extremity-specific mean TL and total ITS length in the corresponding subtelomere (Supplemental Fig. S6E).
However, without normalization by the global TL mean per strain, the relationship was reversed, and the presence of Y′ elements at a chromosome extremity appeared rather associated with longer telomeres in cis (Supplemental Fig. S6F). This was because of a positive correlation between the global TL mean per strain and the fraction of subtelomeres bearing the Y′ element in each strain (Supplemental Fig. S6G). When the chromosome extremities of each strain were clustered into Y′-containing and non-Y′-containing, we found that the mean TL of Y′-containing extremities in a strain increased as a function of the fraction of Y′-bearing extremities in the same strain (Fig. 6E). In contrast, the mean TL of non-Y′-containing extremities did not correlate with this fraction. Thus, Y′ elements had two distinct effects on TL: (1) TL positively correlated with the overall Y′ content in a strain, but only for chromosome extremities with Y′ elements, revealing a positive trans effect, and (2) within each strain, Y′-associated telomeres were, however, shorter than telomeres at other extremities, indicative of a negative cis effect.
Overall, Y′ elements might provide a local genomic feature as a cause for interextremity TL differences, both through their trans and cis effects. Whether the Y′ element directly regulates TL through a binding factor or alters the local chromatin structure, thereby affecting TL homeostasis, remains to be investigated.
Discussion
S. cerevisiae is a major genetic model organism in the telomere field (Wellinger and Zakian 2012; Teixeira 2013). In contrast to the large body of work using laboratory strains, relatively little is known about TL regulation and distribution in natural yeast strains. Recent large-scale population genomics studies revealed great genetic diversity encompassing, beyond single-nucleotide polymorphisms, structural variations, aneuploidies, and polyploidies (Peter et al. 2018; O'Donnell et al. 2023). We consider TL as yet another genomic variant, albeit one that is dynamic and complex, but its diversity within the species has not yet been investigated in depth. Exploring and characterizing TL distributions in natural strains would expand our understanding of telomere regulation and help interpret telomere biology in light of the budding yeast natural history, ecology, and evolution. As a first step toward this goal, in this work, we provide a detailed characterization of TL distributions in a panel of natural isolates recently sequenced by long-read ONT sequencing (O'Donnell et al. 2023) and derive biologically relevant insights.
We observed a large diversity of TL distributions across a representative panel of strains. Compared with the commonly studied laboratory strains, some strains present much shorter or longer mean TLs, which might be explained by genetic variants and differences in the molecular mechanisms governing TL regulation. Genome-wide association studies (GWAS) or linkage analyses could leverage the genetic diversity to identify new genes or variants contributing to TL regulation, an approach that has yielded important insight into TL regulators (Gatbonton et al. 2006; Liti et al. 2009). Furthermore, TL diversity goes beyond variations of the mean. The standard deviation, CV, skewness, and kurtosis all show substantial differences, even within the same clade. Because TL distribution is fundamentally shaped by the dynamics of telomere shortening and elongation by telomerase, the diversity of TL distributions in natural strains suggests that they differ in some or all aspects of these mechanisms.
For example, in our data set, natural polyploids exhibit longer telomeres than diploids, and because domesticated strains are particularly enriched in polyploids (Supplemental Table S1), this may partially account for their tendency to have longer telomeres (D'Angiolo et al. 2023). Notably, we demonstrate that experimentally generated tetraploid strains display longer telomeres than the isogenic natural diploid strains across virtually all chromosome extremities, revealing a causal link between ploidy and TL regulation.
For ChrIII-L specifically, Teplitz and colleagues (2026) proposed a molecular mechanism involving heterochromatin on the HML locus promoting telomerase recruitment through the Sir4-yKu pathway in the absence of the Y′ element at the ChrIII-L subtelomere to explain the longer telomeres observed without the Y′ element at this extremity. Consistently with their results, we found that interextremity TL differences, including longer ChrIII-L telomeres, are eliminated in the yku80Δ mutant compared with WT W303, implicating the Ku complex in mediating TL regulation in cis. However, another study showed that deleting all X elements, Y′ elements, or both in a strain engineered to contain only three chromosomes had no significant effect on TL, as measured by Southern blot (Hu et al. 2024), although this technique might not have the resolution to detect subtle differences.
We leveraged the structural diversity found at the subtelomeres of the ScRAP panel of strains to investigate the contribution of subtelomeric elements in cis to TL regulation. We detected a small but significant decrease in the normalized extremity-specific TL mean at chromosome extremities containing one or more Y′ elements. Closer investigation shows that Y′ elements exert their effects at two levels: (1) a positive trans effect whereby the overall Y′ content is associated with longer TL at Y′-containing extremities and (2) a negative cis effect whereby the presence of Y′ elements is associated with shorter TL at the corresponding chromosome end. We thus propose that, as a general rule, Y′ elements and possibly Ty5 retrotransposons, but not X elements, influence TL in cis, thus contributing to TL variations between extremities. A plausible mechanism to explain the complex relationship with Y′ elements would be the involvement of a Y′-binding factor that negatively regulates TL in cis, and the strength of this regulation would weaken if more Y′ elements are present in the genome owing to dilution or titration of the limited pool of this factor, thus leading to an apparent positive regulation at a global level. Although this putative factor is not known, it is not related to the ITS commonly found at the centromere-proximal side of the Y′ elements. Further investigations are needed to fully elucidate the molecular mechanisms controlling this aspect of TL regulation.
Although yeast cells constitutively express telomerase, the signaling pathway triggering replicative senescence if a telomere becomes critically short is functional, as revealed in telomerase mutants (Lundblad and Szostak 1989). Selection against critically short telomeres could therefore shape the regulation of TLs so that, with active telomerase, the steady-state TL distribution would not allow senescence to occur at a significant frequency. Conversely, cells might incur a fitness cost for maintaining long telomeres, because replication forks slow down at telomeres and can be stalled by Rap1 and secondary structures such as G-quadruplexes (Ivessa et al. 2002; Lopes et al. 2011; Paeschke et al. 2011; Douglas and Diffley 2021), although no fitness defect was detected in a laboratory strain carrying longer telomeres (Harari et al. 2017). Keeping these two plausible selection forces in mind, our finding that the shortest 1%–3% of telomeres in all strains are maintained at a roughly similar length, with only a relatively low correlation with the median length, would be consistent with selection acting only on the shortest telomeres to keep them just above a detrimental threshold. The first percentile measured at ∼138 bp would provide some margin for the shortest telomeres to shorten and be elongated without crossing the proposed critical threshold lengths between 20 and 80 bp (Abdallah et al. 2009; Strecker et al. 2017; Kockler et al. 2021; Sholes et al. 2022; Rat et al. 2025). Accordingly, we show that natural strains with much longer telomeres generally display steady-state distributions that are more spread, hence the observed large CVs, rather than tight distributions with increased means. The shortest telomeres in a strain do not belong preferentially to one or a few defined extremities, rather, telomeres from any extremity have a similar probability of being among the shortest ones, thus spreading the potential risk associated with being short.
To conclude, we combine the most resolutive TL measurement method to date with a large sample set representing the phylogenetic and ecological diversity of S. cerevisiae to characterize the variability in TL distributions and its sources and infer the effects of ploidy and subtelomere composition on TL. Our work therefore establishes a solid foundation for future studies of TL regulation harnessing the natural diversity of S. cerevisiae.
Methods
Strains and sequencing data
We used data from 100 sequenced strains presented in Supplemental Table S1 and work of O'Donnell et al. (2023). In addition, strain AHG was sequenced again to test the reproducibility of our method, as were the WT W303 (Mata ura3-1 trp1-1 leu2-3,112 his3-11,15 can1-100 RAD5 ADE2) and yku80Δ (strain name: yZX440) strains. YKU80 was deleted by replacement with LEU2 using plasmid pFA6a-LEU2 (Houseley and Tollervey 2011) and standard PCR-based replacement methods (Longtine et al. 1998). The strains were grown in yeast extract, peptone, and dextrose media (YPD) at 30°C.
Artificial polyploid construction
Haploid and homozygous diploid derivatives of the North American (NA) YPS128 and West African (WA) DBVPG6044 strains (Cubillos et al. 2009; Louvel et al. 2014) were engineered to generate a default a-type haploid (YPB001 for the NA strain and YPB002 for the WA strain) and an alpha-mating-proficient diploid (YPB003 for the NA strain and YPB004 for the WA strain) (Supplemental Table S1). Gene replacements at the MAT loci by MATa-URA3 or MATalpha-LEU2 were performed using standard lithium acetate transformation (Gietz and Woods 2002). Strains were recursively mated to increase ploidy and stabilized using a functional isogenic MATa strain. Ploidy of parental and derived lines was verified by propidium iodide staining and flow cytometry (Supplemental Fig. S3A), as described previously (Gómez-Muñoz and Fischer 2025).
Genomic DNA extraction
We grew S. cerevisiae cells picked from a single colony in 10 mL YPD media overnight at 30°C. A total number of cells of 7 × 10⁹ or fewer was used for DNA extraction. High-molecular-weight (HMW) DNA was extracted using Qiagen Genomic-tip 100/G according to the manufacturer's instructions. Alternatively, genomic DNA was extracted using the CTAB method, as previously described (Kaur et al. 2018). Briefly, 2 × 10⁹ cells were incubated for 20 min at 37°C in spheroblasting solution (1 M sorbitol, 50 mM KPO4, 10 mM EDTA) with 1.25 mg of zymolyase 20T. Spheroblasts were pelleted and resuspended in CTAB extraction solution (3% CTAB, 100 mM Tris-HCl, 25 mM EDTA, 2 M NaCl, and 2% PVP40) with 12.5 µL of 20 mg/mL Proteinase K and 2 µL of 100 mg/mL RNase A. After 40 min of incubation at 37°C, the cellular debris were separated from DNA using a chloroform:isoamyl alcohol solution. The CTAB-DNA mixture was subsequently precipitated using a CTAB dilution solution (1% CTAB, 50 mM Tris-HCl, 10 mM EDTA). The precipitate was washed with NaCl solution 1 (0.4 M NaCl, 10 mM Tris-HCl, 1 mM EDTA) to remove the excess of CTAB and then resuspended in NaCl solution 2 (1.42 M NaCl, 10 mM Tris-HCl, 1 mM EDTA). The DNA was precipitated by adding two volumes of absolute ethanol and centrifuging for 2 min at 12,000 rpm. After a wash with 70% ethanol, the DNA were resuspended in TE buffer. DNA quantity was controlled by Qubit dsDNA HS assay.
Oxford Nanopore Technologies sequencing
Library preparation and Oxford Nanopore Technologies (ONT) sequencing were performed based on the protocol of “1D Native barcoding genomic DNA with EXP-NBD104 and SQK-LSK108” when using FLO-MIN106 (R9.4.1) MinION flowcells and the protocol of “1D Genomic DNA by Ligation with EXP-NBD104 and SQK-LSK109—PromethION” when using the FLO-PRO114M (R10.4.1) flowcell. DNA repair and end preparation were performed on up to 2 µg of HMW DNA per sample using the NEBNext FFPE DNA repair mix with the following reaction setup: 48 µL DNA, 3.5 µL NEBNext FFPE DNA repair buffer, 2 µL NEBNext FFPE DNA repair mix, 3.5 µL Ultra II end prep reaction buffer, and 3 µL Ultra II end prep enzyme mix, incubated for 15 min at 20°C followed by 15 min at 65°C. DNA size selection was then carried out using AMPure XP beads (one:one ratio) followed by native barcode ligation (22.5 µL DNA, 2.5 µL native barcode provided by EXP-NBD104 kit and 25 µL Blunt/TA ligase master mix; 20 min at 25°C). After another round of AMPure XP bead clean-up (one:one ratio), the samples were pooled together, and adaptors were ligated for 15 min at 25°C (65 µL DNA, 5 µL adapter mix II [AMII] provided by the EXP-NBD 104 kit, 20 µL NEBNext quick ligation reaction buffer, and 10 µL quick T4 DNA ligase). The adaptor-ligated DNA sample was cleaned up by adding a 0.4 × volume of AMPure XP beads followed by incubation for 5 min at room temperature. When using the SQK-LSK108 kit for FLO-MIN106 MinION flowcells, two successive 140 µL adapter bead binding buffer (ABB) washes were performed. When using the SQK-LSK109 kit for FLO-PRO114M flowcells, two successive 250 µL L fragment buffer washes were performed. The final library was eluted in 15 µL elution buffer and loaded into the MinION or PromethION flowcells according to the ONT manuals.
TL measurement pipeline
All bioinformatic analyses and pipelines were coded in Python (version 3.9.12) with Numpy (version 1.21.6) and Pandas (version 1.4.2) libraries installed. Raw FAST5 files generated from sequencing were basecalled using the Super Accurate model of Guppy (version 6.4.2) followed by Porechop (version 0.2.4; https://github.com/rrwick/Porechop) removal of adapters and barcodes (Fig. 1A). Reads were then mapped to the genome assembly of the same strain using minimap2 (Li 2018; https://github.com/lh3/minimap2) to retrieve the ones mapping to telomeric regions. A mapping quality filter of MAPQ ≥ 30 was applied, eliminating 15% and keeping 85% of the mapped telomeric reads across all samples. We then ran Telofinder (O'Donnell et al. 2023; https://github.com/GillesFischerSorbonne/telofinder) on these selected reads to detect the terminal telomeric sequences. Telofinder calculates the sequence entropy and proportions of dinucleotides (TG/CA, GG/CC, and GT/AC) within a 20 bp sliding window, enabling the detection of degenerated S. cerevisiae telomere motifs (TG)1–6TG2–3/C2–3A(CA)1–6 on ONT reads when specific thresholds are met (polynuc_threshold = 0.8 and entropy_threshold = 0.8). To ensure that the identified sequences corresponded to true telomeres, we verified that a telomeric sequence found at the beginning (5′-end) of a read was C-rich and that one found at the end (3′-end) was G-rich, as expected based on the 5′-3′ orientation of sequencing through the pores. Additionally, for G-rich telomere sequences found at 3′ ends, we selected only reads that contained a terminal adapter to ensure that they were not truncated before sequencing reached the end of the DNA molecule.
Phylogenetic tree processing and visualization
The phylogenetic tree (Fig. 2A) was built based on data from O'Donnell et al. (2023), with adjustments to retain only the 100 leaves representing the 100 strains analyzed here. We used the Bio.Phylo package from Biopython (v1.79) for phylogenetic analysis and iTOL v6 (Letunic and Bork 2024) for visualization.
Plots and statistical analyses
Python with the seaborn (version 0.11.2) and SciPy (version 1.7.3) libraries was used to draw plots and perform the statistical analyses.
Code availability
All the scripts used in this publication can be found as Supplemental Code and are also available at GitHub (https://github.com/Telomere-Genome-Stability/Yeast2025).
Data access
All raw and processed sequencing data (FAST5, POD5, FASTQ, and FASTA files) generated in this study have been submitted to the European Nucleotide Archive (https://www.ebi.ac.uk/ena/browser/home) under accession number PRJEB89249.
Competing interest statement
The authors declare no competing interests.
Acknowledgments
We thank members of G.F.’s and Z.X.’s laboratories for discussions. Research in Z.X.’s laboratory was supported by Agence Nationale de la Recherche (ANR-24-CE12-7740-01 and ANR-24-CE12-0083-03) and Institut National du Cancer (PLBIO20-312). Research in G.F.’s laboratory was supported by Agence Nationale de la Recherche (ANR-24-CE12-7740-02 and ANR-24-CE12-0998-03). E.K.’s work at the Biomics Platform, C2RT, Institut Pasteur, Paris, France, was supported by France Génomique (ANR-10-INBS-09).
Author contributions: C.G. performed methodology, investigation, software, formal analysis, and writing the original draft. C.G.-M. performed methodology and investigation. E.K. performed methodology, investigation, and software. N.A. performed investigation. O.I. performed investigation. G.F. performed conceptualization, methodology, supervision, and writing the original draft. Z.X. performed investigation, conceptualization, supervision, and writing the original draft. All authors reviewed and edited the manuscript.
Notes
[1] Supplementary material [Supplemental material is available for this article.]
[2] Article published online before print. Article, supplemental material, and publication date are at https://www.genome.org/cgi/doi/10.1101/gr.281132.125.
References
- ↵Abdallah P, Luciano P, Runge KW, Lisby M, Géli V, Gilson E, Teixeira MT. 2009. A two-step model for senescence triggered by a single critically short telomere. Nat Cell Biol 11: 988–993. 10.1038/ncb1911
- ↵Allsopp RC, Vaziri H, Patterson C, Goldstein S, Younglai EV, Futcher AB, Greider CW, Harley CB. 1992. Telomere length predicts replicative capacity of human fibroblasts. Proc Natl Acad Sci 89: 10114–10118. 10.1073/pnas.89.21.10114
- ↵Bertuch AA, Lundblad V. 2003. The Ku heterodimer performs separable activities at double-strand breaks and chromosome termini. Mol Cell Biol 23: 8202–8215. 10.1128/MCB.23.22.8202-8215.2003
- ↵Blackburn EH, Chiou SS. 1981. Non-nucleosomal packaging of a tandemly repeated DNA sequence at termini of extrachromosomal DNA coding for rRNA in Tetrahymena. Proc Natl Acad Sci 78: 2263–2267. 10.1073/pnas.78.4.2263
- ↵Chen H, Xue J, Churikov D, Hass EP, Shi S, Lemon LD, Luciano P, Bertuch AA, Zappulla DC, Géli V, 2018. Structural insights into yeast telomerase recruitment to telomeres. Cell 172: 331–343.e13. 10.1016/j.cell.2017.12.008
- ↵Cristofari G, Lingner J. 2006. Telomere length homeostasis requires that telomerase levels are limiting. EMBO J 25: 565–574. 10.1038/sj.emboj.7600952
- ↵Cubillos FA, Louis EJ, Liti G. 2009. Generation of a large set of genetically tractable haploid and diploid Saccharomyces strains. FEMS Yeast Res 9: 1217–1225. 10.1111/j.1567-1364.2009.00583.x
- ↵D'Angiolo M, Yue JX, De Chiara M, Barre BP, Giraud Panis MJ, Gilson E, Liti G. 2023. Telomeres are shorter in wild Saccharomyces cerevisiae isolates than in domesticated ones. Genetics 223: iyac186. 10.1093/genetics/iyac186
- ↵de Lange T. 2018. Shelterin-mediated telomere protection. Annu Rev Genet 52: 223–247. 10.1146/annurev-genet-032918-021921
- ↵Douglas ME, Diffley JFX. 2021. Budding yeast Rap1, but not telomeric DNA, is inhibitory for multiple stages of DNA replication in vitro. Nucleic Acids Res 49: 5671–5683. 10.1093/nar/gkab416
- ↵Eberhard S, Valuchova S, Ravat J, Fulneček J, Jolivet P, Bujaldon S, Lemaire SD, Wollman FA, Teixeira MT, Riha K, 2019. Molecular characterization of Chlamydomonas reinhardtii telomeres and telomerase mutants. Life Sci Alliance 2: e201900315. 10.26508/lsa.201900315
- ↵Enomoto S, Glowczewski L, Berman J. 2002. MEC3, MEC1, and DDC2 are essential components of a telomere checkpoint pathway required for cell cycle arrest during senescence in Saccharomyces cerevisiae. Mol Biol Cell 13: 2626–2638. 10.1091/mbc.02-02-0012
- ↵Fajkus J, Kovařík A, mKrálovics R, Bezděk M. 1995. Organization of telomeric and subtelomeric chromatin in the higher plant Nicotiana tabacum. Mol Gen Genet 247: 633–638. 10.1007/BF00290355
- ↵Fulcher N, Teubenbacher A, Kerdaffrec E, Farlow A, Nordborg M, Riha K. 2015. Genetic architecture of natural variation of telomere length in Arabidopsis thaliana. Genetics 199: 625–635. 10.1534/genetics.114.172163
- ↵Gallardo F, Laterreur N, Cusanelli E, Ouenzar F, Querido E, Wellinger RJ, Chartrand P. 2011. Live cell imaging of telomerase RNA dynamics reveals cell cycle-dependent clustering of telomerase at elongating telomeres. Mol Cell 44: 819–827. 10.1016/j.molcel.2011.09.020
- ↵Gatbonton T, Imbesi M, Nelson M, Akey JM, Ruderfer DM, Kruglyak L, Simon JA, Bedalov A. 2006. Telomere length as a quantitative trait: genome-wide survey and genetic mapping of telomere length-control genes in yeast. PLoS Genet 2: e35. 10.1371/journal.pgen.0020035
- ↵Gietz RD, Woods RA. 2002. Transformation of yeast by lithium acetate/single-stranded carrier DNA/polyethylene glycol method. Methods Enzymol 350: 87–96. 10.1016/S0076-6879(02)50957-5
- ↵Gomes NM, Ryder OA, Houck ML, Charter SJ, Walker W, Forsyth NR, Austad SN, Venditti C, Pagel M, Shay JW, 2011. Comparative biology of mammalian telomeres: hypotheses on ancestral states and the roles of telomeres in longevity determination. Aging Cell 10: 761–768. 10.1111/j.1474-9726.2011.00718.x
- ↵Gómez-Muñoz C, Fischer G. 2025. MuPETFlow: multiple ploidy estimation tool from flow cytometry data. BMC Genomics 26: 301. 10.1186/s12864-025-11470-8
- ↵Greider CW, Blackburn EH. 1985. Identification of a specific telomere terminal transferase activity in tetrahymena extracts. Cell 43: 405–413. 10.1016/0092-8674(85)90170-9
- ↵Harari Y, Zadok-Laviel S, Kupiec M. 2017. Long telomeres do not affect cellular fitness in yeast. mBio 8: e01314-17. 10.1128/mBio.01314-17
- ↵Houseley J, Tollervey D. 2011. Repeat expansion in the budding yeast ribosomal DNA can occur independently of the canonical homologous recombination machinery. Nucleic Acids Res 39: 8778–8791. 10.1093/nar/gkr589
- ↵Hu C, Zhu XT, He MH, Shao Y, Qin Z, Wu ZJ, Zhou JQ. 2024. Elimination of subtelomeric repeat sequences exerts little effect on telomere essential functions in Saccharomyces cerevisiae. eLife 12: RP91223. 10.7554/eLife.91223
- ↵Ijpma AS, Greider CW. 2003. Short telomeres induce a DNA damage response in Saccharomyces cerevisiae. Mol Biol Cell 14: 987–1001. 10.1091/mbc.02-04-0057
- ↵Ivessa AS, Zhou JQ, Schulz VP, Monson EK, Zakian VA. 2002. Saccharomyces Rrm3p, a 5′ to 3′ DNA helicase that promotes replication fork progression through telomeric and subtelomeric DNA. Genes Dev 16: 1383–1396. 10.1101/gad.982902
- ↵Jain D, Cooper JP. 2010. Telomeric strategies: means to an end. Annu Rev Genet 44: 243–269. 10.1146/annurev-genet-102108-134841
- ↵Karimian K, Groot A, Huso V, Kahidi R, Tan KT, Sholes S, Keener R, McDyer JF, Alder JK, Li H, 2024. Human telomere length is chromosome end-specific and conserved across individuals. Science 384: 533–539. 10.1126/science.ado0431
- ↵Kaur H, Ahuja JS, Lichten M. 2018. Methods for controlled protein depletion to study protein function during meiosis. Methods Enzymol 601: 331–357. 10.1016/bs.mie.2017.11.032
- ↵Kockler ZW, Comeron JM, Malkova A. 2021. A unified alternative telomere-lengthening pathway in yeast survivor cells. Mol Cell 81: 1816–1829.e5. 10.1016/j.molcel.2021.02.004
- ↵Letunic I, Bork P. 2024. Interactive tree of life (iTOL) v6: recent updates to the phylogenetic tree display and annotation tool. Nucleic Acids Res 52: W78–W82. 10.1093/nar/gkae268
- ↵Levy DL, Blackburn EH. 2004. Counting of Rif1p and Rif2p on Saccharomyces cerevisiae telomeres regulates telomere length. Mol Cell Biol 24: 10857–10867. 10.1128/MCB.24.24.10857-10867.2004
- ↵Li H. 2018. Minimap2: pairwise alignment for nucleotide sequences. Bioinformatics 34: 3094–3100. 10.1093/bioinformatics/bty191
- ↵Liti G, Haricharan S, Cubillos FA, Tierney AL, Sharp S, Bertuch AA, Parts L, Bailes E, Louis EJ. 2009. Segregating YKU80 and TLC1 alleles underlying natural variation in telomere properties in wild yeast. PLoS Genet 5: e1000659. 10.1371/journal.pgen.1000659
- ↵Longtine MS, McKenzie AI, Demarini DJ, Shah NG, Wach A, Brachat A, Philippsen P, Pringle JR. 1998. Additional modules for versatile and economical PCR-based gene deletion and modification in Saccharomyces cerevisiae. Yeast 14: 953–961. 10.1002/(SICI)1097-0061(199807)14:10<953::AID-YEA293>3.0.CO;2-U
- ↵Lopes J, Piazza A, Bermejo R, Kriegsman B, Colosio A, Teulade-Fichou MP, Foiani M, Nicolas A. 2011. G-quadruplex-induced instability during leading-strand replication. EMBO J 30: 4033–4046. 10.1038/emboj.2011.316
- ↵Louvel H, Gillet-Markowska A, Liti G, Fischer G. 2014. A set of genetically diverged Saccharomyces cerevisiae strains with markerless deletions of multiple auxotrophic genes. Yeast 31: 91–101. 10.1002/yea.2991
- ↵Lundblad V, Szostak JW. 1989. A mutant with a defect in telomere elongation leads to senescence in yeast. Cell 57: 633–643. 10.1016/0092-8674(89)90132-3
- ↵Marcand S, Gilson E, Shore D. 1997. A protein-counting mechanism for telomere length regulation in yeast. Science 275: 986–990. 10.1126/science.275.5302.986
- ↵Monaghan P, Eisenberg DTA, Harrington L, Nussey D. 2018. Understanding diversity in telomere dynamics. Philos Trans R Soc Lond B Biol Sci 373: 20160435. 10.1098/rstb.2016.0435
- ↵Moyzis RK, Buckingham JM, Cram LS, Dani M, Deaven LL, Jones MD, Meyne J, Ratliff RL, Wu JR. 1988. A highly conserved repetitive DNA sequence, (TTAGGG)n, present at the telomeres of human chromosomes. Proc Natl Acad Sci 85: 6622–6626. 10.1073/pnas.85.18.6622
- ↵Mozdy AD, Cech TR. 2006. Low abundance of telomerase in yeast: implications for telomerase haploinsufficiency. RNA 12: 1721–1737. 10.1261/rna.134706
- ↵O'Donnell S, Yue JX, Saada OA, Agier N, Caradec C, Cokelaer T, De Chiara M, Delmas S, Dutreux F, Fournier T, 2023. Telomere-to-telomere assemblies of 142 strains characterize the genome structural landscape in Saccharomyces cerevisiae. Nat Genet 55: 1390–1399. 10.1038/s41588-023-01459-y
- ↵Paeschke K, Capra JA, Zakian VA. 2011. DNA replication through G-quadruplex motifs is promoted by the Saccharomyces cerevisiae Pif1 DNA helicase. Cell 145: 678–691. 10.1016/j.cell.2011.04.015
- ↵Peter J, De Chiara M, Friedrich A, Yue JX, Pflieger D, Bergström A, Sigwalt A, Barre B, Freel K, Llored A, 2018. Genome evolution across 1,011 Saccharomyces cerevisiae isolates. Nature 556: 339–344. 10.1038/s41586-018-0030-5
- ↵Porter SE, Greenwell PW, Ritchie KB, Petes TD. 1996. The DNA-binding protein Hdf1p (a putative Ku homologue) is required for maintaining normal telomere length in Saccharomyces cerevisiae. Nucleic Acids Res 24: 582–585. 10.1093/nar/24.4.582
- ↵Rat A, Martinez Fernandez V, Doumic M, Teixeira MT, Xu Z. 2025. Mathematical model linking telomeres to senescence in Saccharomyces cerevisiae reveals cell lineage versus population dynamics. Nat Commun 16: 1024. 10.1038/s41467-025-56196-z
- ↵Sanchez SE, Gu Y, Wang Y, Golla A, Martin A, Shomali W, Hockemeyer D, Savage SA, Artandi SE. 2024. Digital telomere measurement by long-read sequencing distinguishes healthy aging from disease. Nat Commun 15: 5148. 10.1038/s41467-024-49007-4
- ↵Schmidt TT, Tyer C, Rughani P, Haggblom C, Jones JR, Dai X, Frazer KA, Gage FH, Juul S, Hickey S, 2024. High resolution long-read telomere sequencing reveals dynamic mechanisms in aging and cancer. Nat Commun 15: 5149. 10.1038/s41467-024-48917-7
- ↵Shakirov EV, Shippen DE. 2004. Length regulation and dynamics of individual telomere tracts in wild-type Arabidopsis. Plant Cell 16: 1959–1967. 10.1105/tpc.104.023093
- ↵Shampay J, Blackburn EH. 1988. Generation of telomere-length heterogeneity in Saccharomyces cerevisiae. Proc Natl Acad Sci 85: 534–538. 10.1073/pnas.85.2.534
- ↵Sholes SL, Karimian K, Gershman A, Kelly TJ, Timp W, Greider CW. 2022. Chromosome-specific telomere lengths and the minimal functional telomere revealed by nanopore sequencing. Genome Res 32: 616–628. 10.1101/gr.275868.121
- ↵Strecker J, Stinus S, Caballero MP, Szilard RK, Chang M, Durocher D. 2017. A sharp Pif1-dependent threshold separates DNA double-strand breaks from critically short telomeres. eLife 6: e23783. 10.7554/eLife.23783
- ↵Teixeira MT. 2013. Saccharomyces cerevisiae as a model to study replicative senescence triggered by telomere shortening. Front Oncol 3: 101. 10.3389/fonc.2013.00101
- ↵Teixeira MT, Arneric M, Sperisen P, Lingner J. 2004. Telomere length homeostasis is achieved via a switch between telomerase-extendible and -nonextendible states. Cell 117: 323–335. 10.1016/S0092-8674(04)00334-4
- ↵Teplitz GM, Pasquier E, Bonnell E, De Laurentiis E, Bartle L, Lucier JF, St-Laurent G, Dawson DS, Wellinger RJ. 2026. A mechanism for telomere-specific telomere length regulation. Nucleic Acids Res 54: gkaf1457. 10.1093/nar/gkaf1457
- ↵Walmsley RM, Petes TD. 1985. Genetic control of chromosome length in yeast. Proc Natl Acad Sci 82: 506–510. 10.1073/pnas.82.2.506
- ↵Wellinger RJ, Zakian VA. 2012. Everything you ever wanted to know about Saccharomyces cerevisiae telomeres: beginning to end. Genetics 191: 1073–1105. 10.1534/genetics.111.137851
- ↵Wicky C, Villeneuve AM, Lauper N, Codourey L, Tobler H, Müller F. 1996. Telomeric repeats (TTAGGC)n are sufficient for chromosome capping function in Caenorhabditis elegans. Proc Natl Acad Sci 93: 8983–8988. 10.1073/pnas.93.17.8983
- ↵Xu Z, Dao Duc K, Holcman D, Teixeira MT. 2013. The length of the shortest telomere as the major determinant of the onset of replicative senescence. Genetics 194: 847–857. 10.1534/genetics.113.152322