
Abstract
Programmed DNA elimination (PDE) is a notable exception to genome integrity. In many nematodes, PDE is initiated by DNA double-strand breaks (DSBs), leading to chromosome fragmentation and subsequent DNA loss. However, the mechanism of nematode programmed DNA breakage remains largely unclear. In the human and pig parasitic nematode Ascaris (Ascaris lumbricoides and Ascaris suum), no conserved motif or sequence structures are present at chromosomal breakage regions (CBRs), suggesting the recognition of CBRs may be sequence independent. Using Hi-C, we reveal that Ascaris CBRs engage in three-dimensional (3D) interactions before and during PDE, indicating that physical contacts between break regions may contribute to PDE. The 3D interactions are established in both Ascaris male and female germlines, demonstrating inherent genome organization associated with the CBRs and to-be-eliminated sequences. In contrast, in the unichromosomal horse parasite Parascaris univalens, transient pairwise interactions between neighboring CBRs that will form the ends of future somatic chromosomes are observed only during PDE. We find that Ascaris PDE, which converts 24 germline chromosomes into 36 somatic ones, induces specific compartmentalization changes. Parascaris PDE generates the same set of 36 somatic chromosomes, and the 3D compartment changes following PDE are consistent between the two species. Overall, we suggest that CBRs are associated with the boundaries of distinct 3D genome domains. These domains partition the retained and eliminated DNA into separate spatial compartments. We also demonstrate that following PDE, the 3D genome reorganization of the somatic chromosomes in these nematodes is evolutionarily and developmentally conserved.
Genome integrity is crucial for faithful inheritance of genetic material. However, during the development of many species, programmed DNA elimination (PDE) removes a substantial portion of the genome, leaving daughter cells with reduced DNA content (Wang and Davis 2014; Dedukh and Krasikova 2021; Zagoskin and Wang 2021; Drotos et al. 2022; Kloc et al. 2022; Mochizuki 2024). Although PDE is not present in most traditional model organisms with the exception of ciliates, it is being identified in a growing number of species from diverse phyla (Grishanin 2014; Streit et al. 2016; Rzeszutek et al. 2020; Smith et al. 2021; Borodin et al. 2022; Chen et al. 2022; Estrem and Wang 2023; Herbette and Ross 2023). Although PDE is gaining increasing recognition as a significant biological process (Bendich and Rogers 2025; Hanlon et al. 2025), much remains unknown about its molecular mechanisms, particularly in metazoan species that exhibit PDE.
DNA double-strand breaks (DSBs) fragment chromosomes during PDE in ciliates, many nematodes, and some copepods (Wang and Davis 2014; Zagoskin and Wang 2021; Mochizuki 2024). In these species, specific genomic locations are recognized, DSBs are generated, DNA break ends are healed by telomere addition or end joining, and specific regions of the genome are retained or eliminated. Although the molecular machineries for PDE appear divergent between the ciliates and nematode systems, both sequence-dependent and sequence-independent mechanisms are used for break site recognition (Betermier et al. 2023; Estrem and Wang 2023; Mochizuki 2024; Srinivasan et al. 2026). DSBs in the middle of the germline chromosomes, if healed with telomere addition, can lead to the partitioning of the chromosomes and drastic changes in the resulting somatic karyotypes (Simmons et al. 2024). However, the consequences of these karyotype changes on genome organization and gene expression are largely unexplored.
The parasitic nematodes infecting humans (Ascaris lumbricoides) and pigs (Ascaris suum) undergo PDE (Wang and Davis 2020; Estrem and Wang 2023). The two species have little difference in genome sequences (Easton et al. 2020) and PDE. For simplicity, we use Ascaris to refer to both species. In Ascaris, we identified 72 chromosomal breakage regions (CBRs) at the boundaries of retained and eliminated DNA, with 48 terminal CBRs located near the chromosome ends and 24 internal CBRs in the middle of the chromosomes (Wang et al. 2020). Each CBR is in a 3–6 kb window in which DSBs occur and new somatic telomere sequences are added to repair the broken ends (Wang et al. 2017, 2020). Sequence analysis revealed no conserved motifs or sequence structures at these CBRs, suggesting a sequence-independent mechanism for their recognition (Estrem and Wang 2023). Moreover, common histone marks and small RNAs are not associated with the CBRs (Zagoskin et al. 2025). However, the chromatin at the CBRs becomes more accessible during PDE, indicating a specific mechanism may be involved (Wang et al. 2017, 2020). Similarly, the horse parasite Parascaris univalens also undergoes PDE, but its germline karyotype is a single, large chromosome (∼2.5 Gb), of which ∼2.2 Gb of repetitive heterochromatin is confined to the arms and eliminated during PDE (Simmons et al. 2024). In contrast to Ascaris, the 72 CBRs in Parascaris are all internal, ∼1 Gb away from either chromosome end (Simmons et al. 2024).
The lack of sequence features associated with Ascaris and Parascaris CBRs prompted the search for sequence-independent mechanisms that might be involved in PDE. The eukaryotic genome is organized at a three-dimensional (3D) level into folded structures at multiple length scales, involving both intrachromosomal and interchromosomal interactions (McCord et al. 2020; Dekker and Mirny 2024). Changes in 3D genome organization have been implicated in numerous developmental processes, such as V(D)J and class switch recombination in lymphocytes (Zhang et al. 2012; Hu et al. 2015), zygotic genome activation during embryogenesis (Gassler et al. 2017; Kaaij et al. 2018), X-Chromosome inactivation in mammals (Minajigi et al. 2015; Giorgetti et al. 2016), dosage compensation in Caenorhabditis elegans (Crane et al. 2015), antigenic variation and transcription in trypanosomes (Müller et al. 2018; Rabuffo et al. 2024), and neural development (Bonev et al. 2017; Rajarajan et al. 2018). We hypothesize that the 3D genome architecture may contribute to PDE by spatially organizing (1) the CBRs before and during PDE and (2) the resulting somatic chromosomes after PDE. Notably, in Ascaris, introducing random DSBs by treating with X-rays at PDE embryo stages did not lead to their repair through telomere addition (Estrem et al. 2024). One possibility is that recruitment of telomere addition machinery to Ascaris PDE break sites requires the nuclease responsible for generating the DSBs. This further suggests that these DSBs and the telomere healing process are specific and may be confined within nuclear foci where the machineries for PDE could localize.
Recent advancements in chromosome conformation capture (Hi-C) have unveiled major principles of 3D genome organization, encompassing chromosome territories, compartments, topologically associating domains, and point interactions and acting through mechanisms such as phase separation and loop extrusion (Goloborodko et al. 2016; Strom et al. 2017; Zheng and Xie 2019; McCord et al. 2020; Feric and Misteli 2021; Dekker and Mirny 2024; Li et al. 2024). Here, we used Hi-C across embryonic stages before, during, and after PDE in Ascaris and Parascaris to determine whether CBRs engage in 3D interactions, how the 3D genome reorganizes following elimination, and whether these features are conserved between the two species.
Results
CBRs interact with each other during Ascaris DNA elimination
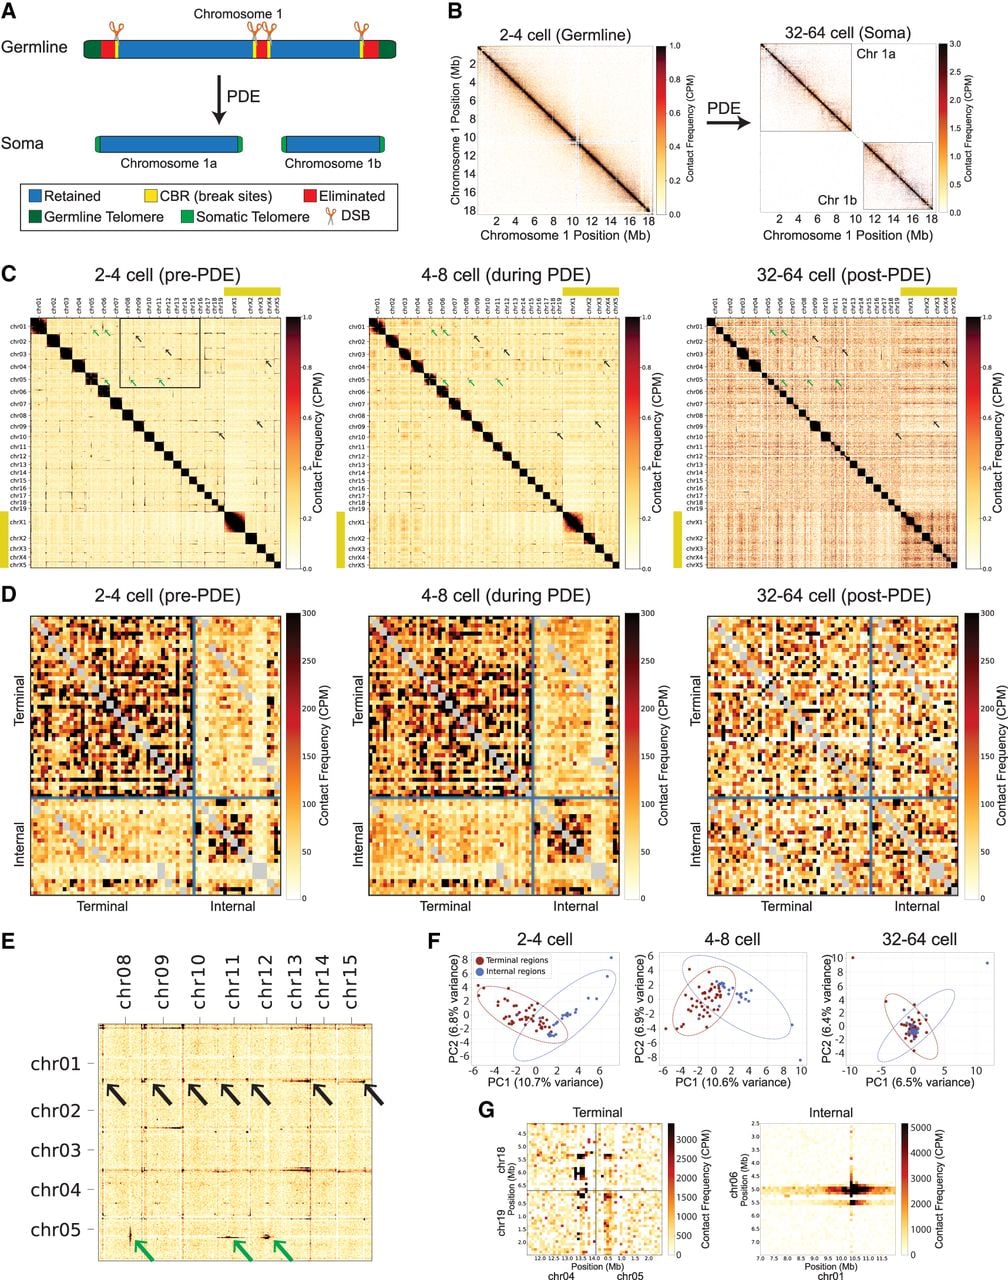
Ascaris early embryogenesis is slow (∼15 h per cell cycle) and synchronous, allowing collection of large quantities of embryos from discrete developmental stages (Wang and Davis 2020). This provides a unique opportunity to study the PDE process (Fig. 1A), which occurs during the four-cell to 16-cell embryonic stages (Estrem and Wang 2023). The high degree of synchrony (Azzaria and McGhee 1992) ensures that embryos collected at each time point are predominantly (>85%) at the indicated stage (Wang et al. 2014; Wang and Davis 2020). We performed Hi-C on Ascaris embryos at stages before (two to four cells; 48 h), during (four to eight cells; 60 h), and after (32–64 cells; 5 days) PDE. The Hi-C data were mapped to an improved germline genome assembly that corrects previous misassemblies (see Supplemental Fig. S1). The Hi-C heatmaps confirm the splitting of a single germline chromosome into multiple somatic chromosomes (Fig. 1B). Across the genome, the Hi-C maps revealed a pattern of interactions prior to and during PDE among chromosome ends where the 48 CBRs reside (Fig. 1C,E, black arrows). These interactions are not mapping artifacts caused by repetitive sequences, because mapping the Hi-C data to a repeat-masked genome still produced the same pattern of interactions (Supplemental Fig. S2). The interactions are significantly higher than expected based on their genomic distance (Supplemental Fig. S3). Interactions also occur among the 24 internal CBRs (Fig. 1C,E, green arrows). The terminal and internal CBRs form two spatially separated groups (Fig. 1D,F). The two groups showed distinct interaction patterns, with terminal CBRs forming either discrete point or streak interactions, whereas internal CBR interactions appeared as long streaks (Fig. 1G). Notably, these interactions, largely associated with the retained DNA (see Fig. 3, below), disappear after PDE, consistent with the timing of DNA elimination (Fig. 1). Because the CBR is a unique feature associated with PDE, our data established a strong link between CBR 3D interactions and PDE.
CBRs interact with each other during Ascaris PDE. (A) PDE breaks one germline chromosome into two somatic chromosomes. Chr 1, one of the 11 Ascaris germline chromosomes that has DNA eliminated in the middle of the chromosome, is illustrated. (B) Hi-C maps of Chr 1 before (two to four cells) and after (32–64 cells) PDE show the formation of the two somatic chromosomes following PDE. Intrachromosomal (cis) interactions of Chr 1 at 10 kb resolution are shown; contact matrices were iteratively corrected (ICE method) and normalized to counts per million (CPM) within the displayed region. (C) Hi-C heatmaps on Ascaris embryos from developmental stages before (two to four cells, 48 h), during (four to eight cells, 60 h), and after (32–64 cells, 5 days) PDE are shown at 250 kb resolution, normalized to CPM genome-wide. In contrast to the single-chromosome maps in B, these genome-wide maps include trans contacts. Thus, the color scale is set below the strong cis signal to show the weaker trans interactions between chromosome ends. Before and during PDE, Hi-C interactions are observed between the ends of chromosomes where CBRs reside. Notably, these interactions are not observed after PDE at the 32-cell to 64-cell stage. Black arrows indicate examples of interactions at the ends of the chromosomes, and green arrows denote examples of interactions at the middle of the chromosomes. (D) Hi-C heatmaps of 400 kb flanking each CBR reveal strong interactions among terminal (upper left blocks) and internal CBRs (lower right blocks) before and during the PDE. Note that these two clusters of CBR interactions are not visible in the post-PDE stage (32-cell to 64-cell embryos). (E) Zoomed-in portion of the Hi-C heatmap delineated in C (two to four cells, pre-PDE) showing interactions among CBRs from a selection of autosomes (boxed in C, left panel). (F) Principal components analysis of CBR interactions reveals two distinct clusters before and during PDE and one cluster after PDE. (G) Examples of terminal and internal CBR interactions binned at 100 kb resolution.
CBR interactions are established during germline development
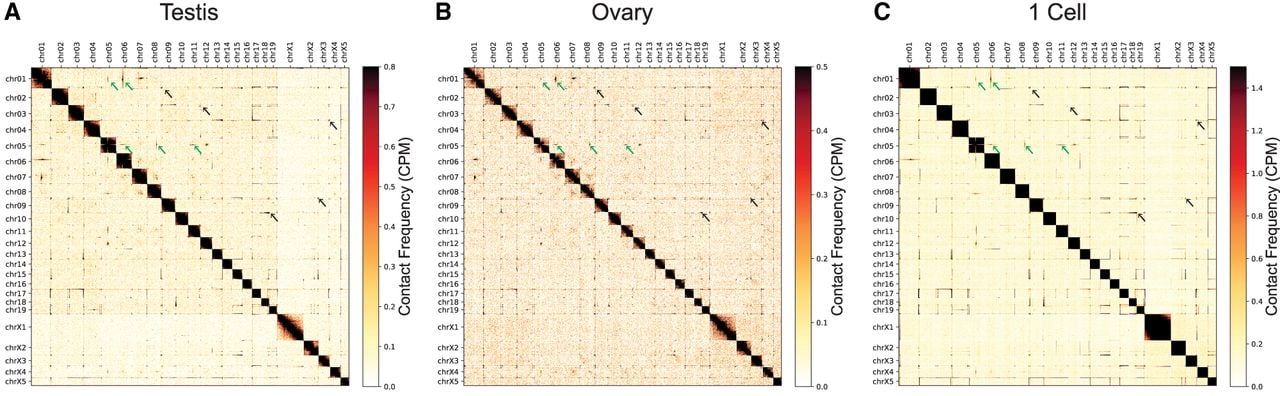
We next asked when the CBR interactions are formed during development. We performed Hi-C on male and female germline tissues and on one-cell zygotes (0 h), stages not associated with PDE. We found that interactions among CBRs were already present in these germline tissues (Fig. 2). Thus, these long-range CBR interactions are established well before PDE and may be an intrinsic feature associated with the CBRs and germline chromosomes. The patterns of 3D interactions at the ends of chromosomes exhibited variations among these stages (Fig. 2). In the testis and one-cell zygote, the ends of certain chromosomes are observed to interact with the entire length of many other chromosomes, resulting in stripes in the Hi-C maps (Fig. 2A,C). In contrast, in the ovary, most interactions are more confined to the ends of the chromosomes, as indicated by the dots in the Hi-C maps (Fig. 2B). Even though there is a small fraction (5%–10%) of somatic cells in the testis and ovary samples (Wang et al. 2012), we reason the stripe and dot patterns observed are unlikely owing to somatic contamination, because they are also present in the one-cell zygote, which is free of somatic cells. Overall, although our data demonstrate a consistency in the CBR interactions throughout germline development, they also reveal stage-specific variations.
CBR interactions are established during Ascaris germline development. Interactions between chromosome ends in Ascaris were present in the testis (A), ovary (B), and one-cell zygote (C). Values were normalized using counts per million (CPM). Note the differences in the interactions as shown in dots (ovary) versus stripes (testis and one-cell zygote). Black and green arrows point to examples of the end-to-end and internal-to-internal interactions, respectively.
CBRs reside at the boundaries of the spatially organized chromosome ends
To identify the precise spatial boundaries of the CBR interactions among chromosomes, we determined trans-interaction (interchromosomal) frequencies surrounding the CBRs. We chose to examine interchromosomal interactions of all assembled terminal CBRs using 100 kb in the eliminated regions and 500 kb in the retained regions (total 45 out of 48 terminal CBRs) (Fig. 3A). This analysis revealed a significant enrichment of trans interactions within ∼200 kb of retained DNA adjacent to the terminal CBRs (Fig. 3A). CBRs coincide with the boundaries of the high and low interchromosomal interaction regions (Fig. 3A, vertical line), suggesting these strong interactions may spatially demarcate the retained and eliminated sides of the DNA. This spatial separation is not detected for internal CBRs (Supplemental Fig. S4), indicating that the stronger interchromosomal interactions for terminal CBRs are associated with their proximity to the chromosome ends. Notably, a steep drop in trans interactions is observed at ∼300 kb of the retained region (Fig. 3A), indicating the possible boundary of the spatially organized domain.
Interactions of CBR-adjacent regions are associated with PDE. (A) CBR-adjacent regions have high interchromosomal interactions. The CBRs are highlighted in green with a vertical dashed line and designated as zero. The 500 kb retained side is to the left (in negative values), and the 100 kb eliminated side is to the right; trans-interaction frequencies surrounding 45 terminal CBRs are shown. Metaprofiles for all analyzed CBRs are displayed as mean (solid lines) ± 1 SEM (shaded areas). (B) All chromosomes contribute to the CBR interactions observed in A. The aggregated CBR trans-interaction for the testis was broken down by contributions from each chromosome (ordered and color-coded). (C) CBR regions are highly insulated in the germline and early embryos through PDE. The insulation score is shown for each developmental stage for Chr 2. Less insulated regions (positive values) are shown in blue; more insulated regions (negative values) are shown in red. Eliminated regions are highlighted in red. (D) The end eliminated regions are highly insulated. The whole genome is broken down by retained (blue), end-eliminated (red), and internal-eliminated (orange) regions. Insulation score values using a 100 kb window size are plotted for each developmental stage in a sliding window size of 5 kb. Post-PDE stages on the right are highlighted in red (note the lack of eliminated DNA data in post-PDE). Data points below −5 are shown as hollow circles. Statistical significance was calculated using a two-sided Mann–Whitney U-test: (***) P < 0.001, (**) P < 0.01. (E) Interaction of CBRs at PDE foci in the nucleus. A 3D genome interaction model based on Hi-C maps. Shown are the dynamic changes of the CBRs (red circles) in five chromosomes (five colored threads in their chromosome territories). PDE foci are shown in big yellow circles. Germline (old; green) and somatic (new; blue) telomeres are illustrated. Depicted are two CBRs interacting within a PDE focus (left, top), in which a programmed DSB occurred. After DSB formation, new telomeres are added to the retained DNA, which then dissociates from the PDE foci (right, top). A newly formed CBR interaction is also shown (right, bottom). Meanwhile, internal CBRs interact among themselves apart from terminal CBRs, leading to drastic karyotype changes after elimination.
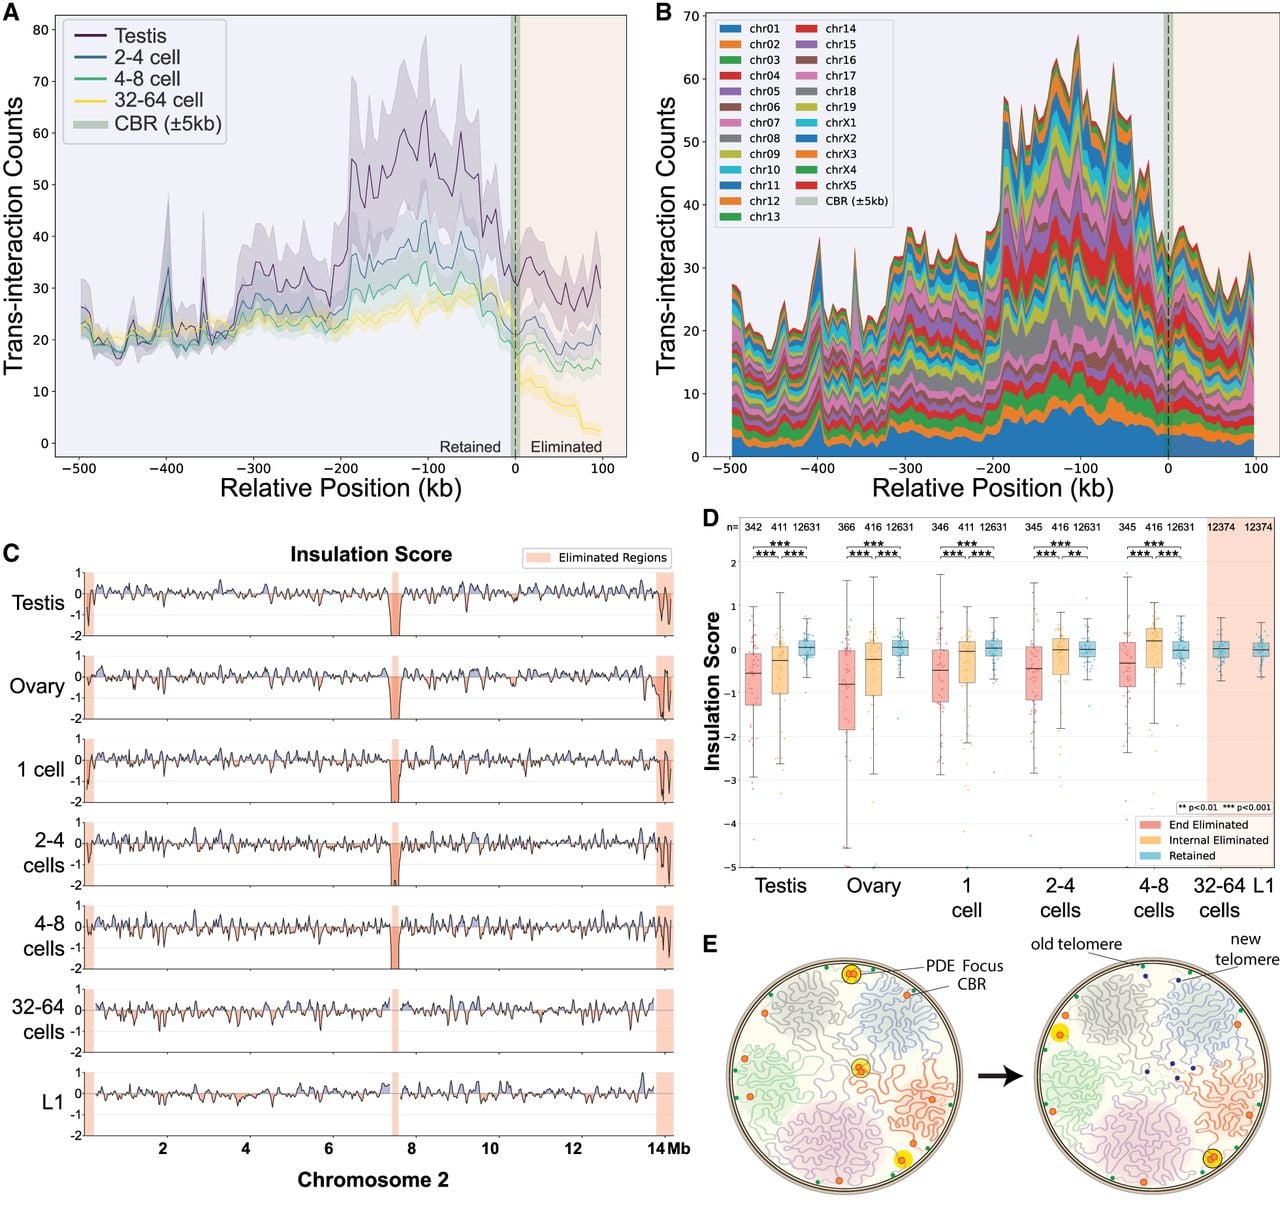
To further distinguish whether the elevated interchromosomal interactions in the CBR-flanking regions were driven by a few selected chromosomes or across all chromosomes, we analyzed the contribution of individual chromosomes. Each chromosome contributed considerably to the aggregated interactions (Fig. 3B), suggesting a shared mechanism of 3D genome organization among these chromosomes. These interactions for CBR-adjacent retained regions are dynamic during embryo development, with the highest interactions observed in the early embryos; they gradually decrease throughout embryonic development and become minimal after PDE at 32-cell to 64-cell embryos (Fig. 3A). Collectively, these results indicate that the chromatin architecture associated with CBRs employs long-range trans interactions prior to PDE. These interactions may play a key role in defining the boundaries of 3D genome domains that coincide with the CBRs, thus spatially separating the retained and eliminated DNA.
Short-range interactions and 3D insulation associated with PDE
To explore whether short-range 3D interactions might also influence PDE, we calculated insulation scores across the genome. Insulation scores quantify the degree to which a given region interacts with its local genomic neighborhood. For Hi-C insulation scores, lower numbers indicate stronger insulation, and higher numbers denote weaker insulation. Thus, dips in insulation score are interpreted as stronger local boundaries, across which fewer interactions occur (Crane et al. 2015; Lajoie et al. 2015). We identified many genomic regions with dynamic insulation patterns during development (Fig. 3C,D). Notably, out of the 44 completely assembled eliminated regions >100 kb that allow robust insulation analysis, 35 (80%) consistently exhibited boundary-like dips in insulation score at or near their respective CBRs before PDE, suggesting strong local boundaries at the CBRs. Six other CBRs (Chr 5a, Chr 9, Chr 10, Chr 12b, Chr 19, Chr X2b; 14%) demonstrated similar drops in insulation score in adjacent retained regions (Supplemental Fig. S5), and only one eliminated region (Chr X5) did not show any sign of boundary-like insulation.
After PDE, the retained regions adjacent to CBRs become less insulated as indicated by the increasingly positive insulation scores, extending beyond 1 Mb (Fig. 3C,D). The new chromosome ends also exhibit decreased gene expression, despite showing higher chromatin accessibility measured by ATAC-seq (Wang et al. 2017). Consistently, the heterochromatic histone mark H3K9me3 accumulates at the new chromosome ends after PDE (Supplemental Fig. S6). We observed a general decrease in insulation across eliminated regions up to their elimination (Fig. 3D). This coincided with the incorporation of the eliminated DNA fragments into micronuclei (Wang et al. 2020), which separate these fragments from the rest of the genome and thus may increase their local interactions.
Overall, the chromosomal-level 3D and short-range interactions of CBRs may play a role in the PDE process by bringing them to nuclear foci that may have accumulated molecular machinery essential for DSBs and telomere addition (PDE foci; see Discussion) (see Fig. 3E). Alternatively, the interactions of the CBRs themselves may act as a platform to recruit CBR- and/or PDE-associated proteins to the break sites.
3D chromosomal changes following programmed DSBs for PDE
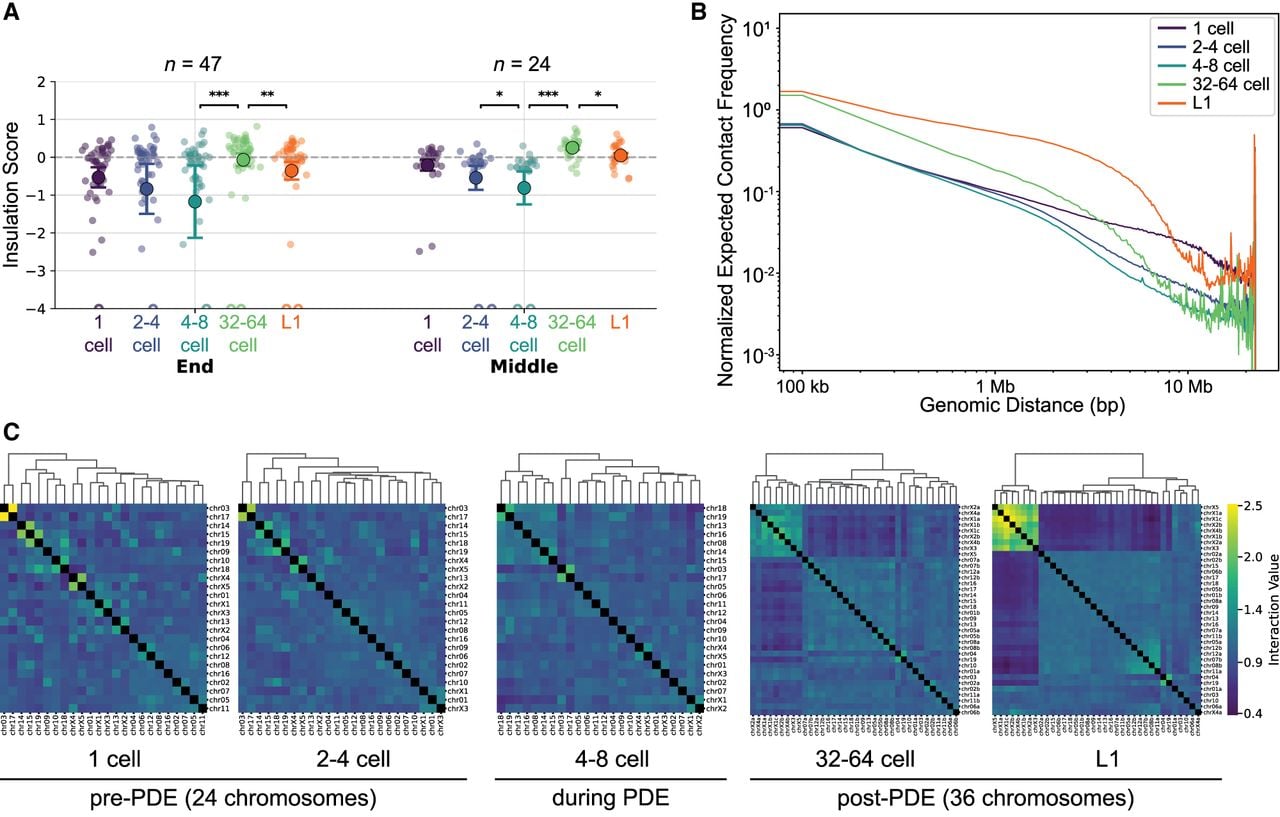
The generation of DSBs and new chromosome ends through PDE also leads to 3D genome changes. To study the local insulation in response to the DSBs, we performed Hi-C analysis on several staged embryos post-PDE (Fig. 4) and determined the insulation scores specifically for CBRs. Because the eliminated DNA is no longer available in the genomes of post-PDE stages, we only examined the retained region within 100 kb sequences around CBRs. These regions became more insulated from the one-cell zygote to PDE stage (four to eight cells) but became less insulated after PDE (32–64 cells) (Fig. 4A). This suggests that DSBs may liberate the spatial constraints adjacent to the CBRs during PDE, thus changing their local genomic contacts. Overall, this analysis revealed a consistent pattern of local 3D genome in response to DSBs post-PDE.
3D chromosomal changes during embryogenesis and in response to programmed DSBs. (A) Dynamic changes of insulation for retained ends of chromosomes. Insulation scores for 100 kb regions of retained DNA proximal to the end (47 sites; left) and middle (24 sites; right) of the chromosomes were determined. Shown are mean values with bars representing 1 SE. Each dot represents the end of a somatic chromosome (or future somatic chromosome in pre-PDE stages). Statistical significance was calculated using a two-sided Mann–Whitney U-test: (***) P < 0.001, (**) P < 0.01, and (*) P < 0.05. Data points lower than −4 are shown as empty circles at the lower boundary. (B) Changes in middle and long-range Hi-C interaction. Distance-decay curves for whole-genome Hi-C interaction data at different developmental stages. The normalized expected contact frequency (y-axis) is plotted against genomic distance (x-axis) on a log–log scale. (C) Changes in the 3D interaction among chromosomes. Chromosomal cluster analysis was performed at each developmental stage. Pre-PDE genomes are shown with 24 chromosomes, whereas post-PDE genomes are shown with 36 chromosomes. Strong clusters emerge after PDE as observed in the group of sex chromosomes (top left corners) in the 32-cell to 64-cell embryos and L1 larvae.
Long-range interaction changes and chromosome clustering through PDE
To assess the impact of PDE on intrachromosomal contacts, we analyzed distance decay curves across different stages (Fig. 4B). In the one-cell zygote, the interaction frequency exhibits a power-law decay diminishing around 23 Mb, which aligns with the largest germline chromosome size (Chr X1 = 23.1 Mb). Short-range interactions (<100 kb) increase after PDE, coinciding with the observed increase in local structures (Fig. 1C, 32–64 cell). This suggests the establishment of short-range regulatory interactions throughout the genome following PDE. Conversely, long-range interactions (>1 Mb) decrease after PDE, consistent with the overall reduced chromosome sizes (average size: germline = 12.8 Mb and soma = 7 Mb).
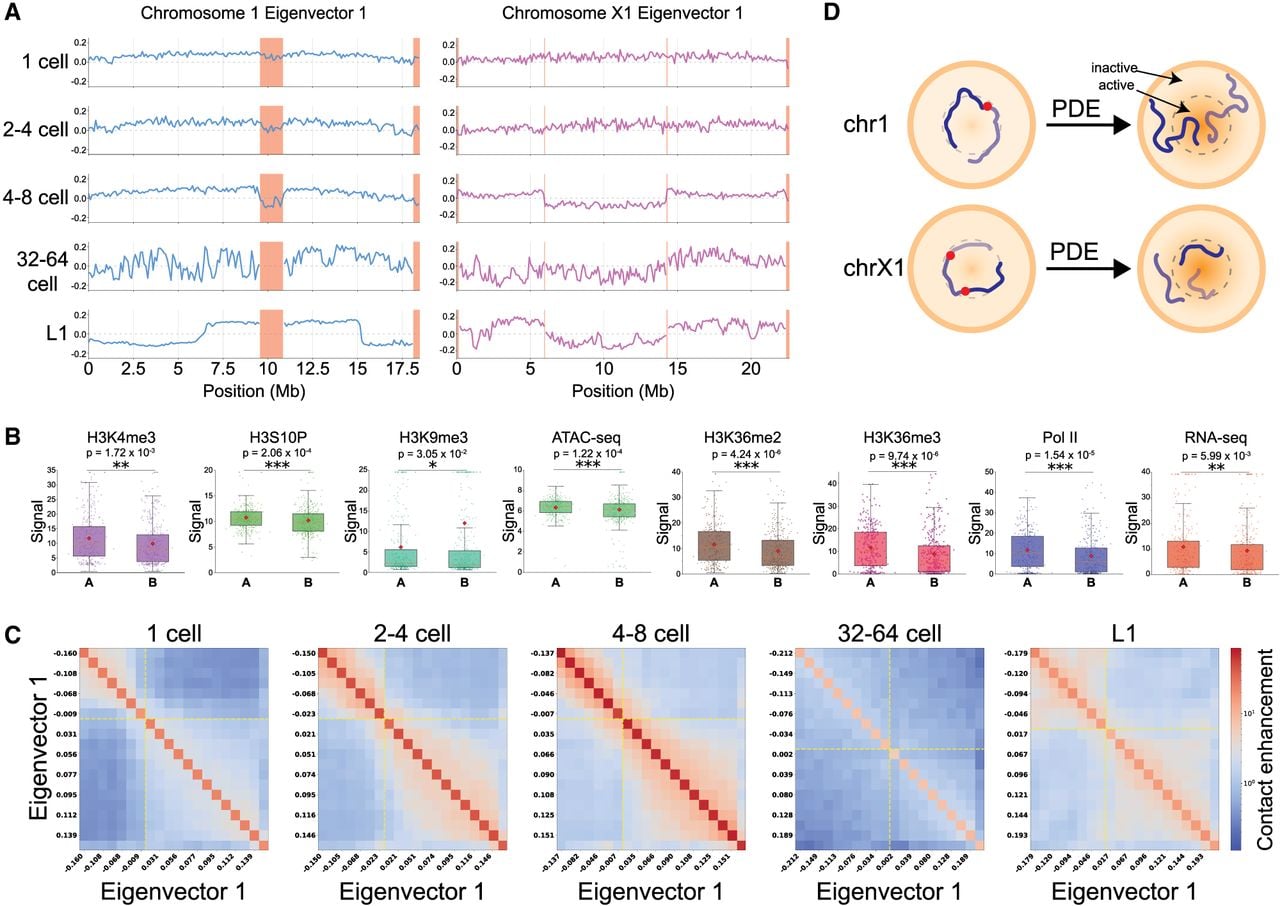
To determine how the genome spatially reorganizes at chromosomal level following PDE, we clustered chromosomes at each developmental stage based on Hi-C contact frequencies. In the one-cell zygote and two- to four-cell embryos, interactions among pre-PDE chromosomes are uniform (Fig. 4C). After PDE, the somatic chromosomes exhibit differential spatial organization. A key feature after PDE is the clustering of sex chromosomes: At 32–64 cells, the nine sex chromosomes form a distinct group separated from the 27 autosomes. This segregation of the sex chromosomes becomes more pronounced in larvae L1 (except for Chr X4a). In contrast, for autosomes, they are organized into several large, distinct clusters, indicating progressive establishment of preferential interactions between chromosome territories (Fig. 4C). These data suggest coordinated compartmentalization changes (see also Fig. 5) may contribute to the formation of the somatic chromosome territories after PDE.
PDE splits chromosomes and causes 3D genome changes. (A) Compartmentalization changes during Ascaris embryogenesis. Hi-C compartments were determined by using the eigenvector 1 values through the developmental stage. Eliminated regions are highlighted in light red (for compartments for all chromosomes, see Supplemental Fig. S7). For Chr 1, weak compartmentalization between its two future somatic derivatives is shown before PDE. Following PDE, the 3′ end of Chr 1a and the 5′ end of Chr 1b occupy the same active compartment, and the 5′ end of Chr 1a and the 3′ end of Chr 1b remain in the inactive compartment (see also D). For Chr X1, after PDE split it into three somatic chromosomes, the two terminal fragments occupy the same compartment, and the central fragment is segregated away (see also D). (B) Multiomic analysis confirms the defined compartments. Active chromatin marks are enriched in A compartments, and a heterochromatin mark is enriched in B compartments. Each point represents a 100 kb genomic region. A two-sided Mann–Whitney U-test was performed to calculate the statistical significance for each comparison: (***) P < 0.001, (**) P < 0.01, and (*) P < 0.05. (C) Dynamics of compartment interactions through development. A/B-compartment interactions are shown using saddle plots. Genomic bins are sorted by PC1 value and binned into 20 quantiles (both axes). Contact enrichment within each bin pair is displayed (red = high; blue = low). Dashed yellow lines mark the A/B boundary (PC1 = 0). (D) Model of chromosomal rearrangements following PDE. The germline chromosomes are not strongly compartmentalized in the early embryos. After PDE, the resulting somatic chromosomes reorganize their compartments. The two chromosomes were modeled based on data from A.
Karyotype changes during PDE are associated with compartmental and somatic 3D genome reorganization
Ascaris PDE leads to extensive karyotype changes and the splitting of 11 of the 24 germline chromosomes into 23 of the 36 somatic chromosomes (Wang et al. 2020). In C. elegans, Hi-C compartments exhibit a general profile for autosomes, in which the active (A) compartments are in the middle of the chromosomes and inactive (B) compartments are in the arms of the chromosomes, forming a linear B–A–B profile along its arm–center–arm (Sawh and Mango 2022). This B–A–B profile is consistent with expression data that more conserved and active genes are located in the middle of the chromosomes (Gerstein et al. 2010).
To investigate whether and how large-scale chromosomal contact domains change after Ascaris PDE, we first determined the A/B-compartmentalization pattern using the first eigenvector (PC1) of the Hi-C data (Fig. 5A; Supplemental Fig. S7). We validated these compartments as transcriptionally active and inactive, respectively, using independent and comprehensive multiomic data sets from previous studies (Fig. 5B; Wang et al. 2014, 2017, 2020; Kang et al. 2016). Analysis of strongly compartmentalized regions (defined as EV1 > 0.15 or <−0.15) revealed that active chromatin marks, including H3K4me3, H3S10P, H3K36me2, and H3K36me3, are significantly enriched in A compartments. Conversely, H3K9me3, a marker of repressive chromatin, is significantly enriched in B compartments (Fig. 5B). Furthermore, RNA-seq, RNA polymerase II, and ATAC-seq analyses also show significantly higher signal in A compartments, corroborating the compartment data (Fig. 5B).
Ascaris 3D genome compartmentalization is weak during early development, up to the embryonic stages of PDE (four to eight cells), after which compartments are strengthened (Fig. 5A; Supplemental Fig. S8A). This strengthening of compartments overall reflects both large-scale changes in karyotype, owing to the increased number of chromosomes following PDE, and smaller-scale chromatin reorganization typical of early embryogenesis in nematodes (Sawh et al. 2020; Jash and Csankovszki 2024). We observed notable compartmentalization changes surrounding the CBRs before and after PDE. Prior to PDE, the eliminated regions exhibit opposite compartments relative to retained regions. After PDE, somatic chromosomes adopted distinct patterns of A/B compartmentalization (Fig. 5A,D). Genome-wide analysis revealed that in the 32-cell to 64-cell embryos, a stage immediately following PDE, the Hi-C compartments exhibit the most variable structure (Fig. 5A). This coincides with a significant drop in saddle strength that measures the degree of separation between active and inactive compartments (Fig. 5C; Supplemental Fig. S8B). Our data suggest that the 32-cell to 64-cell stage is likely a transition phase for compartmentalization, in which future somatic compartments are not fully established. This transition is further demonstrated by the compartment identity switching (A to B and B to A): It is stable before PDE (one cell) (Supplemental Fig. S8C) but shows a significant increase in A-to-B switching at 32-cell to 64-cell embryos and more B-to-A switching between the 32-cell to 64-cell and L1 stages. Notably, compartmentalization changes for the somatic chromosomes are stabilized at the L1 stage, at which the somatic program is firmly established (Fig. 5A,D). Overall, our findings indicate that the karyotype changes accompanying Ascaris PDE are associated with distinct reorganization of the 3D genome in somatic cells.
CBRs in Parascaris form transient and pairwise interactions during PDE
The related horse parasite Parascaris undergoes PDE during the two-cell to 32-cell embryonic stages (Estrem and Wang 2023; Simmons et al. 2024). To determine if the CBRs in Parascaris also form 3D genome interactions, we performed Hi-C in embryos before (one cell; 10 h), during (two to four cells; 17 h), and after PDE (four to eight cells; 24 h). The synchrony of the Parascaris early development is less consistent compared with Ascaris, but at each time point, >70% of the embryos are at the indicated stage. Because the ∼2.2 Gb of terminal heterochromatin arms are exclusively satellite repeats and are not present in the genome assembly, the Hi-C map spans only the euchromatic core. Nevertheless, all 72 CBRs are included in the one assembled chromosome. In one-cell embryos before PDE, the whole chromosome is largely unstructured at the 3D genome level (Fig. 6A; Supplemental Fig. S9). However, in the two- to four-cell stage, at which PDE begins, we observed a striking pattern of CBR interactions: Neighboring pairs of CBRs that will form the ends of future somatic chromosomes interact with each other (Fig. 6A,B). We refer to the two CBRs flanking a single retained segment, those that will form the two ends of the same somatic chromosome, as a cognate CBR pair; CBRs belonging to different prospective somatic chromosomes are referred to as noncognate. When the Hi-C contact frequencies were normalized by the expected pattern of distance decay, 36 sites of higher-than-expected interactions became apparent (Fig. 6B–D). The sites of interactions match the ends of the 36 future somatic chromosomes (36 cognate CBR pairs).
Transient cis interactions between cognate CBRs during Parascaris PDE. (A) Hi-C contact map of the Parascaris embryos before, during, and after PDE. The germline karyotype for female is XX and male is XY, in which the Y Chromosome lacks the sex chromosome region (yellow box). The apparent interaction between the two boundaries of the sex chromosome region arises because the sequences at the two boundaries are juxtaposed in the Y Chromosome of the males. Thus, in a population of embryos with mixed sexes, ∼25% of the chromosomes lack this region (Simmons et al. 2024). The map covers the ∼240 Mb assembled genome and the ∼2.2 Gb of repetitive heterochromatic arms that are eliminated (data not shown). The shown eliminated regions and all CBRs are internal and are ∼1 Gb away from the chromosome ends, so their interactions are unlikely affected by germline telomere interactions. (B) Pairwise CBR interactions during Parascaris PDE. Observed/expected contact ratio map for the same stages as in A. Strong focal interactions are visible between cognate CBR pairs. (C) Zoomed-in portion of the Hi-C heatmap delineated in B (two to four cells, during-PDE) showing interactions among CBRs from a selection of autosomes. Black arrows indicate interactions between cognate CBRs; green arrows indicate interactions between noncognate CBRs. (D) Exemplary dynamic CBR interactions throughout PDE. Interaction frequencies across Chr X 89–101 Mb are shown before, during, and after PDE. Black arrows mark the cognate CBR interactions. (E) Parascaris CBRs spatially demarcate the retained and eliminated DNA. The normalized contact frequency between cognate CBRs. Hi-C interactions for 500 kb of retained DNA (left) and 100 kb of eliminated DNA (right) flanking all 72 CBRs (vertical dashed line) were plotted. The interaction peaks immediately at the break during PDE and is absent before and after. Note the interaction frequency falls to zero post PDE (four to eight cells) owing to the loss of the eliminated DNA. (F) A model for CBR interactions during Parascaris PDE. Germline Hi-C interactions among future somatic chromosomes are shown with red–orange–yellow–white scale triangles, and interactions among eliminated regions are outlined with dashed lines (not to scale). Green spots represent interactions between cognate CBR pairs near the ends of each future somatic chromosome. Note the resemblance of the pre-PDE chromosome structure to the “beads-on-a-string” model (Niedermaier and Moritz 2000).
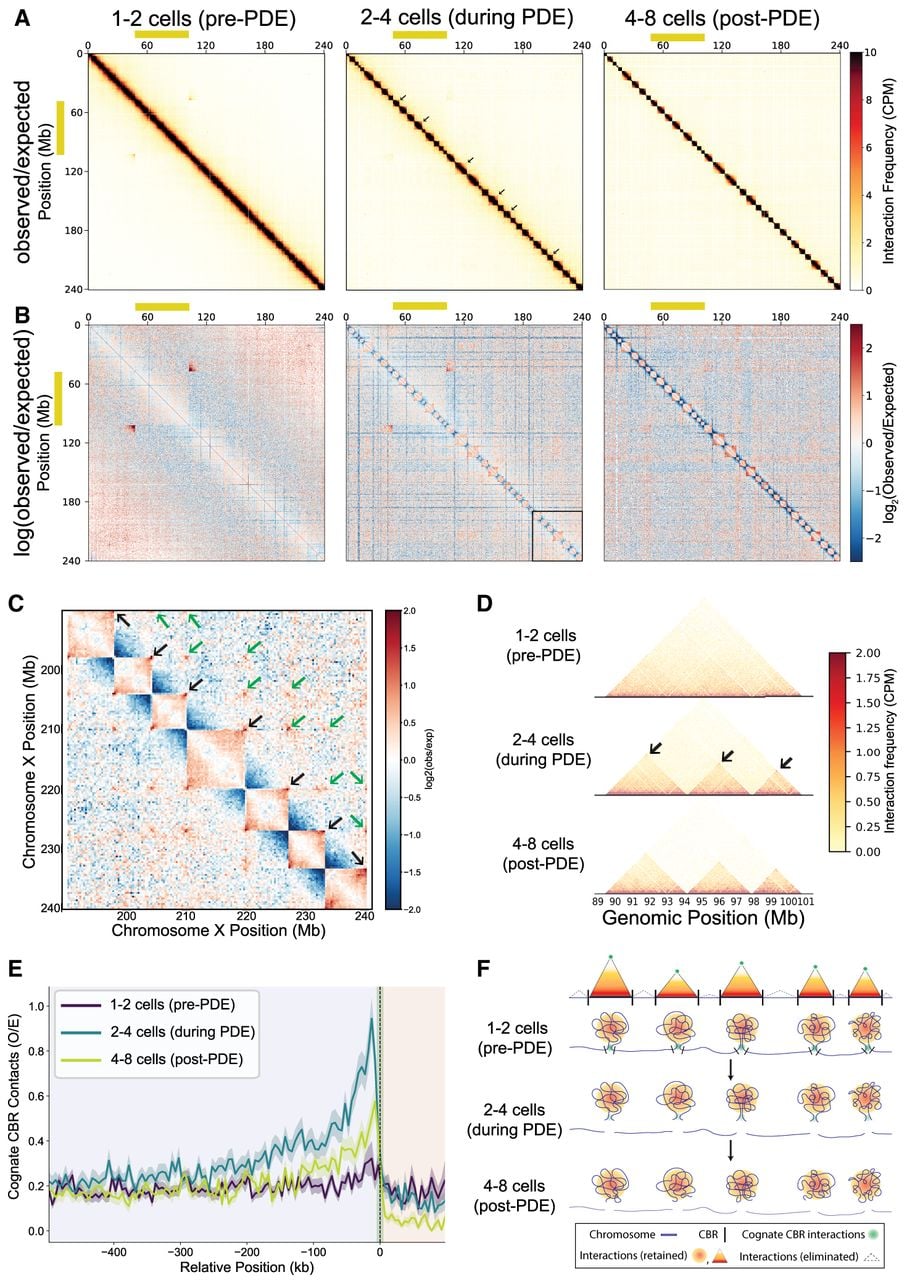
Like Ascaris, these Parascaris CBR interactions are formed within retained sequence and peak at the boundaries of the retained and eliminated DNA (Fig. 6E). The interaction is highly specific to cognate CBRs rather than a general increase in contact near CBRs (Supplemental Fig. S10A). Quantified per chromosome, cognate CBR interactions rose from a median observed/expected (O/E) ratio of 0.20 before PDE to 0.55 O/E during PDE, an increase seen in all 33 chromosomes tested (P = 2.3 × 10⁻¹⁰). The median interactions O/E fell to 0.35 after PDE (P = 2.1 × 10⁻⁷) (Supplemental Fig. S10B,C). Interaction strength was not related to somatic chromosome length or the size of the adjacent eliminated block, nor did it differ in the autosome versus sex chromosome regions of the germline chromosome (Supplemental Fig. S10D). Stronger interactions are observed in cognate CBR pairs regardless of their separation along the germline chromosome, whereas weaker noncognate interactions are detected but are restricted to CBR pairs within ∼50 Mb of each other (Fig. 6B,C). This contrasts with the nearly all-to-all trans interactions among Ascaris chromosome ends prior to PDE (Fig. 1C,D). Overall, these data show that specific, transient 3D CBR interactions occur only during PDE, suggesting a role for pairwise CBR interactions in Parascaris PDE (Fig. 6F).
Conserved compartment structure in Ascaris and Parascaris supports a role for PDE in somatic nuclear reorganization
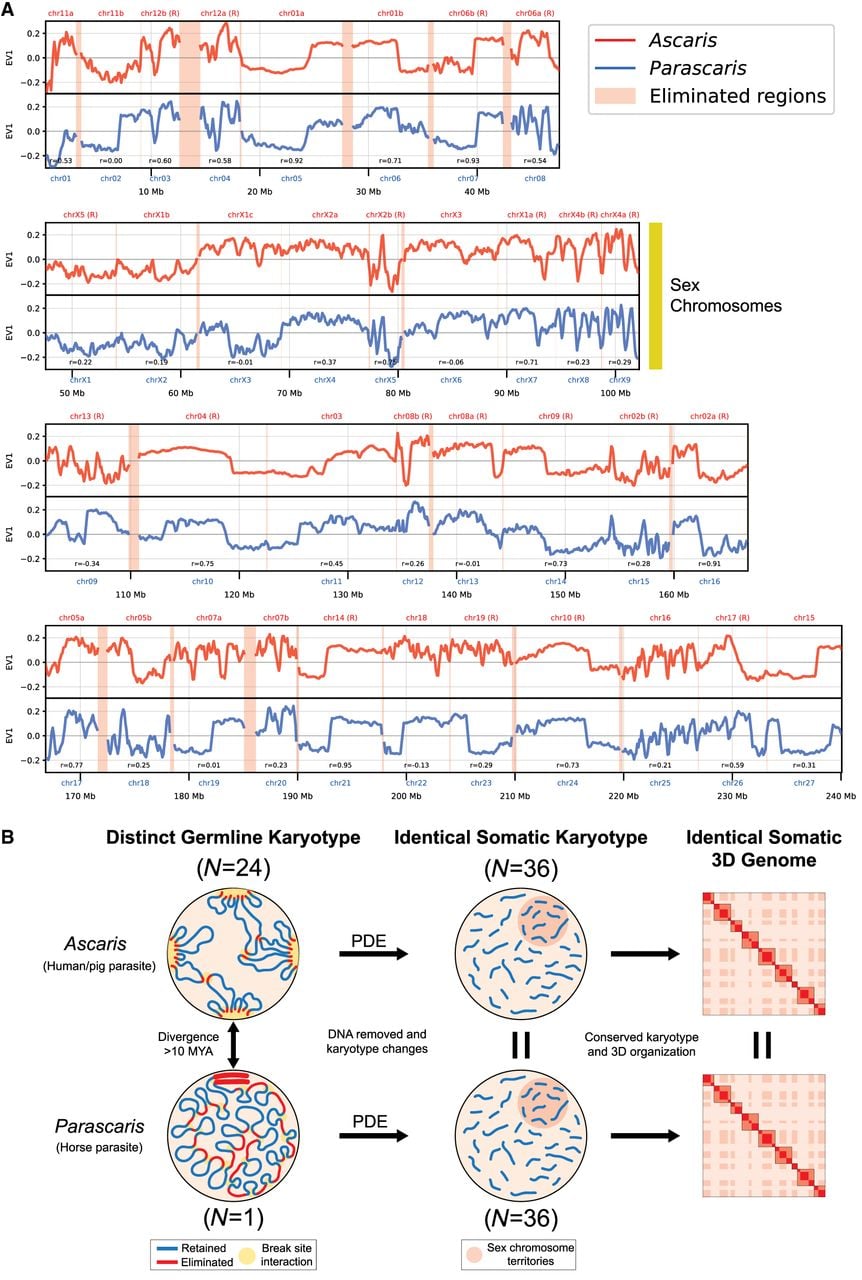
Previous comparative analyses have shown that at sequence level, Ascaris and Parascaris have the same set of somatic chromosomes after PDE (Simmons et al. 2024). To determine if similar programmed compartmentalization changes also occur in Parascaris at the 3D genome level, we performed Hi-C on matching embryonic stages in Parascaris. Analysis of the compartments in both nematodes showed a strong correlation between the two species in post-PDE stages (Fig. 7A). The majority of the matching somatic chromosome pairs (30/36, 83%) have a positive correlation coefficient of the eigenvector value ranging from 0.19 to 0.95 (median = 0.49) (Fig. 7A). Importantly, for many matching pairs, such as Chr01a/Chr05, Chr06b/Chr07, Chr02a/Chr16, and Chr14/Chr21, the somatic compartment patterns are mirrored in Ascaris and Parascaris (Fig. 7A). Considering the divergence of the two species (Qing et al. 2025) and the sampling variations, the similarity of the Hi-C compartments is highly significant. Overall, our result suggests not only that PDE generates the same somatic chromosomes in these two parasites but also that the resulting chromosomes undergo the same programmed compartmental changes after PDE, indicating a conserved somatic 3D genome after PDE.
Chromosomal compartments are conserved between Ascaris and Parascaris. (A) Eigenvector 1 values show conserved compartmentalization between Ascaris (red) and Parascaris (blue) in L1 larvae stages (after PDE). Positive values represent A (active) compartments and negative values represent B (inactive) compartments. Eliminated regions are shown with light red highlights. The chromosomes are ordered based on their positions along the length of the single germline chromosome of Parascaris, with the coordinates shown at the bottom in megabases. Matching somatic chromosomes in Ascaris that are flipped on the x-axis (i.e., genome coordinates) are labeled with R. (B) PDE converts distinct germline karyotypes in Ascaris and Parascaris into identical somatic karyotypes with identical somatic 3D genome organization. For a description of this summary figure, see Discussion section.
Discussion
In the nematode ascarids, DSBs occur within the CBRs of the germline genome, initiating PDE (Fig. 1A). This process results in a highly reduced somatic genome. However, the mechanistic understanding of this process remains elusive. Here, using discrete staged embryos, we carried out Hi-C to examine the 3D genome organization before, during, and after PDE in both Ascaris and Parascaris. Two major findings emerged from our analyses (for summary, see Fig. 7B). First, strong 3D genome interactions among the CBRs are associated with PDE, indicating the 3D genome may facilitate the break site recognition, DSB generation, or DNA repair. Second, PDE is associated with substantial and conserved compartmentalization changes in the somatic chromosomes of both nematodes, suggesting that by removing the 3D genome constraints (eliminated DNA), PDE could play a critical role in reorganizing the somatic 3D genomes.
Recognition of CBRs and organization of PDE foci through 3D genome organization
Ascaris CBRs interact with each other prior to and during PDE (Fig. 1). These interactions extend beyond the sites of CBRs, often covering the neighboring ∼200 kb of retained genome regions (Fig. 3). Notably, many CBRs are located at the boundary of the spatially organized chromosome ends (Fig. 3A), and significant insulation is observed in eliminated regions prior to elimination (Fig. 3C). These findings suggest that CBRs are unique within Ascaris’s 3D genome organization and spatially demarcate the retained and eliminated sides of the DNA. Previous molecular data suggest CBR recognition is likely not dependent on specific sequences (Wang et al. 2017, 2020). Our Hi-C results lead us to propose a model for a sequence-independent mechanism of CBR recognition during Ascaris PDE (Figs. 3E, 7B). We hypothesize that CBRs interact with each other at foci where the machinery for DNA breaks and telomere healing is concentrated (PDE focus) (Figs. 3E, 7B). The model is consistent with the population-level Hi-C interactions observed during PDE. The model is also consistent with a mechanism that does not require nucleotide precision to generate DSBs (Estrem et al. 2024), although it is plausible that other attributes of the CBRs and their localization could enhance the formation and function of PDE foci.
Chromosome end interactions that form the telomere bouquet are a common form of 3D chromosome organization during meiosis (Harper et al. 2004; Tomita and Cooper 2007; Tsai and McKee 2011; Blokhina et al. 2019; Thadani et al. 2026). However, the interactions we observed at chromosome ends are unlikely caused by the telomere interactions. This is because the terminal CBRs have significantly higher trans-chromosomal interactions at the retained sides of breaks, which are farther away from telomeres compared with the eliminated sides (Fig. 3). It remains to be determined if specific sequences within the retained DNA are associated with these interactions. Furthermore, we noticed that internal CBRs, which are far away from telomeres, also exhibit similar types of interactions (Fig. 1B,C). Consequently, we believe that the interactions observed at chromosome ends are likely unique to CBRs but not linked to telomeres. However, because of their locations near the ends of the chromosomes, we currently cannot determine whether the dynamic changes of interactions at the ends are caused by CBRs, telomeres, or both. Notably, we achieved a very high resolution of our Hi-C data by using multiple restriction digestions and high sequencing depth (e.g., 5 kb for Fig. 3). Using these high-resolution Hi-C maps, we did not identify any other significant long-range or interchromosomal pairwise interactions across the genomes (Figs. 1, 2, 6). Thus, the CBR interactions stand out as a unique feature of the 3D genome in these nematodes, setting it apart from any other nematode species examined so far (Crane et al. 2015; Bian et al. 2020; Kim et al. 2022, 2025; Das et al. 2024). The CBRs are the sites where DNA breaks occur, and evolutionarily, they are functionally conserved in both Ascaris and Parascaris. This highlights the significance of these interactions in PDE species.
A plausible mechanism for organizing the PDE foci is through phase-separated condensates (Hyman et al. 2014; Shin and Brangwynne 2017; Sabari et al. 2020; Feric and Misteli 2021; Fujishiro et al. 2025). In other systems, such as olfactory receptor clustering in mammalian cells, phase-separated condensates can reinforce strong interchromosomal interactions similar to the ones observed between CBRs (Pulupa et al. 2025). We suggest proteins and RNAs involved in DNA breaks and telomere addition may concentrate in PDE foci during DNA elimination. Recent studies on the ssDNA-binding protein RPA (Spegg et al. 2023) and telomeres and shelterin components (Jack et al. 2022; Soranno et al. 2022) suggest they could also contribute to the formation of dynamic liquid-like droplets. Furthermore, there is precedence for colocalization of chromatin regions at sites enriched for processing enzymes such as RNA splicing and nuclear speckles (Giudice and Jiang 2024). Additional factors, such as sequence- or nucleosome-dependent elements, may further contribute to the positioning of the CBRs for foci formation and DSB generation. Overall, our data suggest that the CBRs represent a unique genomic feature in nematode PDE at the boundary between the retained and eliminated DNA, and the 3D genome organization of the CBRs and chromosome ends may contribute to their recognition, foci formation, and the initiation and/or execution of PDE.
In Ascaris, the CBR and chromosome end interactions precede PDE in the germline and early embryos (Fig. 2). It remains to be determined whether these interactions persist through fertilization and pronuclear fusion or whether they are erased and re-established in the zygote. Even though these interactions exist in the germline, the factors associated with PDE foci (Fig. 3E) formation and function may not be present, thereby preventing PDE from occurring in germline. We speculate that these interactions in germline stages serve a separate germline function, likely involved in chromosome organization during meiosis (Thadani et al. 2026). In C. elegans, pairing and synapsis are achieved through the recognition of the pairing centers at one end of each chromosome by four related zinc finger proteins (MacQueen et al. 2005; Phillips and Dernburg 2006). These zinc-finger pairing-center proteins and many other genes involved in C. elegans homolog pairing are absent in Ascaris and Parascaris (Simmons et al. 2024). Because these pairing-center proteins appear restricted to Caenorhabditis and its close relatives, their absence in Ascaris and Parascaris most likely reflects their origin within the Caenorhabditis lineage rather than a loss associated with PDE (Simmons et al. 2024; Stevens et al. 2025). These ascarid species must therefore pair their homologs by other means. Our Hi-C data provide support that indeed, these germline chromosomes can interact with each other using their chromosome ends (Fig. 2). These interactions may be an intrinsic feature associated with the sequences at the chromosome ends. During PDE, these sequences are removed, and the interactions among retained regions near the CBRs are abrogated. Therefore, PDE may offer a means to remove chromosome ends that function in the germline but are no longer required or may even be harmful in somatic cells. Some of these CBRs show interactions along the entire length of multiple other chromosomes, leading to the formation of long stripe patterns in the Hi-C map (Figs. 1, 2). These long stripes could potentially signify an active searching, scanning, or looping mechanism.
The CBRs from Parascaris also interact during PDE. However, unlike Ascaris CBRs that form extensive interactions among the two CBR groups (Fig. 1B), Parascaris CBRs engage in pairwise interactions mostly for cognate CBR pairs from the future ends of each somatic chromosome (Fig. 6). The Parascaris pairwise CBR interactions are weaker compared with Ascaris CBR interactions and occur transiently only during PDE stages. They are reminiscent of the “beads-on-a-string” model proposed based on an early cytology study (Niedermaier and Moritz 2000), in which the “beads” represent retained and condensed future somatic chromosomes, and the “string” represents internally eliminated DNA associated with looser chromatin during PDE (Fig. 6F). Thus, our Hi-C data appear to corroborate the cytologic observation that the CBRs in Parascaris are at the boundaries of spatially organized chromosomes that could separate the retained and eliminated DNA (Fig. 6). The differences in CBR interactions observed in these two nematodes may be attributed to the unique organization of the single homologous pair of the 2.5 Gb Parascaris germline chromosomes (Simmons et al. 2024). Ascaris CBRs are distributed across 24 chromosomes that can interact more freely in the nucleus, whereas all 72 Parascaris CBRs are confined to a single 240 Mb euchromatic core flanked by heterochromatic arms comprising >85% of the genome. The distribution of CBRs in Parascaris constrains their 3D interactions, consistent with our observation that interactions are limited to CBRs within ∼50 Mb of each other (Fig. 6C).
PDE provides a means to reorganize the somatic chromosomes
PDE resolves fused germline chromosomes (Ascaris = 24 and Parascaris = 1) into the same set of 36 somatic chromosomes (Fig. 7B; Simmons et al. 2024). We previously suggested that the restoration of the somatic karyotype may confer biological functions (Simmons et al. 2024). Here, we demonstrate that the somatic 3D genome organization, as exemplified by the compartmentalization changes following PDE, is conserved between the two species (Fig. 7A). Although the impact of these compartmentalization changes on individual genes may be limited or negligible, the aggregate effect on numerous genes influenced by these changes could be substantial. Although the evolutionary trajectories leading to the current germline chromosomes are different (Simmons et al. 2024), partitioning of the germline chromosomes leads to somatic chromosomes that retain the “memory” of the ancestral 3D genome organization. This underscores the important role of PDE in splitting the fused germline chromosomes.
Chromosome reorganization is a common response to DSBs (Sanders et al. 2020; Arnould et al. 2023; Zagelbaum et al. 2023; Chiolo et al. 2025). Unlike most DSBs that are repaired using nonhomologous end joining or homologous recombination, DSBs induced by PDE in nematodes are healed through telomere addition (Müller et al. 1991; Estrem et al. 2024). This telomere-mediated repair process may also contribute to chromosome reorganization by forming condensates surrounding the break sites. Analysis of the Hi-C data across all 36 somatic chromosomes revealed consistent temporal changes in the 3D genome structure, showing the decreased insulation at and around the DSBs during PDE (Fig. 4A). This change may be attributed to (1) the liberation of CBRs from their germline chromosome locations, (2) the DSB and telomere healing mechanisms, and (3) the formation of new heterochromatic regions at the somatic chromosome ends.
In the ciliate Tetrahymena thermophila, distinct higher-order chromatin organization was observed in the germline micronucleus and somatic macronucleus (Luo et al. 2020), suggesting that the 3D genome may play important roles during the development of the macronucleus chromosomes during PDE. Similarly, a recent study in the ciliate Oxytricha trifallax also suggested widespread 3D genome reorganization before the onset of PDE (Villano et al. 2025). Another recent genomic study in the ciliate Paramecium aurelia found that the ends of the germline chromosomes form a distinct genomic compartment that is eliminated during early somatic development (Arnaiz et al. 2026). These ciliate findings echo the spatial separation of retained and eliminated DNA that we observe at the 3D level in nematodes (Fig. 3).
The B–A–B-compartment profile of C. elegans chromosomes may be associated with the ancestral linkage groups in nematodes known as Nigon elements (Tandonnet et al. 2019; Gonzalez de la Rosa et al. 2021). Recent studies show that fused chromosomes retain the centrality of the active compartment (Yoshida et al. 2023; Chung et al. 2026). However, this compartment profile is not consistently observed in Ascaris and Parascaris somatic chromosomes, even though Nigon elements are largely maintained in their genomes (Simmons et al. 2024). Some of these differences could be attributed to the more discrete early embryo stages used in our study, although Hi-C data from a strictly somatic tissue (such as the intestine) (Simmons et al. 2024) also did not exhibit a consistent B–A–B-compartment profile. Because Ascaris and Parascaris belong to the distant clade III of nematodes, it is plausible that their compartment profiles may have diverged from those of rhabditid nematodes (clade V), in which Nigon elements were originally defined. Although many of the observed compartmental changes are specifically linked to the break sites associated with PDE (Figs. 5, 7A), we recognize that PDE occurs alongside other dynamic developmental processes during embryogenesis; thus, it is also plausible that some of these compartmental changes may be part of the developmental program.
Together, our findings integrate PDE into the broader framework of nematode chromatin organization. In these ascarids, the 3D genome spatially demarcates the retained and eliminated DNA before PDE. Following PDE, the 3D genome adopts a conserved somatic organization, suggesting that genome architecture is both a contributor to and a product of programmed genome remodeling.
Methods
Nematode sample collection and staging
Ascaris ovaries and testes were dissected from adult worms. Ascaris one-cell embryos were collected from fresh uteri by dissolving the tissue with two treatments: 0.5 N NaOH for 60 min at room temperature, followed by washing in cold PBS buffer (pH 7.0). Embryonation of Ascaris zygotes was performed in PBS (pH 2.0) at 30°C while shaking for 10 h (one cell), 48 h (two to four cells), 60 h (four to eight cells), 5 days (32–64 cells), and 10 days (L1 larvae). Ovary, testes, and staged embryos were frozen in liquid nitrogen and stored at −80°C until use.
The collection of P. univalens zygotes and embryonation were performed as previously described (Simmons et al. 2024). Dissected zygotes were stored at 4°C. Embryonation was performed in PBS (pH 2.0) at 37°C while shaking for 0 h (one cell), 17 h (two to four cells), 24 h (four to eight cells), 48 h (100–500 cells), 60 h (300–800 cells), or 72 h (L1 larvae).
Hi-C library preparation
Fixation was performed using the Arima-HiC 2.0 kit standard input protocol for Ascaris ovaries and testis. For both Ascaris and Parascaris embryos, the low input protocol was used, with the following modification: Cell membranes were disrupted by forcing cells through a small metal Dounce in 5 mL of PBS+TC buffer (22% formaldehyde, 50 mM HEPES at pH 8.0, 0.5 mM EGTA, 1 mM EDTA, 100 mM NaCl) kept on ice. Hi-C was performed using the Arima-HiC 2.0 kit according to the manufacturer's protocol (Arima A410110).
Illumina libraries were constructed using the Swift Biosciences Accel-NGS 2S plus DNA library kit (Swift 21024) and the NEBNext Ultra II DNA library prep kit (NEB). Libraries were amplified using the KAPA library amplification kit (Roche KK2620) according to the manufacturer's protocols. Sample concentrations were measured with a DNA Qubit (Invitrogen Q33238), and library fragment sizes were confirmed using a TapeStation 4200 (Agilent). Illumina libraries were sequenced using a NovaSeq 6000 paired-end reads (150 bp) to a depth of 16–60 folds.
Multiomic data generation
The following data sets used for multiomic analysis were previously published: ATAC-seq, RNA-seq, and ChIP-seq for histone marks (H3K4me3, H3S10P, H3K36me2, H3K36me3, H3K9me3), as well as RNA polymerase II (Wang et al. 2014, 2017, 2020; Kang et al. 2016).
Computational analysis
Detailed bioinformatic methods are described in the Supplemental Material.
Computational implementation and artificial intelligence usage
Hi-C data processing and visualization were performed with custom Python and shell scripts (see Supplemental Code). Analyses were implemented in Python 3.9–3.10 (https://www.python.org) using NumPy v1.21.0–1.24.3 (Harris et al. 2020) for linear algebra operations, pandas v1.3.0–2.0.3 (McKinney 2010) for data manipulation, Matplotlib v3.5.0–3.7.1 (Hunter 2007) and seaborn v0.11.0 (Waskom 2021) for visualization, and SciPy v1.9.0 (Virtanen et al. 2020) for statistical tests. Claude Opus 4.6 and 4.8 (Anthropic; https://www.anthropic.com) assisted with script development and debugging and with refining technical descriptions for clarity and concision; all outputs were verified through manual inspection and comparison with published methods.
Data access
The Hi-C data for Ascaris and Parascaris generated in this study have been submitted to the NCBI Gene Expression Omnibus (GEO; https://www.ncbi.nlm.nih.gov/geo/) under accession numbers GSE314626 and GSE315650, respectively. All data and scripts are also available at GitHub (https://github.com/jsimmo45/Nematode-3D-Genome-PDE). All newly generated custom Python and shell scripts required to reproduce the analyses are provided as Supplemental Code.
Competing interest statement
The authors declare no competing interests.
Acknowledgments
We thank Martin Neilsen for the Parascaris material and Bruce Bamber, Jeff Myers, and Routh Packing for their support and hospitality in collecting Ascaris material. We thank the Wang laborartory members for helpful discussions. We also thank Brandon Estrem, Mariano Labrador, and Dick Davis for comments, edits, and critical reading of the manuscript. This work was supported by National Institutes of Health grants to J.W. (National Institute of Allergy and Infectious Diseases: R01AI155588 and National Institute of General Medical Sciences [NIGMS]: R01GM151551) and R.P.M. (NIGMS: R35GM133557) and the University of Tennessee Knoxville Startup Funds to J.W.
Author contributions: J.R.S. and J.W. designed the project; J.R.S. made Hi-C libraries; J.R.S. improved the Ascaris genome assembly; J.R.S., T.X., and R.P.M. performed Hi-C data analysis; J.R.S. wrote the initial draft; J.W. wrote the manuscript; J.R.S., R.P.M., and J.W. reviewed and edited the manuscript; J.W. and R.P.M. provided supervision; and J.W. managed the project and provided funding.
Footnotes
[1] Supplementary material [Supplemental material is available for this article.]
[2] Article published online before print. Article, supplemental material, and publication date are at https://www.genome.org/cgi/doi/10.1101/gr.282223.126.
[3] Freely available online through the Genome Research Open Access option.
References
- ↵Arnaiz O, Guérin F, Couloux A, Miró-Pina C, Pellerin G, Nekrasova I, Amselem J, Aury JM, Bhullar S, Frapporti A, 2026. The tiny germline chromosomes of Paramecium aurelia have an exceptionally high recombination rate and are capped by a new class of Helitrons. BMC Biol 24: 99. 10.1186/s12915-026-02584-w
- ↵Arnould C, Rocher V, Saur F, Bader AS, Muzzopappa F, Collins S, Lesage E, Le Bozec B, Puget N, Clouaire T, 2023. Chromatin compartmentalization regulates the response to DNA damage. Nature 623: 183–192. 10.1038/s41586-023-06635-y
- ↵Azzaria M, McGhee JD. 1992. DNA synthesis in the early embryo of the nematode Ascaris suum. Dev Biol 152: 89–93. 10.1016/0012-1606(92)90158-D
- ↵Bendich AJ, Rogers SO. 2025. The biological and evolutionary consequences of competition between DNA sequences that benefit the cell and DNA sequences that benefit themselves. Nucleic Acids Res 53: gkaf589. 10.1093/nar/gkaf589
- ↵Betermier M, Klobutcher LA, Orias E. 2023. Programmed chromosome fragmentation in ciliated protozoa: multiple means to chromosome ends. Microbiol Mol Biol Rev 87: e0018422. 10.1128/mmbr.00184-22
- ↵Bian Q, Anderson EC, Yang Q, Meyer BJ. 2020. Histone H3K9 methylation promotes formation of genome compartments in Caenorhabditis elegans via chromosome compaction and perinuclear anchoring. Proc Natl Acad Sci 117: 11459–11470. 10.1073/pnas.2002068117
- ↵Blokhina YP, Nguyen AD, Draper BW, Burgess SM. 2019. The telomere bouquet is a hub where meiotic double-strand breaks, synapsis, and stable homolog juxtaposition are coordinated in the zebrafish, Danio rerio. PLoS Genet 15: e1007730. 10.1371/journal.pgen.1007730
- ↵Bonev B, Mendelson Cohen N, Szabo Q, Fritsch L, Papadopoulos GL, Lubling Y, Xu X, Lv X, Hugnot JP, Tanay A, 2017. Multiscale 3D genome rewiring during mouse neural development. Cell 171: 557–572.e24. 10.1016/j.cell.2017.09.043
- ↵Borodin P, Chen A, Forstmeier W, Fouché S, Malinovskaya L, Pei Y, Reifová R, Ruiz-Ruano FJ, Schlebusch SA, Sotelo-Munoz M, 2022. Mendelian nightmares: the germline-restricted chromosome of songbirds. Chromosome Res 30: 255–272. 10.1007/s10577-022-09688-3
- ↵Chen J, Birchler JA, Houben A. 2022. The non-Mendelian behavior of plant B chromosomes. Chromosome Res 30: 229–239. 10.1007/s10577-022-09687-4
- ↵Chiolo I, Altmeyer M, Legube G, Mekhail K. 2025. Nuclear and genome dynamics underlying DNA double-strand break repair. Nat Rev Mol Cell Biol 26: 538–557. 10.1038/s41580-025-00828-1
- ↵Chung G, Stevens L, Dai X, Hickey S, Kiontke K, Rughani P, Kieninger MR, Collins JC, Juul S, Piano F, 2026. Genome evolution in parthenogenetic nematodes shaped by chromosome rearrangements and introgression. Genome Res 36: 1354–1368. 10.1101/gr.281318.125
- ↵Crane E, Bian Q, McCord RP, Lajoie BR, Wheeler BS, Ralston EJ, Uzawa S, Dekker J, Meyer BJ. 2015. Condensin-driven remodelling of X chromosome topology during dosage compensation. Nature 523: 240–244. 10.1038/nature14450
- ↵Das M, Semple JI, Haemmerli A, Volodkina V, Scotton J, Gitchev T, Annan A, Campos J, Statzer C, Dakhovnik A, 2024. Condensin I folds the Caenorhabditis elegans genome. Nat Genet 56: 1737–1749. 10.1038/s41588-024-01832-5
- ↵Dedukh D, Krasikova A. 2021. Delete and survive: strategies of programmed genetic material elimination in eukaryotes. Biol Rev Camb Philos Soc 97: 195–216. 10.1111/brv.12796
- ↵Dekker J, Mirny LA. 2024. The chromosome folding problem and how cells solve it. Cell 187: 6424–6450. 10.1016/j.cell.2024.10.026
- ↵Drotos KHI, Zagoskin MV, Kess T, Gregory TR, Wyngaard GA. 2022. Throwing away DNA: programmed downsizing in somatic nuclei. Trends Genet 38: 483–500. 10.1016/j.tig.2022.02.003
- ↵Easton A, Gao S, Lawton SP, Bennuru S, Khan A, Dahlstrom E, Oliveira RG, Kepha S, Porcella SF, Webster J, 2020. Molecular evidence of hybridization between pig and human Ascaris indicates an interbred species complex infecting humans. eLife 9: e61562. 10.7554/eLife.61562
- ↵Estrem B, Wang J. 2023. Programmed DNA elimination in the parasitic nematode Ascaris. PLoS Pathog 19: e1011087. 10.1371/journal.ppat.1011087
- ↵Estrem B, Davis RE, Wang J. 2024. End resection and telomere healing of DNA double-strand breaks during nematode programmed DNA elimination. Nucleic Acids Res 52: 8913–8929. 10.1093/nar/gkae579
- ↵Feric M, Misteli T. 2021. Phase separation in genome organization across evolution. Trends Cell Biol 31: 671–685. 10.1016/j.tcb.2021.03.001
- ↵Fujishiro S, Sasai M, Maeshima K. 2025. Chromatin domains in the cell: phase separation and condensation. Curr Opin Struct Biol 91: 103006. 10.1016/j.sbi.2025.103006
- ↵Gassler J, Brandão HB, Imakaev M, Flyamer IM, Ladstätter S, Bickmore WA, Peters JM, Mirny LA, Tachibana K. 2017. A mechanism of cohesin-dependent loop extrusion organizes zygotic genome architecture. EMBO J 36: 3600–3618. 10.15252/embj.201798083
- ↵Gerstein MB, Lu ZJ, Van Nostrand EL, Cheng C, Arshinoff BI, Liu T, Yip KY, Robilotto R, Rechtsteiner A, Ikegami K, 2010. Integrative analysis of the Caenorhabditis elegans genome by the modENCODE project. Science 330: 1775–1787. 10.1126/science.1196914
- ↵Giorgetti L, Lajoie BR, Carter AC, Attia M, Zhan Y, Xu J, Chen CJ, Kaplan N, Chang HY, Heard E, 2016. Structural organization of the inactive X chromosome in the mouse. Nature 535: 575–579. 10.1038/nature18589
- ↵Giudice J, Jiang H. 2024. Splicing regulation through biomolecular condensates and membraneless organelles. Nat Revi Mol Cell Biol 25: 683–700. 10.1038/s41580-024-00739-7
- ↵Goloborodko A, Imakaev MV, Marko JF, Mirny L. 2016. Compaction and segregation of sister chromatids via active loop extrusion. eLife 5: e14864. 10.7554/eLife.14864
- ↵Gonzalez de la Rosa PM, Thomson M, Trivedi U, Tracey A, Tandonnet S, Blaxter M. 2021. A telomere-to-telomere assembly of Oscheius tipulae and the evolution of rhabditid nematode chromosomes. G3 (Bethesda) 11: jkaa020. 10.1093/g3journal/jkaa020
- ↵Grishanin A. 2014. Chromatin diminution in Copepoda (Crustacea): pattern, biological role and evolutionary aspects. Comp Cytogenet 8: 1–10. 10.3897/compcytogen.v8i1.5913
- ↵Hanlon VCT, Cagan A, Eves-van den Akker S. 2025. How and when organisms edit their own genomes. Nat Genet 57: 1823–1834. 10.1038/s41588-025-02230-1
- ↵Harper L, Golubovskaya I, Cande WZ. 2004. A bouquet of chromosomes. J Cell Sci 117: 4025–4032. 10.1242/jcs.01363
- ↵Harris CR, Millman KJ, van der Walt SJ, Gommers R, Virtanen P, Cournapeau D, Wieser E, Taylor J, Berg S, Smith NJ, 2020. Array programming with NumPy. Nature 585: 357–362. 10.1038/s41586-020-2649-2
- ↵Herbette M, Ross L. 2023. Paternal genome elimination: patterns and mechanisms of drive and silencing. Curr Opin Genet Dev 81: 102065. 10.1016/j.gde.2023.102065
- ↵Hu J, Zhang Y, Zhao L, Frock RL, Du Z, Meyers RM, Meng FL, Schatz DG, Alt FW. 2015. Chromosomal loop domains direct the recombination of antigen receptor genes. Cell 163: 947–959. 10.1016/j.cell.2015.10.016
- ↵Hunter JD. 2007. Matplotlib: a 2D graphics environment. Comput Sci Eng 9: 90–95. 10.1109/MCSE.2007.55
- ↵Hyman AA, Weber CA, Jülicher F. 2014. Liquid-liquid phase separation in biology. Annu Rev Cell Dev Biol 30: 39–58. 10.1146/annurev-cellbio-100913-013325
- ↵Jack A, Kim Y, Strom AR, Lee DSW, Williams B, Schaub JM, Kellogg EH, Finkelstein IJ, Ferro LS, Yildiz A, 2022. Compartmentalization of telomeres through DNA-scaffolded phase separation. Dev Cell 57: 277–290.e9. 10.1016/j.devcel.2021.12.017
- ↵Jash E, Csankovszki G. 2024. Chromatin organization during C. elegans early development. DNA 4: 64–83. 10.3390/dna4010004
- ↵Kaaij LJT, van der Weide RH, Ketting RF, de Wit E. 2018. Systemic loss and gain of chromatin architecture throughout zebrafish development. Cell Rep 24: 1–10.e4. 10.1016/j.celrep.2018.06.003
- ↵Kang Y, Wang J, Neff A, Kratzer S, Kimura H, Davis RE. 2016. Differential chromosomal localization of centromeric histone CENP-A contributes to nematode programmed DNA elimination. Cell Rep 16: 2308–2316. 10.1016/j.celrep.2016.07.079
- ↵Kim J, Jimenez DS, Ragipani B, Zhang B, Street LA, Kramer M, Albritton SE, Winterkorn LH, Morao AK, Ercan S. 2022. Condensin DC loads and spreads from recruitment sites to create loop-anchored TADs in C. elegans. eLife 11: e68745. 10.7554/eLife.68745.sa2
- ↵Kim J, Wang H, Ercan S. 2025. Cohesin organizes 3D DNA contacts surrounding active enhancers in C. elegans. Genome Res 35: 1108–1123. 10.1101/gr.279365.124
- ↵Kloc M, Kubiak JZ, Ghobrial RM. 2022. Natural genetic engineering: a programmed chromosome/DNA elimination. Dev Biol 486: 15–25. 10.1016/j.ydbio.2022.03.008
- ↵Lajoie BR, Dekker J, Kaplan N. 2015. The Hitchhiker's guide to Hi-C analysis: practical guidelines. Methods 72: 65–75. 10.1016/j.ymeth.2014.10.031
- ↵Li H, Playter C, Das P, McCord RP. 2024. Chromosome compartmentalization: causes, changes, consequences, and conundrums. Trends Cell Biol 34: 707–727. 10.1016/j.tcb.2024.01.009
- ↵Luo Z, Hu T, Jiang H, Wang R, Xu Q, Zhang S, Cao J, Song X. 2020. Rearrangement of macronucleus chromosomes correspond to TAD-like structures of micronucleus chromosomes in Tetrahymena thermophila. Genome Res 30: 406–414. 10.1101/gr.241687.118
- ↵MacQueen AJ, Phillips CM, Bhalla N, Weiser P, Villeneuve AM, Dernburg AF. 2005. Chromosome sites play dual roles to establish homologous synapsis during meiosis in C. elegans. Cell 123: 1037–1050. 10.1016/j.cell.2005.09.034
- ↵McCord RP, Kaplan N, Giorgetti L. 2020. Chromosome conformation capture and beyond: toward an integrative view of chromosome structure and function. Mol Cell 77: 688–708. 10.1016/j.molcel.2019.12.021
- ↵McKinney W. 2010. Data structures for statistical computing in Python. In Proceedings of the Ninth Python in Science Conference, Austin, TX (ed. van der Walt S, Millman J), pp. 56–61. SciPy (scipy.org), Austin, TX. 10.25080/Majora-92bf1922-00a
- ↵Minajigi A, Froberg J, Wei C, Sunwoo H, Kesner B, Colognori D, Lessing D, Payer B, Boukhali M, Haas W, 2015. A comprehensive Xist interactome reveals cohesin repulsion and an RNA-directed chromosome conformation. Science 349: aab2276. 10.1126/science.aab2276
- ↵Mochizuki K. 2024. Programmed DNA elimination. Curr Biol 34: R843–R847. 10.1016/j.cub.2024.07.103
- ↵Müller F, Wicky C, Spicher A, Tobler H. 1991. New telomere formation after developmentally regulated chromosomal breakage during the process of chromatin diminution in Ascaris lumbricoides. Cell 67: 815–822. 10.1016/0092-8674(91)90076-B
- ↵Müller LSM, Cosentino RO, Förstner KU, Guizetti J, Wedel C, Kaplan N, Janzen CJ, Arampatzi P, Vogel J, Steinbiss S, 2018. Genome organization and DNA accessibility control antigenic variation in trypanosomes. Nature 563: 121–125. 10.1038/s41586-018-0619-8
- ↵Niedermaier J, Moritz KB. 2000. Organization and dynamics of satellite and telomere DNAs in Ascaris: implications for formation and programmed breakdown of compound chromosomes. Chromosoma 109: 439–452. 10.1007/s004120000104
- ↵Phillips CM, Dernburg AF. 2006. A family of zinc-finger proteins is required for chromosome-specific pairing and synapsis during meiosis in C. elegans. Dev Cell 11: 817–829. 10.1016/j.devcel.2006.09.020
- ↵Pulupa J, McArthur NG, Stathi O, Wang M, Zazhytska M, Pirozzolo ID, Nayar A, Shapiro L, Lomvardas S. 2025. Solid phase transitions as a solution to the genome folding paradox. Nature 643: 820–829. 10.1038/s41586-025-09043-6
- ↵Qing X, Zhang YM, Sun S, Ahmed M, Lo WS, Bert W, Holovachov O, Li H. 2025. Phylogenomic insights into the evolution and origin of nematoda. Syst Biol 74: 349–358. 10.1093/sysbio/syae073
- ↵Rabuffo C, Schmidt MR, Yadav P, Tong P, Carloni R, Barcons-Simon A, Cosentino RO, Krebs S, Matthews KR, Allshire RC, 2024. Inter-chromosomal transcription hubs shape the 3D genome architecture of African trypanosomes. Nat Commun 15: 10716. 10.1038/s41467-024-55285-9
- ↵Rajarajan P, Borrman T, Liao W, Schrode N, Flaherty E, Casino C, Powell S, Yashaswini C, LaMarca EA, Kassim B, 2018. Neuron-specific signatures in the chromosomal connectome associated with schizophrenia risk. Science 362: eaat4311. 10.1126/science.aat4311
- ↵Rzeszutek I, Maurer-Alcala XX, Nowacki M. 2020. Programmed genome rearrangements in ciliates. Cell Mol Life Sci 77: 4615–4629. 10.1007/s00018-020-03555-2
- ↵Sabari BR, Dall'Agnese A, Young RA. 2020. Biomolecular condensates in the nucleus. Trends Biochem Sci 45: 961–977. 10.1016/j.tibs.2020.06.007
- ↵Sanders JT, Freeman TF, Xu Y, Golloshi R, Stallard MA, Hill AM, San Martin R, Balajee AS, McCord RP. 2020. Radiation-induced DNA damage and repair effects on 3D genome organization. Nat Commun 11: 6178. 10.1038/s41467-020-20047-w
- ↵Sawh AN, Mango SE. 2022. Chromosome organization in 4D: insights from C. elegans development. Curr Opin Genet Dev 75: 101939. 10.1016/j.gde.2022.101939
- ↵Sawh AN, Shafer MER, Su J-H, Zhuang X, Wang S, Mango SE. 2020. Lamina-dependent stretching and unconventional chromosome compartments in early C. elegans embryos. Mol Cell 78: 96–111.e6. 10.1016/j.molcel.2020.02.006
- ↵Shin Y, Brangwynne CP. 2017. Liquid phase condensation in cell physiology and disease. Science 357: eaaf4382. 10.1126/science.aaf4382
- ↵Simmons JR, Estrem B, Zagoskin MV, Oldridge R, Zadegan SB, Wang J. 2024. Chromosome fusion and programmed DNA elimination shape karyotypes of nematodes. Curr Biol 34: 2147–2161.e5. 10.1016/j.cub.2024.04.022
- ↵Smith JJ, Timoshevskiy VA, Saraceno C. 2021. Programmed DNA elimination in vertebrates. Annu Rev Anim Biosci 9: 173–201. 10.1146/annurev-animal-061220-023220
- ↵Soranno A, Incicco JJ, De Bona P, Tomko EJ, Galburt EA, Holehouse AS, Galletto R. 2022. Shelterin components modulate nucleic acids condensation and phase separation in the context of telomeric DNA. J Mol Biol 434: 167685. 10.1016/j.jmb.2022.167685
- ↵Spegg V, Panagopoulos A, Stout M, Krishnan A, Reginato G, Imhof R, Roschitzki B, Cejka P, Altmeyer M. 2023. Phase separation properties of RPA combine high-affinity ssDNA binding with dynamic condensate functions at telomeres. Nat Struct Mol Biol 30: 451–462. 10.1038/s41594-023-00932-w
- ↵Srinivasan J, Agbaga M, Terta V, Estrem B, Simmons JR, Oldridge R, Iftikhar M, West A, Lam H, Dockendorff TC, 2026. A sequence motif for DNA double-strand break and telomere healing during programmed DNA elimination. bioRxiv 10.64898/2026.03.06.709695
- ↵Stevens L, Sun S, Haruta N, Xiao L, Uwatoko N, Kieninger M, Sato K, Yoshida A, Absolon D, Collins J, 2025. Programmed DNA elimination was present in the last common ancestor of Caenorhabditis nematodes. bioRxiv 10.1101/2025.10.23.681605
- ↵Streit A, Wang J, Kang Y, Davis RE. 2016. Gene silencing and sex determination by programmed DNA elimination in parasitic nematodes. Curr Opin Microbiol 32: 120–127. 10.1016/j.mib.2016.05.012
- ↵Strom AR, Emelyanov AV, Mir M, Fyodorov DV, Darzacq X, Karpen GH. 2017. Phase separation drives heterochromatin domain formation. Nature 547: 241–245. 10.1038/nature22989
- ↵Tandonnet S, Koutsovoulos GD, Adams S, Cloarec D, Parihar M, Blaxter ML, Pires-daSilva A. 2019. Chromosome-wide evolution and sex determination in the three-sexed nematode Auanema rhodensis. G3 (Bethesda) 9: 1211–1230. 10.1534/g3.119.0011
- ↵Thadani R, Johnson N, Cooper JP. 2026. Chromosome ends in motion: telomeres as hazards and hubs in meiosis. Cold Spring Harb Perspect Biol 18: a041705. 10.1101/cshperspect.a041705
- ↵Tomita K, Cooper JP. 2007. The telomere bouquet controls the meiotic spindle. Cell 130: 113–126. 10.1016/j.cell.2007.05.024
- ↵Tsai JH, McKee BD. 2011. Homologous pairing and the role of pairing centers in meiosis. J Cell Sci 124: 1955–1963. 10.1242/jcs.006387
- ↵Villano DJ, Prahlad M, Singhal A, Sanbonmatsu KY, Landweber LF. 2025. Widespread 3D genome reorganization precedes programmed DNA rearrangement in Oxytricha trifallax. bioRxiv 10.1101/2024.12.31.630814
- ↵Virtanen P, Gommers R, Oliphant TE, Haberland M, Reddy T, Cournapeau D, Burovski E, Peterson P, Weckesser W, Bright J, 2020. SciPy 1.0: fundamental algorithms for scientific computing in Python. Nat Methods 17: 261–272. 10.1038/s41592-019-0686-2
- ↵Wang J, Davis RE. 2014. Programmed DNA elimination in multicellular organisms. Curr Opin Genet Dev 27C: 26–34. 10.1016/j.gde.2014.03.012
- ↵Wang J, Davis RE. 2020. Ascaris. Curr Biol 30: R423–R425. 10.1016/j.cub.2020.02.064
- ↵Wang J, Mitreva M, Berriman M, Thorne A, Magrini V, Koutsovoulos G, Kumar S, Blaxter ML, Davis RE. 2012. Silencing of germline-expressed genes by DNA elimination in somatic cells. Dev Cell 23: 1072–1080. 10.1016/j.devcel.2012.09.020
- ↵Wang J, Garrey J, Davis RE. 2014. Transcription in pronuclei and one- to four-cell embryos drives early development in a nematode. Curr Biol 24: 124–133. 10.1016/j.cub.2013.11.045
- ↵Wang J, Gao S, Mostovoy Y, Kang Y, Zagoskin M, Sun Y, Zhang B, White LK, Easton A, Nutman TB, 2017. Comparative genome analysis of programmed DNA elimination in nematodes. Genome Res 27: 2001–2014. 10.1101/gr.225730.117
- ↵Wang J, Veronezi GMB, Kang Y, Zagoskin M, O'Toole ET, Davis RE. 2020. Comprehensive chromosome end remodeling during programmed DNA elimination. Curr Biol 30: 3397–3413.e4. 10.1016/j.cub.2020.06.058
- ↵Waskom ML. 2021. seaborn: statistical data visualization. J Open Source Softw 6: 3021. 10.21105/joss.03021
- ↵Yoshida K, Rödelsperger C, Röseler W, Riebesell M, Sun S, Kikuchi T, Sommer RJ. 2023. Chromosome fusions repatterned recombination rate and facilitated reproductive isolation during Pristionchus nematode speciation. Nat Ecol Evol 7: 424–439. 10.1038/s41559-022-01980-z
- ↵Zagelbaum J, Schooley A, Zhao J, Schrank BR, Callen E, Zha S, Gottesman ME, Nussenzweig A, Rabadan R, Dekker J, 2023. Multiscale reorganization of the genome following DNA damage facilitates chromosome translocations via nuclear actin polymerization. Nat Struct Mol Biol 30: 99–106. 10.1038/s41594-022-00893-6
- ↵Zagoskin MV, Wang J. 2021. Programmed DNA elimination: silencing genes and repetitive sequences in somatic cells. Biochem Soc Trans 49: 1891–1903. 10.1042/BST20190951
- ↵Zagoskin M, Kang Y, Davis RE, Wang J. 2025. Argonautes and small RNAs associated with nematode programmed DNA elimination. bioRxiv 10.1101/2025.10.23.684123
- ↵Zhang Y, McCord RP, Ho YJ, Lajoie BR, Hildebrand DG, Simon AC, Becker MS, Alt FW, Dekker J. 2012. Spatial organization of the mouse genome and its role in recurrent chromosomal translocations. Cell 148: 908–921. 10.1016/j.cell.2012.02.002
- ↵Zheng H, Xie W. 2019. The role of 3D genome organization in development and cell differentiation. Nat Rev Mol Cell Biol 20: 535–550. 10.1038/s41580-019-0132-4