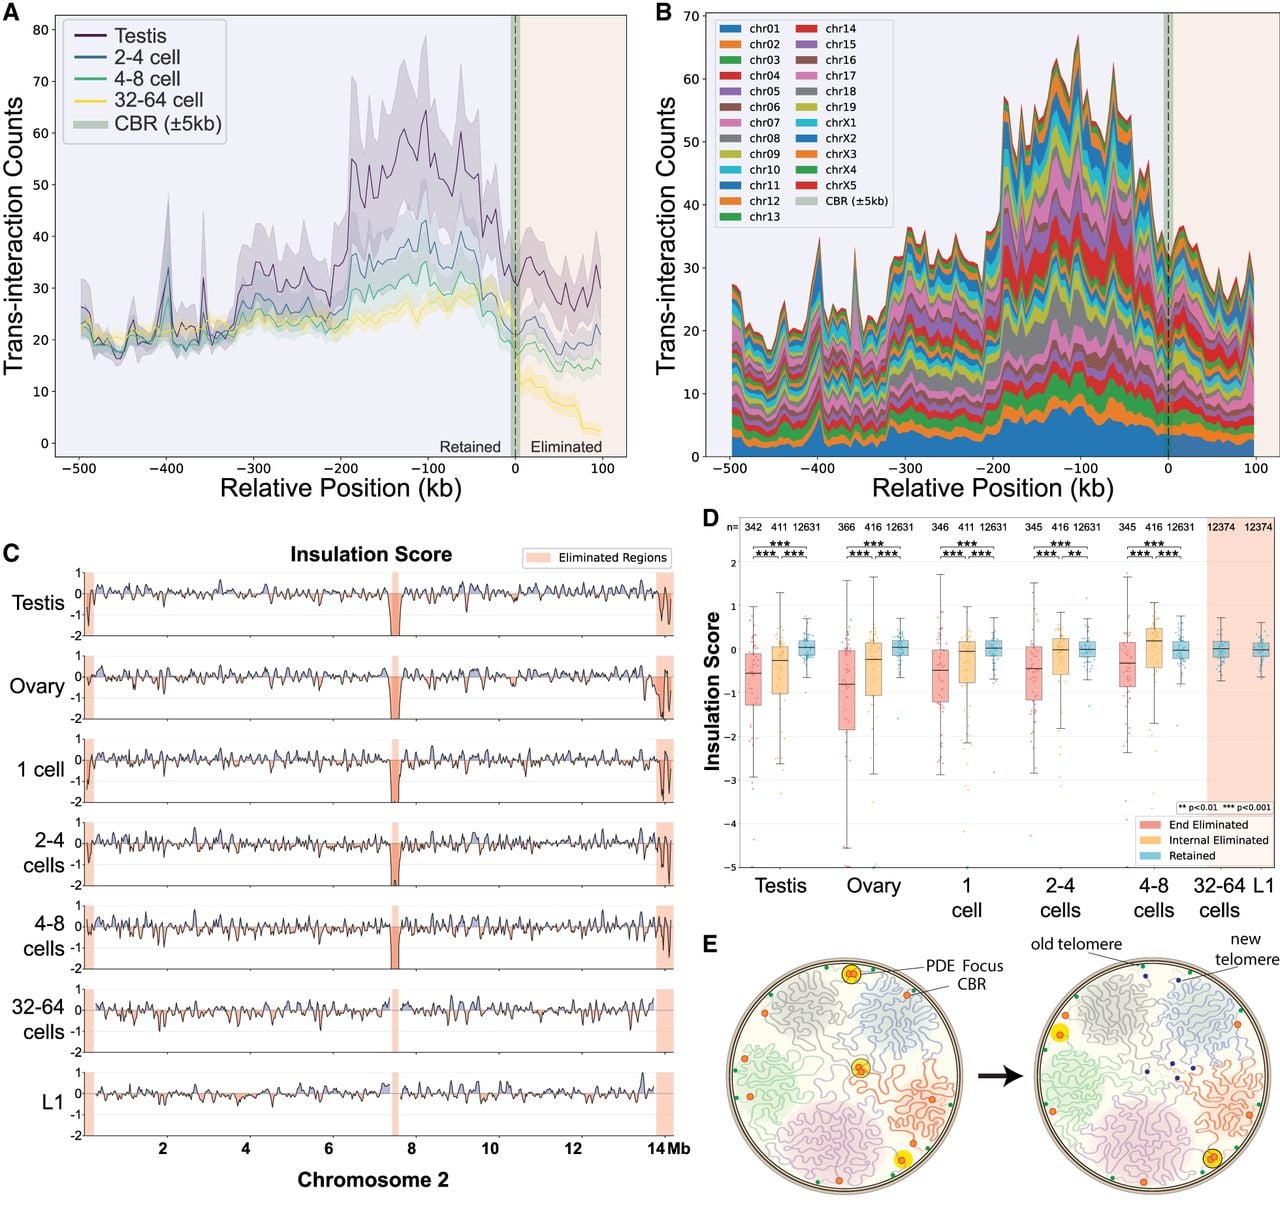
Interactions of CBR-adjacent regions are associated with PDE. (A) CBR-adjacent regions have high interchromosomal interactions. The CBRs are highlighted in green with a vertical dashed line and designated as zero. The 500 kb retained side is to the left (in negative values), and the 100 kb eliminated side is to the right; trans-interaction frequencies surrounding 45 terminal CBRs are shown. Metaprofiles for all analyzed CBRs are displayed as mean (solid lines) ± 1 SEM (shaded areas). (B) All chromosomes contribute to the CBR interactions observed in A. The aggregated CBR trans-interaction for the testis was broken down by contributions from each chromosome (ordered and color-coded). (C) CBR regions are highly insulated in the germline and early embryos through PDE. The insulation score is shown for each developmental stage for Chr 2. Less insulated regions (positive values) are shown in blue; more insulated regions (negative values) are shown in red. Eliminated regions are highlighted in red. (D) The end eliminated regions are highly insulated. The whole genome is broken down by retained (blue), end-eliminated (red), and internal-eliminated (orange) regions. Insulation score values using a 100 kb window size are plotted for each developmental stage in a sliding window size of 5 kb. Post-PDE stages on the right are highlighted in red (note the lack of eliminated DNA data in post-PDE). Data points below −5 are shown as hollow circles. Statistical significance was calculated using a two-sided Mann–Whitney U-test: (***) P < 0.001, (**) P < 0.01. (E) Interaction of CBRs at PDE foci in the nucleus. A 3D genome interaction model based on Hi-C maps. Shown are the dynamic changes of the CBRs (red circles) in five chromosomes (five colored threads in their chromosome territories). PDE foci are shown in big yellow circles. Germline (old; green) and somatic (new; blue) telomeres are illustrated. Depicted are two CBRs interacting within a PDE focus (left, top), in which a programmed DSB occurred. After DSB formation, new telomeres are added to the retained DNA, which then dissociates from the PDE foci (right, top). A newly formed CBR interaction is also shown (right, bottom). Meanwhile, internal CBRs interact among themselves apart from terminal CBRs, leading to drastic karyotype changes after elimination.