
Abstract
Mitochondrial sequences have integrated into the nuclear genome since the origin of eukaryotes. Recent insertions that retain homology with extant mitochondrial DNA (mtDNA), termed NUMTs, confound mtDNA sequence analysis. Here, we use great ape telomere-to-telomere (T2T) genomes to study NUMTs in bonobo, chimpanzee, human, gorilla, and Bornean and Sumatran orangutans. A phylogeny based on shared and lineage-specific NUMTs accurately recapitulates the great ape species tree topology. NUMTs are enriched at nonfunctional nonrepetitive regions of the nuclear genome and depleted within enhancers and coding sequences, suggesting negative selection. We validate the presence of a 76-kb-long heterozygous NUMT in chimpanzee, which is larger than any other NUMT observed in great apes, and find that dozens of NUMTs on the Pan Y Chromosome expanded together with palindromes. Finally, by analyzing intra-specific variation, we confirm that the vast majority of species-specific NUMTs identified in T2T assemblies are fixed or present at high frequencies in each species. Our study highlights NUMTs as a dynamic evolutionary force contributing to shaping ape genomes and is valuable for characterizing mtDNA in great apes.
The nuclear genome has been bombarded with sequences from mitochondria presumably since the origin of the eukaryotic cell. Over evolutionary time, some mitochondrial DNA (mtDNA) fragments integrated into the nuclear genome. As the nucleus depended on mitochondria for energy production and other metabolic pathways, the ability to encode mitochondrial proteins in the nucleus permitted tight regulation of mitochondrial processes. A large fraction of genes in mtDNA moved to the nucleus, an ongoing process that started around 1200 million years ago (MYA) (Sagan 1967). More recent mtDNA integrations in the nuclear genome form nuclear sequences of mitochondrial origin, or NUMTs (i.e., “new-mights”) (Lopez et al. 1994), which have a high sequence identity to mtDNA (Tsuzuki et al. 1983). Over time, mitochondria became dependent on the nucleus to code for proteins essential to oxidative phosphorylation, replication, and transcription (Sloan et al. 2015). Currently, mtDNA harbors just more than 30 genes in mammals and most other animals (Saccone et al. 2002; Lavrov and Pett 2016).
Depending on their integration time, NUMTs can be shared by closely related species and contribute to genetic variation between and within them (Wei et al. 2022). NUMTs are ubiquitous and have been previously annotated in human (Mishmar et al. 2004; Dayama et al. 2014; Tao et al. 2023), macaque (Calabrese et al. 2012), chimpanzee (Hazkani-Covo and Graur 2007; Jensen-Seaman et al. 2009), gorilla, and bonobo (Dayama et al. 2020), as well as other mammals (Uvizl et al. 2024), plants, fungi, and protists (for review, see Hazkani-Covo et al. 2010). Consistent with a high tolerance of excess sequence in plants, their NUMTs are abundant and can reach hundreds of kilobases in length (Stupar et al. 2001). In contrast, NUMTs in honey bees are relatively short (≤863 bp) as a result of fragmented mtDNA integration (Behura 2007). Human NUMT insertions range from <100 bp (Behura 2007) to the size of a full mtDNA copy (∼16.5 kb in human and other apes) (Spuhler 1988) and can have a high sequence identity to mtDNA (>99%). NUMTs have been found to integrate nonrandomly into the nuclear genome of mammals, preferring transposon-rich and intergenic regions (Uvizl et al. 2024). Additionally, certain parts of mtDNA are more prone to integration into the nuclear genome as NUMTs (Calabrese et al. 2017). Note that most of the previous studies analyzed unfinished genome assemblies and thus provided incomplete NUMT annotations.
To insert into the nuclear genome, NUMTs rely on faulty repair mechanisms (e.g., nonhomologous end joining) at the sites of double-strand breaks (Hazkani-Covo and Covo 2008). An increased frequency of double-strand breaks at the nuclear or mitochondrial genome (e.g., because of induced stress) facilitates NUMT integration (Wu et al. 2024). Recent work in insects suggests that some NUMTs may also integrate into the nuclear genome following reverse transcription (Liu et al. 2024). NUMTs may expand into multiple copies, but they do not encode the machinery to do so alone. This limitation may be overcome by utilizing the mobility of neighboring transposable elements (TEs). TEs are DNA sequences that have the potential to move within the host genome. TEs can be separated into two major classes based on their mobilization intermediate, via replicative (“copy and paste”) or nonreplicative transposition (“cut and paste”) (Finnegan 1989). Long interspersed nuclear elements (LINEs) encode a reverse transcriptase to transpose in the genome, which is also used by their nonautonomous counterparts, short interspersed nuclear elements (SINEs) (Bourque et al. 2018). NUMTs could leverage the LINE-encoded reverse transcriptase in a similar way to SINEs. Nonreplicative TEs, or DNA transposons, may carry NUMTs when they move across the genome. Therefore, both TEs and NUMTs are expected to be enriched at regions of genomic instability. Alternatively, NUMTs might be passengers of other common large-scale genome rearrangements and expansions (Balachandran et al. 2022). However, the exact mechanisms of NUMT insertion and expansion have not been fully elucidated.
In some eukaryotes, NUMTs influence nuclear replication and transcription by acting as cis-regulatory elements, as observed in Toxoplasma with its high rates of NUMT insertions (Namasivayam et al. 2023) and in yeast (Chatre and Ricchetti 2011). However, NUMT insertions more often disrupt functional regions. In particular, pericentromeric and telomeric regions are prone to NUMT insertions, leading to interrupted centromere activity, aneuploidy, and cellular senescence (Puertas and González-Sánchez 2020; González-Sánchez et al. 2022). NUMT accumulation in brain tissue (Zhou et al. 2024) and cancerous cells (Ju et al. 2015; Srinivasainagendra et al. 2017) has also been linked to early mortality in humans, possibly a remnant of DNA stress.
NUMTs confound mtDNA sequence analysis, whereby NUMT reads align to the mtDNA assembly and are observed as erroneous variation in the mtDNA genome (Laricchia et al. 2022). Resequencing experiments that rely on short reads are especially susceptible to this issue (Maude et al. 2019; Prokopov et al. 2023; Fleischmann et al. 2024). The improved contiguity of nuclear assemblies generated with long reads helps resolve longer NUMTs and provides a more reliable catalog of NUMTs (Yoo et al. 2025).
Recently, the telomere-to-telomere (T2T) genome assemblies for human and other great apes were released (Nurk et al. 2022; Rhie et al. 2023; Makova et al. 2024; Yoo et al. 2025). This provided us with a unique opportunity to obtain a complete view of NUMTs across the great apes—bonobo (Pan paniscus), chimpanzee (Pan troglodytes), human (Homo sapiens), gorilla (Gorilla gorilla), Bornean orangutan (Pongo pygmaeus), and Sumatran orangutan (Pongo abelii)—with different divergence times. The divergence time is estimated to be ∼2.5 million years (MY) between bonobo and chimpanzee (Pan genus), ∼7 MY between human and Pan genus, ∼9 MY between gorilla and Hominini (human, bonobo, and chimpanzee), ∼1 MY between Bornean and Sumatran orangutans (Pongo genus), and ∼17 MYA between Pongo genus and the other great apes, Homininae (human, bonobo, chimpanzee, and gorilla) (see Makova et al. 2024 and references therein).
Here, we used these T2T assemblies to study the integration and expansion dynamics of NUMTs in great ape genomes. We annotated NUMTs in T2T ape genomes and conducted their comparative analysis. We detailed the distribution of NUMTs across the T2T genome for each species and generated a great ape phylogeny based on shared and lineage-specific NUMTs. Then, we tested the contribution of flanking sequence composition to NUMT insertion preferences. Finally, we highlighted examples of NUMTs with intriguing mechanisms of expansion. Our results provide a valuable resource for future studies utilizing ape T2T assemblies, such as the potential functional impact of NUMTs on gene regulation and genome evolution in humans and great apes.
Results
NUMTs in ape T2T genomes
We annotated NUMTs in six great ape assemblies with available T2T genomes (Yoo et al. 2025). NUMTs were identified separately for each species by a pairwise alignment of mtDNA to the nuclear genome (see Methods) (Supplemental Data 1). We provide a detailed description of NUMTs in the primary haploid assembly and analyze alternate haplotypes when possible (not available for the human CHM13 genome). The NUMTs we detected were at least 30 bp (see Methods) and up to 16.5 kb (a full-length mitochondrial genome) long, except for one 76 kb NUMT on the chimpanzee chromosome homologous to human Chromosome 6 (HSA6; here and below we use human chromosome numbering for both human and other species based on homology, i.e., HSA, unless specified otherwise). We detected 713 NUMTs in bonobo, 717 in chimpanzee, 648 in gorilla, 714 in Bornean orangutan, and 715 in Sumatran orangutan for the primary haplotype. Similar numbers of NUMTs were detected for the alternate haplotype (702, 723, 656, 721, and 729, respectively). We detected 711 NUMTs in the human haplotype we studied. The CHM13 human reference genome is haploid and thus does not have an alternate haplotype (Supplemental Table S1).
We found that NUMTs varied greatly in length within each species but overall were skewed toward smaller events across apes (Fig. 1A), with median lengths ranging from 265 to 299 bp. Most NUMTs with high sequence identity to mtDNA (>99%) were short (<200 bp), suggesting a bias for recent, short NUMT insertions, potentially confounded by the higher sensitivity to detect shorter insertions (Supplemental Fig. S1). Short NUMTs with low identity to mtDNA could also be fragments of long, older NUMTs. Analyzing the primary haplotype for each chromosome for each species, we observed a particularly high number of NUMTs on Chr 2b for Hominini, Chr 17 for Pongo, Chr 22 for human, and Chr Y for Pan (Fig. 1B), likely owing to lineage-specific expansions.
NUMT content across homologous great ape chromosomes in primary haplotype assemblies. Chromosomes were labeled based on their human homolog numbers (HSA). (A) Length distribution of NUMT per species. (B) The number of NUMTs per chromosome per species. (C) NUMT kilobases per chromosome per species (NUMT content). (D) Number of NUMTs per base pair for each chromosome and species. (E) The fraction of bases annotated as NUMTs among all bases for each chromosome and species. Human Chromosome 2 was divided at the site of an ancient fusion (∼114 Mb), and each arm was assigned to their homologs HSA2a and HSA2b in great apes. The gorilla chromosomes homologous to HSA5 and HSA17 exchanged genetic material and resulted in two combinations referred to as Chr 17x5 and Chr 5x17. They were considered separately from Chr 5 and Chr 17 in this analysis. NUMT content for the alternate haplotype assemblies is included in Supplemental Figure S2.
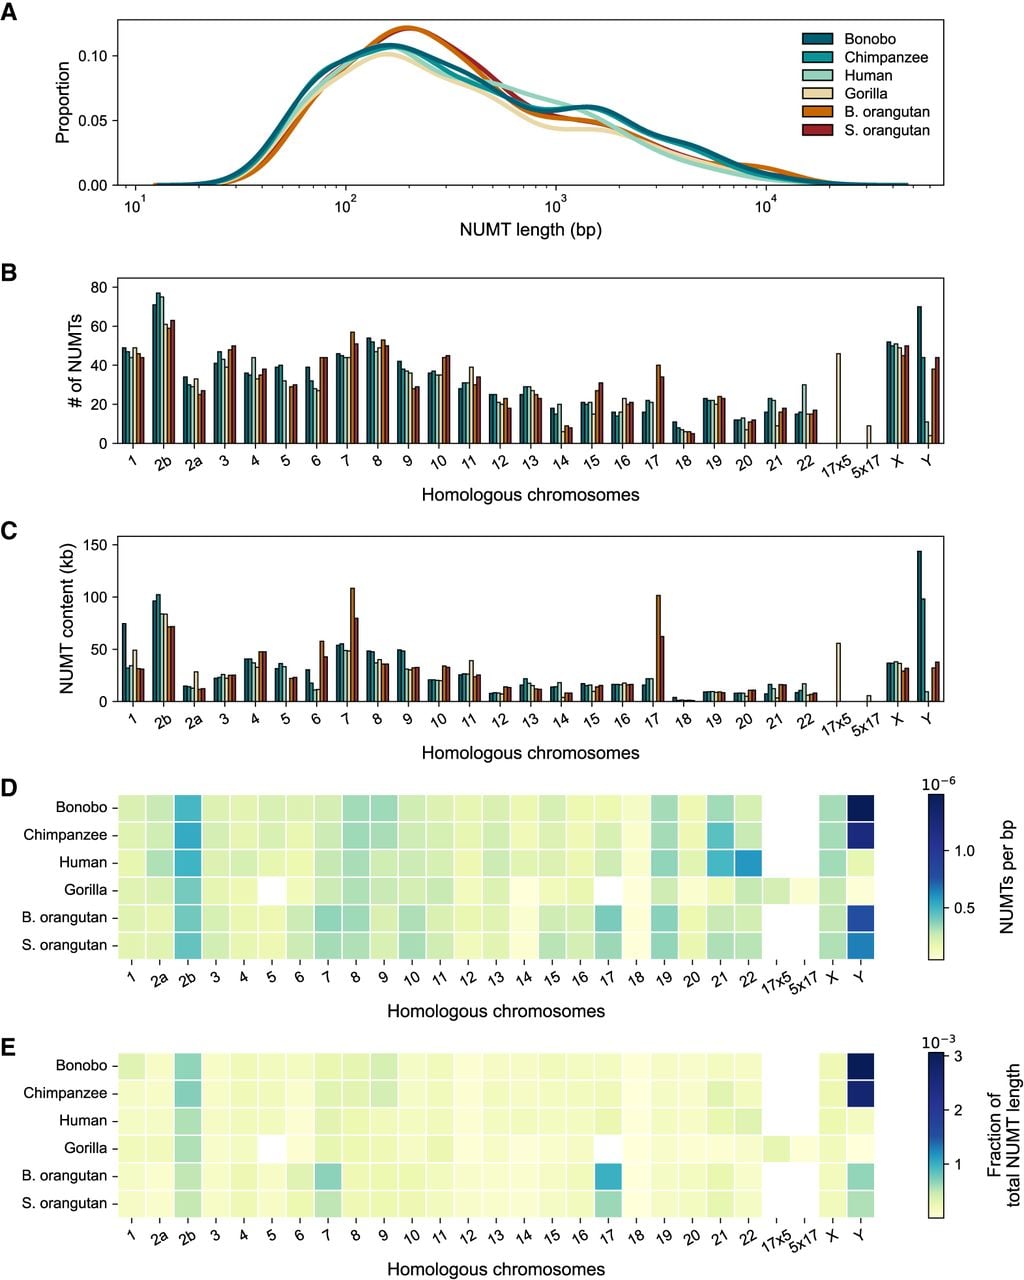
The total base pairs encompassed by NUMTs (NUMT content; Fig. 1C) supported the trends observed for NUMT counts (Fig. 1B). For instance, Chr Y in Pan had an approximately threefold higher NUMT content (Fig. 1C) and density (Fig. 1D) than most other chromosomes. Chr Y also contributed the highest fraction of NUMT content for most great apes (Fig. 1E), except for human and gorilla. Chr 1 for bonobo, Chr 7 and 17 for Pongo, and Chr Y for Pan showed a 20–100 kb higher NUMT content than homologous chromosomes in other species (Fig. 2C).
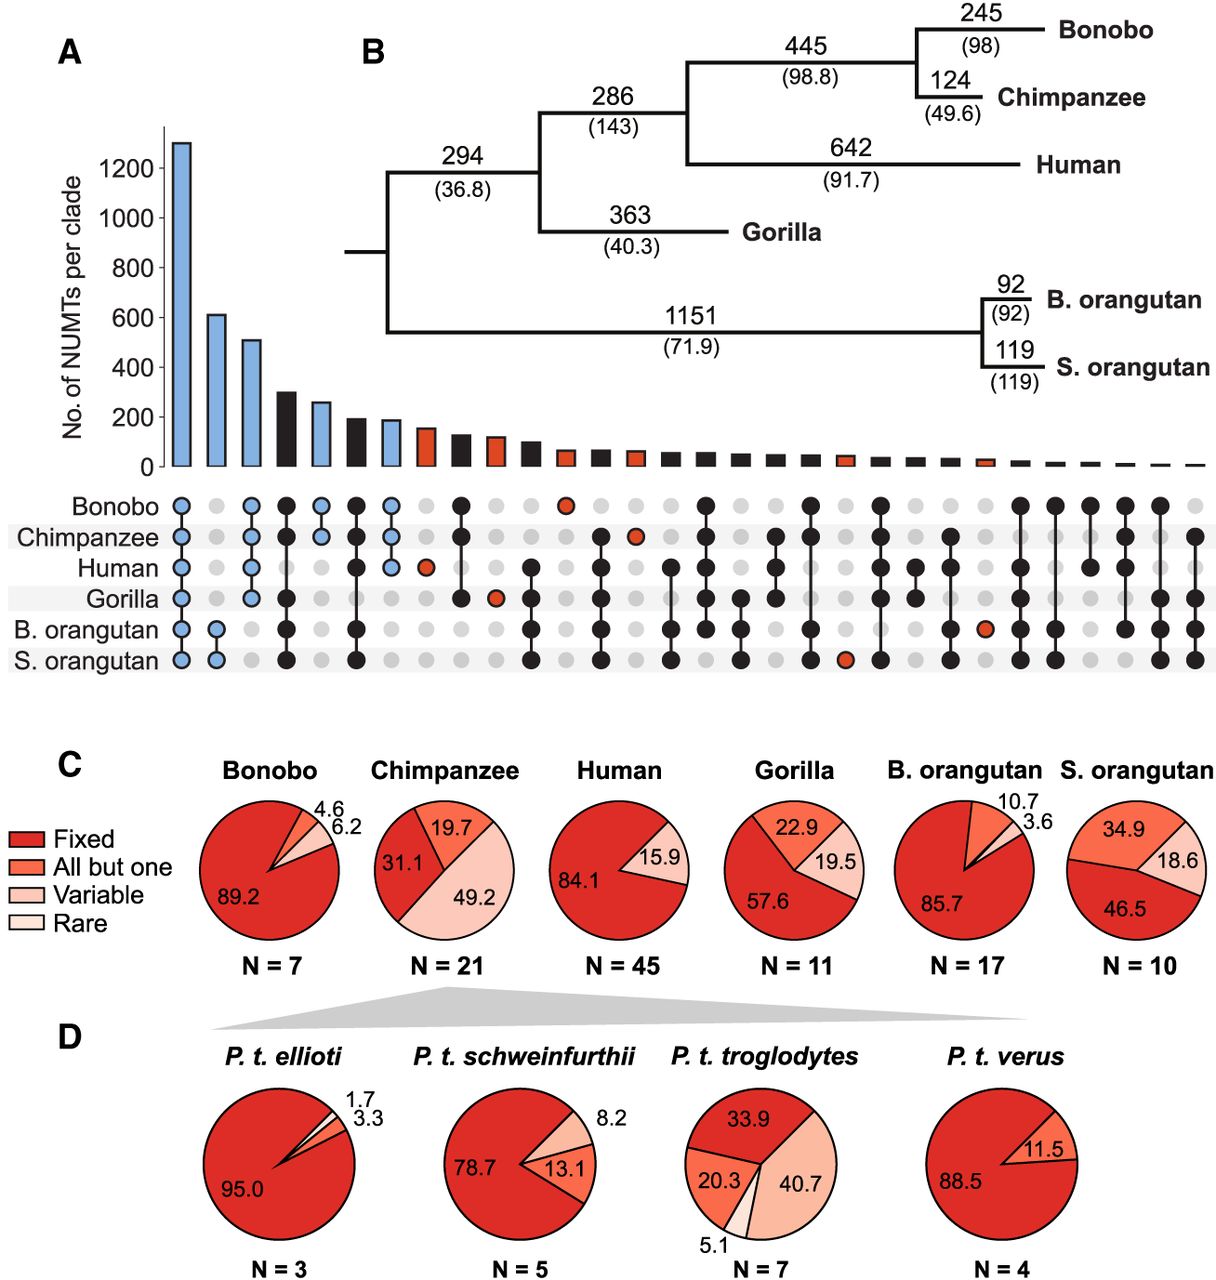
Shared and lineage-specific NUMTs in the primary haplotype, as well as species-specific NUMTs across populations. (A) Upset plot of shared and lineage-specific NUMT insertions (for details, see text and Methods). The 30 most abundant clades are plotted, with species-specific NUMTs in red and those forming natural clades in blue. For the complete set of clades, see Supplemental Figure S4. (B) Maximum parsimony tree of shared and lineage-specific NUMTs. Branches are annotated with the number of branch-specific NUMTs. The rate of NUMT accumulation, NUMTs per MY, is given in parentheses. For a detailed list of which NUMTs are shared, see Supplemental Data 2. (C) The proportions of species-specific NUMTs classified as fixed, shared by all but one individual, variable, or present in a single individual (rare) within populations of nonreference samples, are indicated as percentages. The number of individuals per species (N) is included below each chart. (D) Polymorphism analysis of chimpanzee-specific NUMTs conducted separately for each chimpanzee subspecies. Colors are as in C.
The alternate assembly showed similar trends to those observed for the primary assembly (Supplemental Fig. S2). However, when considering both haplotypes for Pongo (Fig. 1; Supplemental Fig. S1), we noted that differences in NUMT content among orangutan species on Chr 7 and Chr 17 were caused by interhaplotype variation (Fig. 1; Supplemental Fig. S3). In addition, the alternate haplotype for Chr 6 in the chimpanzee had a notably higher NUMT content (Supplemental Fig. S2) compared with the primary haplotype (Fig. 1C), explained by a single 76 kb NUMT in the alternate haplotype.
NUMTs encompassed all parts of mtDNA (Supplemental Fig. S3), including protein-coding genes, tRNA, ribosomal RNA, and the D-loop. However, the D-loop was less frequent than the rest of mtDNA for all species and haplotypes (Supplemental Table S2), perhaps reflecting that the D-loop evolves more rapidly and would therefore be detected at lower levels when aligned to extant mtDNA. Another possibility is that a fraction of NUMTs inserts into the nuclear genome via mtDNA transcripts and would therefore exclude the D-loop, which is a regulatory region.
Shared and lineage-specific NUMTs
To identify shared NUMTs across great apes, we aligned NUMT flanks for each species to all genome assemblies using BLAT (Kent 2002). Then we compared the k-mer distributions of the query NUMT and the BLAT match, following a method similar to that described by Yoo et al. (2025) (see Methods). Natural clades, those that match the species tree topology, were observed most commonly, with 1300 NUMTs shared by all great apes, 610 between the two Pongo species, 508 among Homininae, 186 among Hominini, and 258 between the two Pan species (Fig. 2A). Species-specific NUMTs were common in human (N = 153) and gorilla (N = 118), followed by bonobo (N = 65) and chimpanzee (N = 62), with the lowest numbers in the orangutan species (N = 43 in Sumatran orangutan and N = 28 in Bornean orangutan), consistent with their recent divergence from each other. We also observed many clades with a suspected loss of NUMTs in a single species. For instance, many NUMTs were shared across great apes but were absent in either human (N = 297) or gorilla (N = 191), suggesting deletions. There were also some clades that require at least two events (i.e., multiple NUMT-containing sequence deletions) to explain them (e.g., NUMTs present in African great apes but not in humans or orangutans) or that may be owing to incomplete lineage sorting (Supplemental Fig. S4).
Phylogenetic analysis
Using maximum parsimony, we built a phylogenetic tree based on NUMT presence/absence at orthologous locations (Fig. 2B). Because of using sequence alignment, we are limited to more recent NUMT insertions and likely underestimate the accumulation of more ancient insertions. This tree matched the topology of the expected species tree (Makova et al. 2024; Yoo et al. 2025). We computed the rate of NUMT accumulation per species using the tree branch lengths divided by divergence time (divergence times were from Makova et al. 2024). Gorilla had the lowest rate of NUMT accumulation (40.3 NUMTs per MY), followed by chimpanzee (49.6 NUMTs per MY), with higher accumulation rates in human (91.7 NUMTs per MY), bonobo (98 NUMTs per MY), and Pongo genera (92 and 119 NUMTs per MY) (Fig. 2B). Overall, clades that excluded gorilla displayed higher accumulation rates. For example, the Hominini accumulation rate was higher than that of Homininae.
Polymorphic NUMTs
To address potential polymorphism of NUMT presence/absence within species, we conducted additional analyses. First, we utilized 45 near-T2T assemblies from the Human Pangenome Reference Consortium (HPRC; version 1) (Liao et al. 2023), representing multiple human populations around the world. We leveraged the multiple-sequence alignments of the 45 HPRC assemblies, which used the human T2T CHM13 as the reference, to characterize the presence or absence of NUMTs (for details, see Methods). We also utilized resequencing data sets from 66 nonhuman great apes available in the NCBI Sequence Read Archive (SRA; https://www.ncbi.nlm.nih.gov/sra), including seven bonobo, 21 chimpanzee, 11 gorilla, 17 Bornean orangutan, and 10 Sumatran orangutan samples. We mapped these sequencing reads to the entire reference T2T assembly for the corresponding species and then retained reads mapping to NUMT loci present in the assembly, including flanking regions (for details, see Methods). Depending on the results for these alignments or mappings, we then categorized NUMTs into “fixed” or “polymorphic” in their presence/absence within species and subdivided polymorphic NUMTs into “shared by all but one” individual, “variable,” and “rare” (present in a single individual) (Fig. 2C). For most of the species analyzed, the majority of species-specific NUMTs were fixed or shared by all but one individual for each species (80.5% to 96.4% of NUMTs) (Fig. 2C), except for chimpanzee in which these categories totaled 50.8%. Despite the higher-quality data set used, human NUMTs followed the same pattern as the other species, with 84.1% fixed and 15.9% variable NUMTs. Chimpanzee had the lowest proportion of fixed or shared by all but one individual NUMTs, 50.8%. To determine whether this was because of subspecies differences, we analyzed them separately. The subspecies utilized for the chimpanzee T2T reference assembly, Western chimpanzee or P. troglodytes verus (Makova et al. 2024), showed the expected pattern, with 88.5% fixed, and so did P. troglodytes schweinfurthii (91.8% fixed or shared by all but one) and P. troglodytes ellioti (98.3% fixed or shared by all but one) followed the expected trend of mostly fixed NUMTs. In contrast, only 54.2% of NUMTs in P. troglodytes troglodytes were either fixed or shared by all but one individual (Fig. 2D). This subspecies, also known as central, has the highest SNP heterozygosity among the four (Prado-Martinez et al. 2013), which is consistent with our findings in NUMTs. It is possible that a higher sample size for bonobo and Sumatran orangutan would yield additional variation in NUMT absence/presence. In summary, whereas the majority of species-specific NUMTs analyzed were fixed, there is a substantial fraction of polymorphic NUMTs in our data set.
Additionally, we were interested in NUMTs that were absent from the reference assembly of the focal species but present in the reference assemblies of all the other species analyzed, as several clades pictured in black in Figure 2A follow this trend. Specifically, we asked how often such NUMTs were present in other genomes of the focal species. We could address this question only for the human T2T CHM13 assembly by using the HPRC high-quality assemblies (Liao et al. 2023), which are not currently available for nonhuman great apes. We utilized five HPRC assemblies representing diverse human superpopulations: European (HG002), East Asian (HG00597), admixed American (HG01358), African (HG02572), and South Asian (HG04184). We found that among 297 NUMTs absent from the human reference T2T assembly but present in all other T2T great ape assemblies, 285 (96%) were also absent from the studied subset of human assemblies from HPRC (Supplemental Fig. S5). This suggests that in the vast majority of cases, NUMTs absent from the human reference assembly are also absent from other human genomes, and we expect nonhuman apes to follow this trend.
NUMTs across the genome
To determine whether NUMTs were preferentially present in certain genome regions, we studied NUMT presence among functional, repetitive, and presumably neutrally evolving regions (Fig. 3) in the T2T assemblies. We used the immediate 50 bp flanks upstream of and downstream from NUMTs to determine the region in which they integrated.
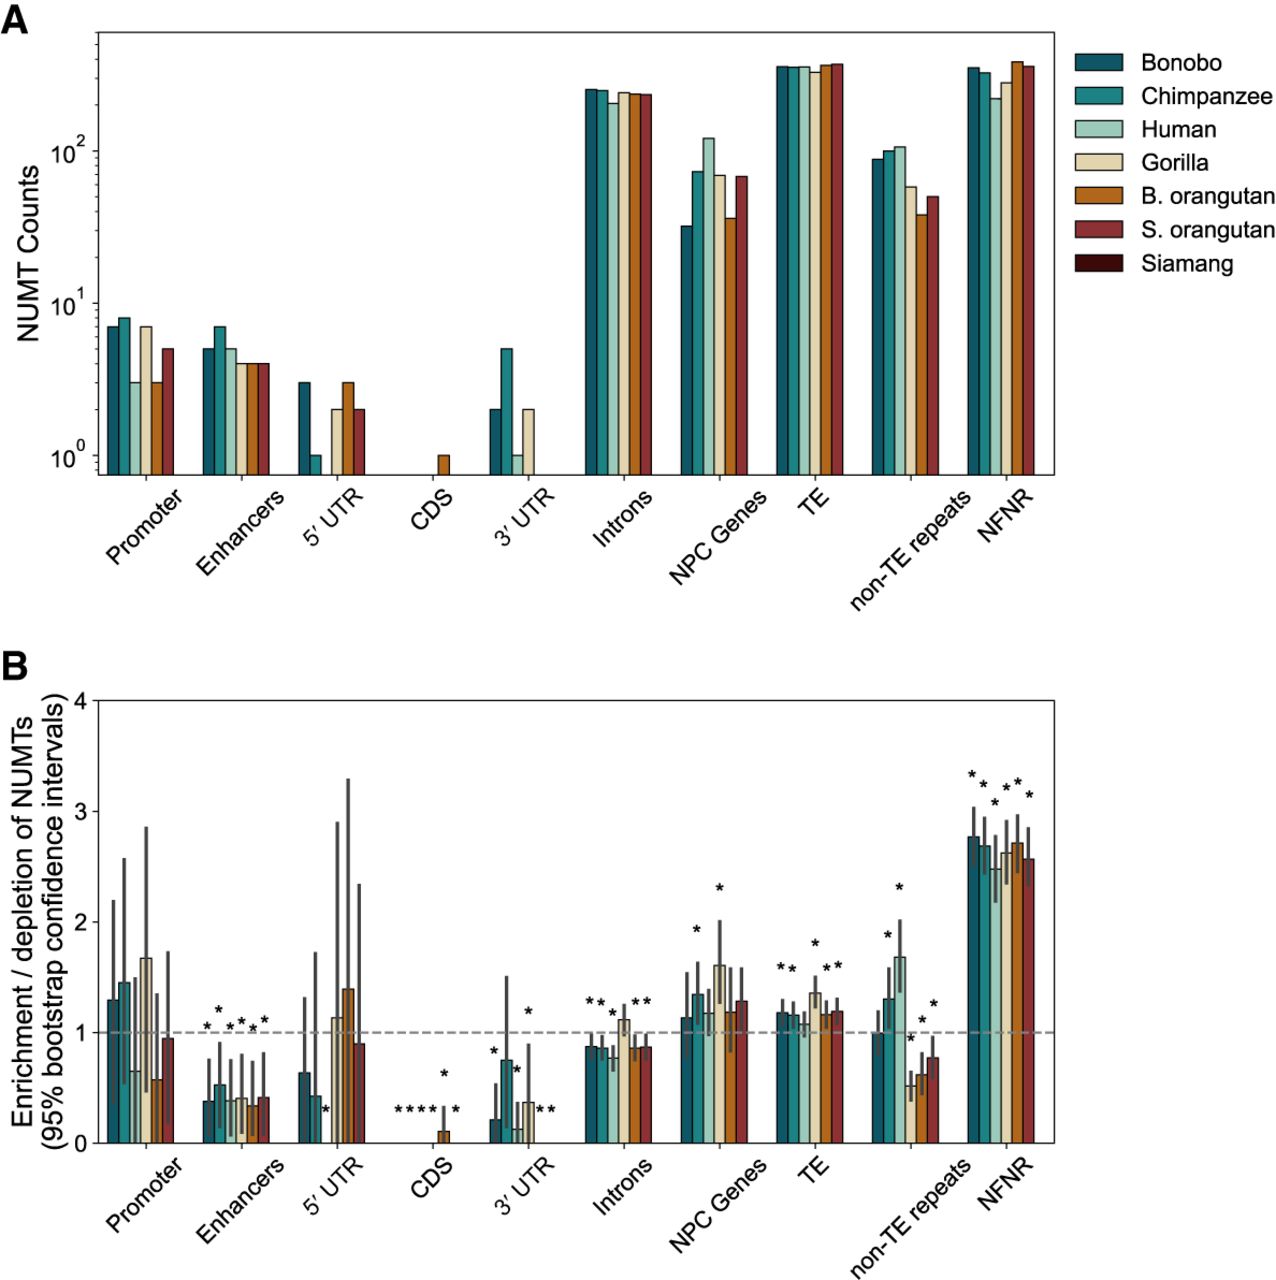
NUMTs at functional, repetitive, and presumably neutrally evolving genome regions. (A,B) The number of NUMTs (A) and enrichment in NUMT counts (B), flanked (50 bp up- or downstream) by each genomic feature. Enrichment scores were computed as the fraction of total NUMTs within the genomic feature divided by the fraction of the genome encompassed by the genomic feature. The horizontal line at one represents the genome-wide average. Values above one indicate enrichment of NUMTs in that feature, whereas values below one indicate depletion of NUMTs. Significant enrichment or depletion was determined by 95% confidence intervals (obtained with bootstrap, 1000 repetitions) that do not overlap one, detailed by a star above the bar. (NPC) Non-protein-coding genes, (NFNR) nonfunctional nonrepetitive regions.
Protein-coding genes
NUMTs in coding sequences (CDSs) and untranslated regions (UTRs) were infrequent across great apes (Fig. 3A). Notably, NUMTs were significantly depleted at 3′ UTRs in all species except chimpanzee (bootstrap 95% confidence intervals <1) (Fig. 3B). CDS regions lacked NUMTs, with the exception of Bornean orangutan, which we suspected was a misannotation of a pseudogene (Fig. 3B). The observed depletion indicates that NUMTs are not tolerated in CDSs, suggesting negative selection (Fig. 3B). A substantial fraction of all NUMTs, ∼25%, were located within introns across all great apes, comprising ∼120–170 kb in each species (Fig. 3A). Yet, NUMTs showed a significant 1.3-fold depletion within the introns of all species except gorilla (Fig. 3B).
Non-protein-coding genes and regulatory regions
Non-protein-coding (NPC) genes also housed NUMTs. For instance, NPC genes were significantly enriched in NUMTs for chimpanzee and gorilla (bootstrap 95% confidence intervals >1) (Fig. 3B). Promoters had NUMT frequencies as expected by chance alone. In contrast, enhancer regions were significantly depleted of NUMTs in all species (Fig. 3B), suggesting negative selection.
TEs and NUMTs
Many NUMTs, 40%–60% depending on the species, were within 100 bp of a TE (Supplemental Fig. S6), corresponding to the high fraction of the genome composed of TEs (Hoyt et al. 2022; Yoo et al. 2025). We observed a modest, yet significant NUMT enrichment at TEs in most species (Fig. 3B), except in humans.
Nonfunctional nonrepetitive regions
A third of all NUMTs were found in nonfunctional nonrepetitive (NFNR) regions of the genome (Fig. 3A), defined by excluding all functional (Mohanty et al. 2025) and RepeatMasker annotations (Smit et al. 2013–2015) for each species. These regions are expected to evolve neutrally. NUMTs for all species were significantly enriched at NFNRs, 2.5- to 2.7-fold in all species (Fig. 3B), which may reflect negative selection against NUMTs at functional regions.
Integration preferences of NUMTs
We used a functional hypothesis testing approach to study potential associations between NUMTs and their sequence context (IWTomics) (Cremona et al. 2018). Briefly, we generated a test set of nonoverlapping 100 kb regions flanking NUMTs (50 kb upstream and 50 kb downstream) and a control set of 100 kb regions in the rest of the genome. The sequences were annotated in 1 kb increments for functional regions (e.g., origins of replication; see Methods), non-B DNA (G-quadruplexes [GQs], Z-DNA, mirror repeats [MRs], A-phased repeats [APR]), CpG islands, and repeat families (e.g., SINEs, LINEs, LTRs, retroposons, low-complexity repeats, etc.). We explored differences between NUMTs and control sets for each annotation in human, which has the origins of replication annotated (Supplemental Fig. S7), and all species (Supplemental Fig. S8). We observed a depletion of satellite sequences and of simple repeats around NUMTs for most species. This reflects a lack of NUMTs at telomeres or centromeric satellite arrays or reflects a limitation in identifying them in such regions. We also observed inconsistent enrichments for LINE, LTR, and low-complexity region categories, which may reflect a bias in NUMTs alongside these TEs or an artifact related to the number of events. We confirmed the enrichment of NFNR regions near NUMTs (Supplemental Fig. S8) for all species.
Colocalization of NUMTs and TEs
NUMTs depend on external mechanisms to integrate and expand within the nuclear genome. TE sites are prone to double-strand breaks (Sen et al. 2006), and thus, NUMTs may insert in or near TEs. We hypothesized that both TEs and NUMTs are more likely to insert in regions of high genome instability and thus should co-occur. To test whether NUMTs and TEs colocalize at a large genomic scale, we computed NUMT and TE densities along the genome using two different window sizes (0.1 Mb and 1 Mb) (Supplemental Fig. S9). We found that there is a modest negative correlation between TE density and the log of NUMT density in most comparisons (significant in nine out of 11 comparisons, one comparison showed a significant positive correlation, Pearson's correlation test) (Supplemental Fig. S9), not supporting our hypothesis.
A large, recent, and heterozygous NUMT insertion in chimpanzee
We identified a 76 kb NUMT array in the alternative haplotype of chimpanzee Chr 5, homologous to HSA6, ∼500 kb from the centromere on the p arm (Chr5_hap2_hsa6: 62,935,923–63,012,517p) (Fig. 4A). This is the only NUMT in our data set longer than the total linear length of chimpanzee mtDNA (16.5 kb). This NUMT comprises multiple mtDNA copies repeated in tandem and noncontiguously (Fig. 4B). Multiple (a total of three) tandem copies likely originated because of repeated expansion events, and/or rolling circle amplification of an mtDNA molecule (Lewis et al. 2015). The alignable portions of the copies of mtDNA in this NUMT are identical in sequence, indicating this complex NUMT was formed within a relatively short period or has undergone gene conversion across the array. Each mtDNA unit within this NUMT has a >99.23% sequence identity to mtDNA. Assuming a mutation rate of 10−7 per site per year in mtDNA (Arbeithuber et al. 2025) and 10−8 per site per year in the nuclear genome (Cagan et al. 2022), we estimate that this NUMT inserted ∼40,000–400,000 years ago.
An unusually large, 76 kb NUMT was identified in a chimpanzee assembly. (A) Structure of a 76 kb NUMT in the alternate haplotype of chimpanzee Chr 5 (HSA6), consisting of about 4.5 copies of mtDNA, visualized in the Integrative Genome Viewer (IGV) (Thorvaldsdóttir et al. 2013) and modified for clarity. The NUMT was annotated by their homologous coordinates (and strand direction) in mtDNA. Note that full copies homologous to mtDNA start and end at the same coordinate owing to the circularity of the genome. These copies were grouped by color to demonstrate contiguity compared with the circular mtDNA genome and differ in color to demonstrate when NUMT copies were not contiguous (e.g., copies colored in red span multiple full mtDNA copies and are contiguous to each other in homology with mtDNA). Each copy was >99% identical in sequence to chimpanzee mtDNA, and overlapping sequences within the NUMT array showed no divergence. (B) Schematic of NUMT copies and their breakpoints with respect to their homology with chimpanzee mtDNA. The colors correspond to those in A. (C) FISH validation of polymorphic NUMT on T2T mPanTro3 chimpanzee Chr 5 (HSA6). Merged image obtained by overlapping Cy3 fluorochrome signals and DAPI staining. Green arrows indicate the Chr 5 (HSA6) homologs. Note that both sister chromatids have a pericentromeric hybridization signal in just one of the two homologous chromosomes. PCR amplicons of the NUMT array are included in Supplemental Figure S11, with the primers detailed in Supplemental Table S3. FISH results for an unrelated chimpanzee and a human are included in Supplemental Figure S12.
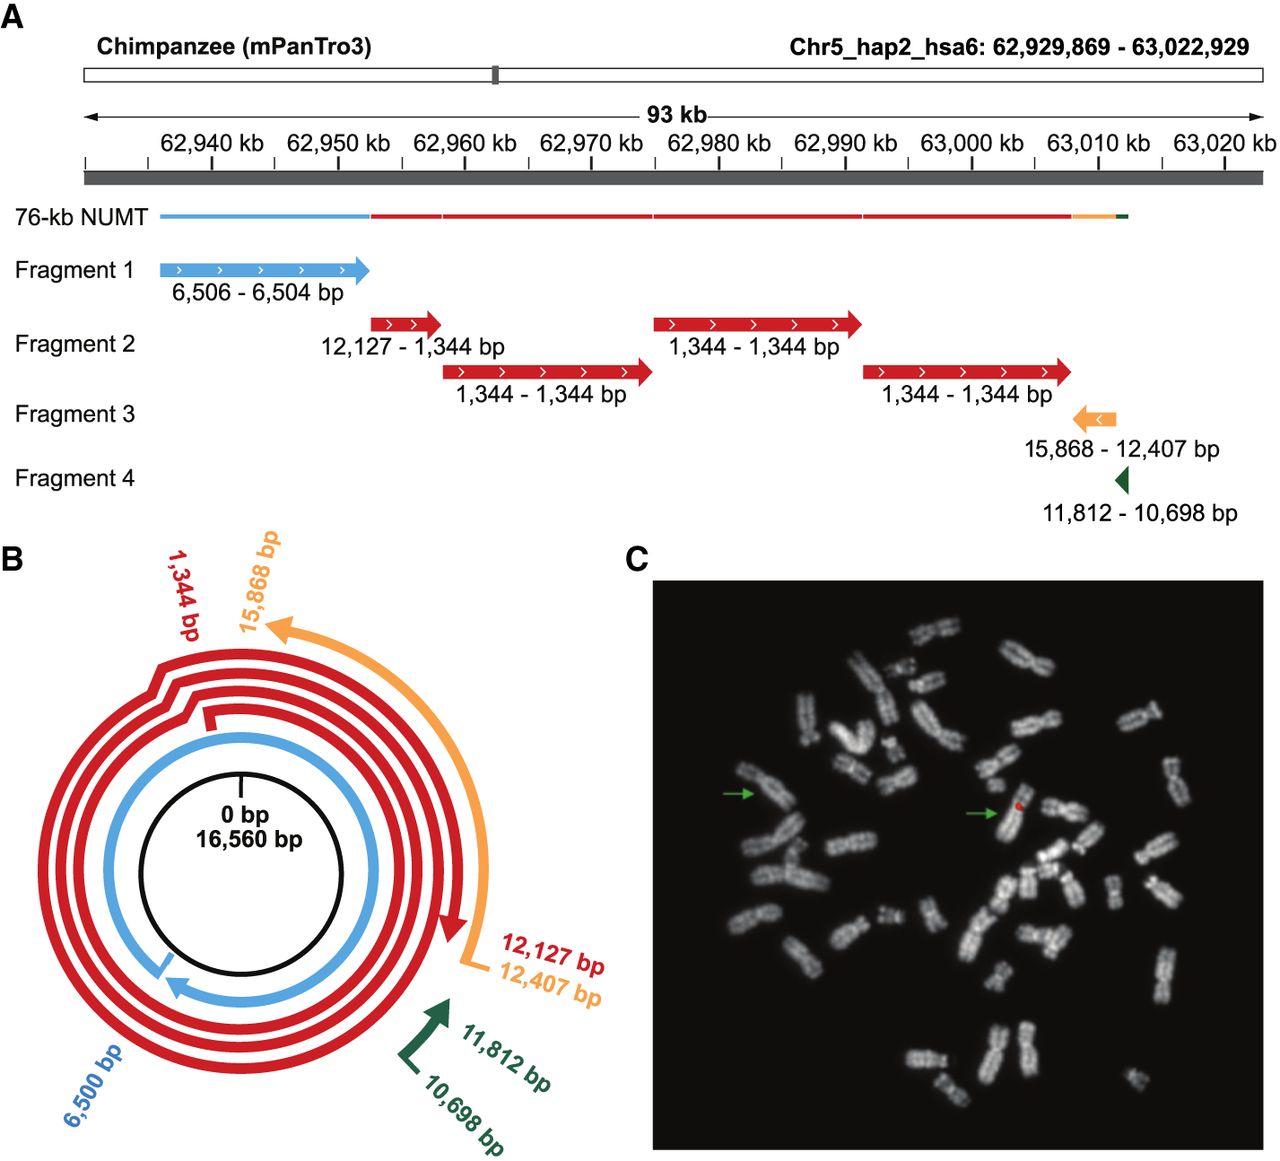
We found support for this NUMT array from multiple Oxford Nanopore Technology (ONT) long sequencing reads that span the 76 kb region and from Pacific Biosciences (PacBio) HiFi reads that refine, although do not span, the consensus sequence (Supplemental Fig. S10). The region was flagged during assembly validation (Yoo et al. 2025) likely because of many reads that align ambiguously to the NUMT region (Supplemental Fig. S10B,C).
To further validate the presence of this large NUMT, we synthesized fluorescence in situ hybridization (FISH) probes using long-fragment PCR (Supplemental Fig. S11) to cover most of the 76 kb region. These probes hybridized with a strong signal to one of the two Chr 5 (HSA6) in the AG18354 cell line (the original chimpanzee cell line for which the T2T genome was sequenced) (Fig. 4C) but not to the second homologous Chr 5 (HSA6) in this same sample, confirming that it is present in only one haplotype. Furthermore, the probes did not hybridize with a strong signal to an unrelated chimpanzee individual or a human sample (Supplemental Fig. S11).
NUMT expansion at Pan Y Chromosome palindromes
The Y Chromosome varies greatly in size and composition between great apes owing to its rapid evolution (Makova et al. 2024). In apes, these chromosomes comprise ancestral, pseudoautosomal, satellite, and ampliconic regions (including palindromes), as well as a human-specific X-transposed region (Makova et al. 2024). We found NUMTs to be absent from ancestral regions and, in general, rare outside ampliconic regions on Chr Y but to be abundant at Y ampliconic regions across all great apes (Fig. 5A). However, only the Pan genus contained NUMTs within palindromes. This genus displayed an approximately 100-fold NUMT enrichment at palindromes compared with nonpalindromic ampliconic regions (Fig. 5A). These NUMTs were present as paired inverted repeats within palindromes (Fig. 5B). They followed a pattern of rapid expansion and gene conversion both within and between palindromes, as evidenced by the high identity of NUMTs, particularly between arms of the same palindrome but also between palindromes (Supplemental Table S4). The palindrome expansions were evident from self–self global alignments of bonobo and chimpanzee Y Chromosomes (Fig. 2 in the work of Makova et al. 2024).
NUMTs in Pan Y Chromosome palindromes. (A) The prevalence of NUMTs per Y Chromosome sequence classification. A detailed list of these NUMTs can be found in Supplemental Table S5. (B) Schematic of palindrome structure with NUMTs on each arm. (C,D) IGV plot of Pan genus lineage-specific expansion of NUMTs in palindromic regions of the Y Chromosome, displayed for bonobo (C) and chimpanzee (D). These are ∼7 kb NUMTs distributed as pairs along each palindromic arm. Palindromes were annotated with a Q and a number, with each palindrome arm denoted as A and B according to the method of Makova et al. (2024). Not all palindromes are labeled in these plots, as some overlap. (E) An unscaled maximum parsimony tree of palindromic NUMT sequences in bonobo and chimpanzee. We utilized bonobo and chimpanzee mtDNA as outgroups. Branches contain bootstrap values. Branches with <50% support were collapsed. The suffix (+) indicates the NUMT follows the 5′ to 3′ direction, whereas (−) indicates the NUMT follows the 3′ to 5′ direction.
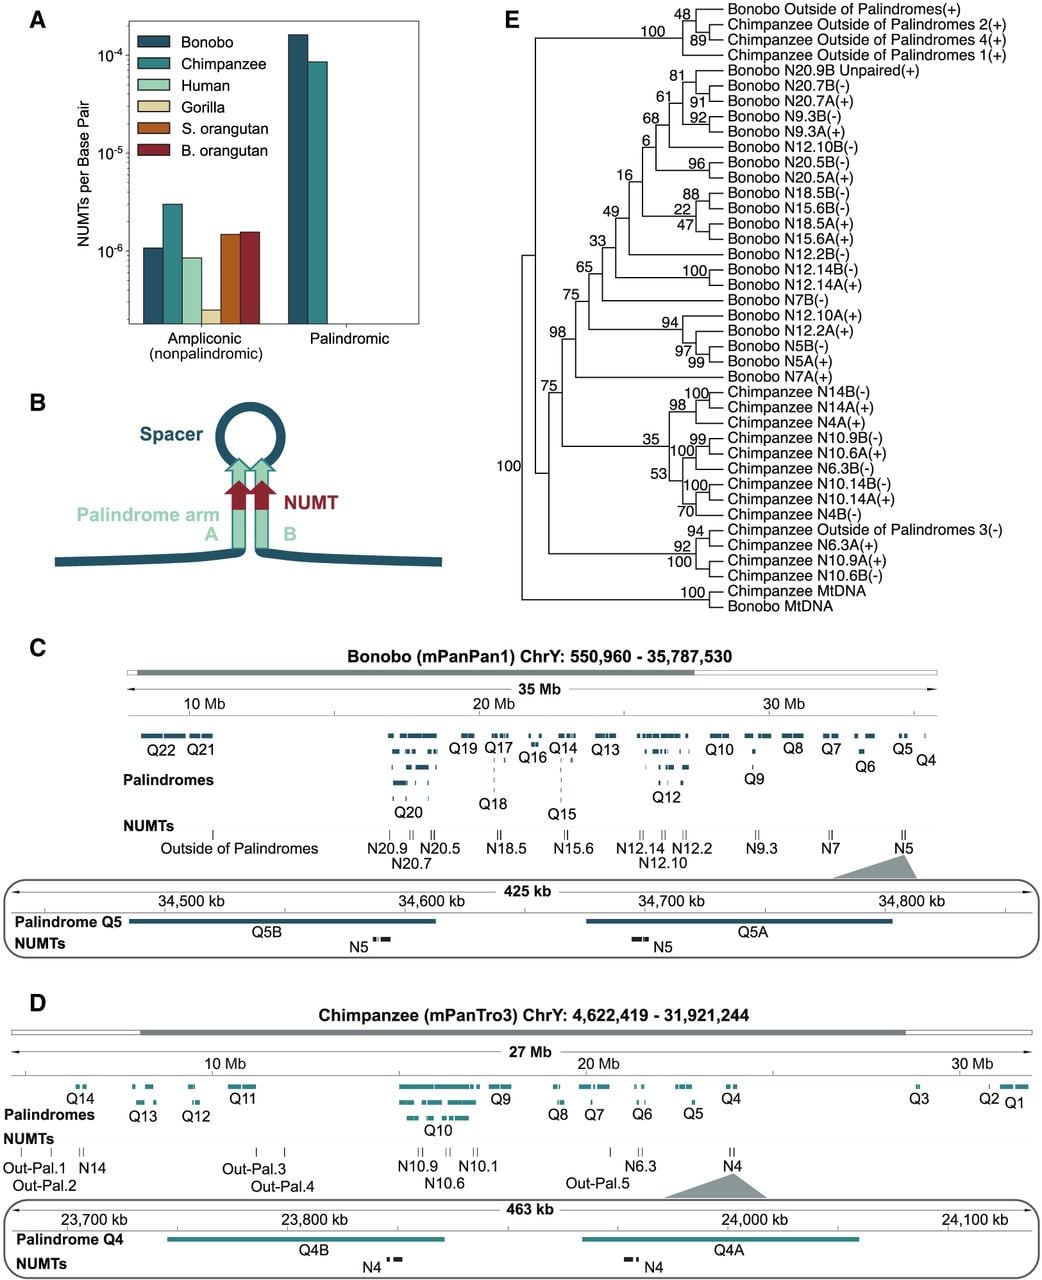
In bonobo, each NUMT copy in an inverted pair consisted of three regions of sequence identity to mtDNA separated by spacers (homologous to the contiguous positions 13,703–15,438 bp, 15,823–16,054 bp, and 1–4348 bp in bonobo mtDNA) but overall spanning 7.4 kb (Supplemental Table S5). Each bonobo NUMT had 69%–76% sequence identity to bonobo mtDNA, indicating that these are not recent insertions (Supplemental Table S4), although the positions with homology with mtDNA suggest a single insertion event within a palindrome arm. For each NUMT pair, one NUMT copy had an inverted NUMT copy on the opposite arm of the same palindrome, separated by ∼100 kb (Fig. 5C). These NUMT pairs were observed 11 times in bonobo (located in the palindrome region spanning Y Chromosome positions ∼10 to 35 Mb) (Fig. 5C) along the entire span of palindromic regions. NUMT pairs were highly similar (>99%) between and within palindromes (Supplemental Table S4), consistent with a rapid expansion. We also observed a nonpalindromic NUMT (located at position ∼10 Mb on bonobo Chr Y) that had a similar sequence to those within palindromes (Fig. 5C), suggesting this could be the ancestral sequence to the palindromic NUMTs. This nonpalindromic NUMT was separated from palindromic NUMTs by the centromere and thus could have been part of a deteriorated palindrome.
In chimpanzee, each NUMT copy was 7.1 kb long and included two to three regions of homology with mtDNA separated by a spacer (homologous to the contiguous positions 1–4289 bp, 13,643–15,375 bp, and 15,666–15,992 bp in bonobo mtDNA; sometimes the second region of homology was missing) on each arm of a palindrome (Supplemental Table S5). These had between 69% and 76% sequence identity to chimpanzee mtDNA (Supplemental Table S4) and were observed six times in chimpanzee (located in the palindrome region spanning Y Chromosome positions ∼5.5 to 24 Mb) along the entire span of palindromic regions (Fig. 5D), similar to bonobo. NUMTs in chimpanzee palindromes were similar in sequence between and within palindromes (Supplemental Table S4), and we observed four NUMTs outside of palindromes that were similar in sequence to palindromic NUMTs and thus could be the ancestral sequences in chimpanzee.
Considering known homologous palindrome clusters (Makova et al. 2024), these NUMTs were contained in the same ape palindrome cluster, which included multiple palindromes for bonobo (Q5, Q7, Q9, Q12, Q15, Q18, and Q20) and chimpanzee (Q4, Q6, Q10, and Q14). Every bonobo and chimpanzee palindrome in this cluster contained a NUMT on each arm. This palindrome cluster also included human Q7 and Pongo Q4 palindromes, but they did not harbor NUMTs.
We built a maximum parsimony tree of palindromic Y Chromosome NUMT sequences in bonobo and chimpanzee, including nearby NUMTs that had a similar sequence but were outside of palindromes and using mtDNA as an outgroup (Fig. 5E). We could decipher the phylogeny for this Y Chromosome palindrome cluster using the NUMTs as markers, although it was not fully resolved given the high similarity between palindromes. In most cases, NUMTs present at opposite arms of the same palindrome clustered together, suggesting gene conversion. A bonobo NUMT found in just a single arm of palindrome Q20.9 was nevertheless placed alongside the other palindromic NUMTs. In contrast, for bonobo and chimpanzee, nonpalindromic NUMTs were diverged enough to be placed in a separate clade (Fig. 5E), likely representing ancestral NUMTs integrated into palindromes.
Discussion
In this study of ape T2T genomes, we explored NUMT evolution by (1) detailing shared and lineage-specific events, (2) determining the rate of NUMT accumulation among great apes, (3) studying regions of the genome in which NUMTs are enriched and depleted, (4) discovering a rapid NUMT expansion within palindromes of Pan Chr Y, and (5) describing a novel mega-NUMT array in chimpanzee.
The majority of NUMTs were expected to be shared among great apes, owing to the relatively low NUMT integration rate (Wei et al. 2022). This is consistent with our findings indicating that a high fraction of NUMTs is shared by all great apes and by natural clades compared with the lower fraction of species-specific NUMTs. The incomplete natural clades, in which a single species was missing a NUMT, may be explained by a loss, or mutations, of the NUMTs. Many sparsely populated clades held NUMT phylogenies that could only be explained by multiple loss or integration events (or incomplete lineage sorting), suggesting the rarity of these events or limitations in our ability to detect shared NUMTs. Lineage-specific differences in the number of NUMT events could be owing to novel insertions, expansions of pre-existing NUMTs, or degradation of larger NUMTs. In the case of the Y Chromosome, the NUMT content increased in certain species, suggesting that there were either lineage-specific expansions of pre-existing NUMTs or more recent insertions of large NUMTs, and is consistent with high primate Chr Y variation (Makova et al. 2024). Although the fraction of the genome covered by NUMTs in orangutans varied greatly at Chr 7 and Chr 17, the variation was similar between the species, likely owing to incomplete lineage sorting resulting in similar polymorphic sites maintained across species.
The highest rates of NUMT insertions were seen in Hominini, particularly in the Pan genus, consistent with previous work (Uvizl et al. 2024). Orangutans had a lower NUMT rate than Hominini. The rate of NUMT accumulation in gorilla was lower than in the other species. Gorilla experienced an increase in satellite expansion after divergence from Hominini (Yoo et al. 2025). As we found that satellites were depleted in NUMTs, this could partially explain the slower NUMT accumulation in gorilla. We are more likely to identify more recent orthologous NUMTs, underestimating the accumulation of more ancient NUMT orthologous sites broadly. The slow accumulation of NUMTs in gorilla might also be an artifact. The gorilla assembly had the highest gap divergence of all the T2T great ape assemblies (Yoo et al. 2025), which could partially explain this slower rate of NUMT accumulation, as the phylogenetic trees are sensitive to the quality of alignments between species.
Although negative selection is likely acting to limit their deleterious integration into protein-coding sequences and enhancer regions, NUMTs are nevertheless tolerated within introns. The insertion of NUMTs into introns has been observed in other species, such as in honey bees (Behura 2007), but at a much lower frequency (∼3% of NUMTs were found in introns) than that observed in great apes (∼30% of NUMTs found in introns), although this could be attributed to lower intron content in honey bees.
NUMT integrations within TEs are likely neutral, given that most TEs are located outside functional regions. TEs were modestly enriched in NUMTs, although we did not detect a significant TE overrepresentation in the longer flanking regions of NUMTs (i.e., on a 50 kb scale analyzed with IWTomics). Our study is likely underpowered because of the small number of NUMTs per species. Given the ubiquity of TEs in ape genomes and their role in genome instability (Sen et al. 2006), the possibility that TEs contribute to NUMT integrations and expansions remains open. This relationship should be further explored as more high-quality nonhuman ape genomes are becoming available. NFNR regions displayed a high NUMT enrichment. The cause of such enrichment remains an open area of study, with the possibility of a genetic purge, genomic turnover, or insertional preference based on sequence characteristics.
Another study showed that mitochondrial and nuclear DNA stress increase NUMT integration ex vivo and in vitro, and almost one-half of these occur within gene regions (Wu et al. 2024). Their results disagree with our observation of (presumably) germline NUMTs located at mostly NFNR regions, suggesting different accumulation patterns without substantial stress. We found one-third of NUMTs to be located within gene regions, specifically introns, and not coding regions. NUMTs would likely be more tolerated in somatic cells than in the germline, as interrupting coding or regulatory regions would have a smaller impact on the organism, leading to mosaicism with age. Studying multiple tissues within an ape individual would highlight somatic NUMT mosaicism, which has been linked to early mortality (Zhou et al. 2024) and cancer (Ju et al. 2015) in humans. In general, we look forward to more high-quality genomes, sequence annotations, and diverse somatic sequencing for nonhuman primates that would allow us to study evolutionary processes acting on NUMTs in more detail.
A NUMT in the Bornean orangutan primary haplotype (Chr3_hap1_hsa4: 151,206,216–151,206,670), homologous to the ND6 gene in mtDNA (88% percent identity), overlapped two predicted CDS annotations for the same protein (NCBI RefSeq: XP_063520202). The ND6 gene has a single oxidoreductase domain in the PRKK06638 superfamily; however, neither of the two predicted CDSs in this NUMT encodes the full domain (Supplemental Fig. S13), and therefore, it is likely a pseudogene.
NUMTs can be seen as remnants of DNA stress. Like TEs, they are expected to integrate in regions of genome instability. We therefore expect a positive correlation between NUMTs and TEs. However, we found a weak negative correlation between NUMT and TE occurrence in the genome and no significant enrichment in TEs at NUMT 1–50 kb flanks. However, we found an enrichment in TE annotations when considering 50 bp flanks for NUMTs. This may reflect that NUMTs have only local integration preferences close to TEs. A major limitation to understanding NUMT integration preferences is their relatively small number.
We annotated NUMTs for a single individual per species, the T2T assemblies, as well as classified their presence within populations, using whole-genome sequencing from multiple individuals. The vast majority of T2T species-specific NUMTs were indeed fixed or were in very high frequencies in the populations. However, a recent population study demonstrated a high prevalence of polymorphic NUMTs in humans (Wei et al. 2022). Thus, our approach might miss a fraction of intraspecific NUMT diversity in nonhuman primates that are limited by the lack of multiple T2T assemblies per species.
We discovered a polymorphic NUMT event 76 kb in size, much longer than the other NUMTs, in chimpanzee. The assembly for this region was flagged as potentially erroneous, owing to the high number of reads mapping to both mtDNA and Chr 5 (HSA6). However, we were able to identify ONT ultra-long reads that span the entire 76 kb NUMT and PacBio HiFi reads that align unambiguously to this NUMT (Supplemental Fig. S9). Moreover, we verified the location and heterozygous nature of this NUMT using FISH (the limitations of this approach are described below).
The domestic cat (Felis catus) is also known to house a large NUMT near the centromere of Chr D2, although it is older and much larger than the chimpanzee NUMT. The cat NUMT likely inserted ∼2 MYA as a single NUMT and then amplified to range in size from 300–600 kb in the population (Lopez et al. 1994). So-called mega-NUMTs have also been observed in human pedigrees, tandemly repeated 56 times the size of a human mtDNA (Lutz-Bonengel et al. 2021). If located in the active region of the centromere, these NUMTs have the potential to interfere with centromere activity, leading to cellular senescence (González-Sánchez et al. 2022). Although the chimpanzee NUMT array was found within 0.5 Mb of the Chr 5 (HSA6) centromere, it was not located within satellite sequence.
We observed a series of NUMTs highly diverged from mtDNA but almost identical in sequence among themselves, within homologous palindromes of bonobo and chimpanzee but not human or other great apes. Because this NUMT was present in all Pan genus palindromes belonging to the homologous cluster but none outside of Pan, we hypothesize that it inserted in the Y Chromosome region of the chimpanzee and bonobo common ancestor, within a palindrome arm. Gene conversion likely copied the NUMT to the opposite palindrome arm. Then this NUMT-containing palindrome expanded multiple times leading to the phylogenies observed in bonobo and chimpanzee. This insertion likely occurred 2.5 to 7 MYA, judging by species divergence estimates. We also expect gene conversion to occur for NUMT sequences between palindromic arms, homogenizing the NUMT sequences between the palindrome arms and also across palindromes. Indeed, the NUMT sequence divergence between palindromic arms is <1%. This is consistent with our observation that NUMTs in the same palindrome were often grouped together on the phylogenetic tree and can be explained by gene conversion among palindromes and a rapid expansion of palindromes in the Pan genus (Makova et al. 2024). This finding of NUMTs within the Y Chromosome shines more light into this enigmatic genomic region.
Our data set's relatively small number of NUMT integrations limited our ability to discern integration preferences for a diverse set of genome annotations. For example, recombination and double-strand break maps are expected to be associated with NUMT integration, but we did not find this signal as a result of our analysis. An enrichment of TEs within 5 kb of NUMTs has been demonstrated across mammals (Uvizl et al. 2024), although we found no significant enrichment either in the immediate NUMT flanks (Fig. 3) or within 50 kb of NUMTs (Supplemental Fig. S7). We expect a larger data set to further our understanding of NUMT integration patterns.
Although we were able to validate the presence of a large and heterozygous NUMT on chimpanzee Chr 5 (HSA6), we were not able to experimentally validate the number of individual copies it comprises. The assembly suggests that this NUMT has four full mtDNA copies, with some shorter copies in the inverse direction. A droplet digital PCR approach (Hindson et al. 2013) of a repeating unit unique to the NUMT may yield a proper validation of the total size. However, the low divergence between the NUMT and the extant chimpanzee mtDNA complicates this. A fiber-FISH approach (Jackson et al. 1998) could compensate for this, as the NUMT flanks and the content would be distinguishable from each other.
Exploring NUMT sequence evolution could elucidate the history of mutation and expansion postintegration of NUMTs. Now that T2T genome assemblies for great apes are available and their NUMT content assessed, they open up a new era in population genomics of great apes. The ongoing HPRC project (Liao et al. 2023) provides high-quality genomes for human populations, allowing for similarly high-quality annotation of NUMTs and their sequence context, as previous studies have depended on de novo assembly of NUMTs (Dayama et al. 2020). Expanding our analysis to population samples of nonhuman great apes would benefit our understanding of NUMT evolution in this clade. Further, multiple species of lesser apes would be the logical next step for our analysis. Siamang is the only current gibbon species with a T2T genome, although it aligns unreliably to great ape genomes owing to rapid karyotype evolution, requiring more gibbon genomes to resolve the NUMT evolution in lesser apes.
This is the first comprehensive study of NUMT insertions in nonhuman primates with high-quality, T2T genome assemblies. NUMT annotations for T2T genomes will be a valuable tool for mtDNA analysis in great apes. As has been done for humans (Wei et al. 2022), an extensive population-scale study of NUMTs in nonhuman apes will be important for attaining a more complete picture of their evolution.
Methods
Reference genomes
We utilized the recently released version 2 of T2T genomes for bonobo (mPanPan1), chimpanzee (mPanTro3), human (CHM13), gorilla (mGorGor1), Sumatran orangutan (mPonAbe1), and Bornean orangutan (mPonPyg2) (Makova et al. 2024; Yoo et al. 2025). The primary assembly was utilized for our analyses unless noted otherwise. In this paper, we refer to human chromosomes and their homologs (HSA) (Yoo et al. 2025), not species-specific chromosome numbering. To compare the human Chromosome 2 to homologous chromosomes in the apes, we used the site of fusion, a ∼100 kb region (2q14.1, Chr 2: 113,940,058–114,049,496), that separates the ancestral segments corresponding to HSA2a and HSA2b (Yang et al. 2026).
Identification of NUMTs
To identify candidate NUMTs, the mitochondrial genome for each species was aligned to the corresponding nuclear genome. We utilized the BLASTN aligner (v2.16.0+) (Chen et al. 2015) with parameters previously used to study NUMTs in the human CHM13 assembly (-evalue 0.0001 -gapopen 5 -gapextend 2 -penalty -3 -reward 2 -task blastn) (Tao et al. 2023). Alignments >30 bp were considered. Overlapping NUMT annotations were merged using BEDTools (v2.31.1) (Quinlan and Hall 2010) and considered the same NUMT insertion.
Presence/absence phylogenetic analysis
To identify species-specific, lineage-specific, and shared NUMTs, we followed a methodology similar to that used by Yoo et al. (2025) for TE integration analysis. In brief, we extracted 500 bp flanking sequences on each side of each NUMT, concatenated these sequences, and aligned them against every ape genome using BLAT (Kent 2002). We then compared the 14 bp k-mer distributions between the candidate matches and the original NUMT with its flanking sequence. Matches with an identity of ≥50% were retained. NUMTs aligned to a single species were classified as species specific and counted as a single NUMT integration event, even if observed multiple times within that species (Fig. 2A). These data were used to build a maximum parsimony tree using PAUP (v4.0a) (https://paup.phylosolutions.com) and plotted using MEGA11 (Fig. 2B; Tamura et al. 2021). The pairwise distance matrix was estimated in MEGA11 using maximum composite likelihood (Tamura et al. 2004), which accounts for multiple hits by computing the Tamura–Nei distance (Tamura and Nei 1993). The NUMT accumulation rate for each branch was estimated by dividing the number of NUMTs shared by that branch by the divergence time (see Fig. 1A in the work of Makova et al. 2024 and references therein).
Population analyses
For population-level analysis of NUMTs (Fig. 2C; Supplemental Fig. S5), for humans, we utilized 45 assemblies in HPRC version 1 (Liao et al. 2023), and for nonhuman great apes, we utilized publicly available whole-genome sequences in the European Nucleotide Archive (ENA; https://www.ebi.ac.uk/ena/browser/home) under accession numbers PRJEB15086, PRJEB19688, and PRJEB59576, as well as in the Sequence Read Archive under accession numbers PRJNA189439, PRJNA20869, and PRJNA74653.
We genotyped, in population samples, the presence of NUMTs identified in T2T assemblies. For the HPRC assemblies, we utilized the pangenome graph with CHM13 as the reference and extracted NUMT loci for the HPRC primary haplotypes (Liao et al. 2023). NUMTs were genotyped using the presence of alignments for each individual at each locus. For the nonhuman great ape whole-genome sequencing runs, we first used fastp (Chen 2025) to trim sequence adapters and bases with a low sequence quality and mapped reads to the T2T assembly for the corresponding species. We genotyped NUMTs in these alignments by considering paired-end reads that have (1) a read in the NUMT flanking regions, (2) a read mapping to the NUMT, and (3) an alignment length between reads of <500 bp. Such genotyping allowed us to determine NUMT variation in the population for NUMTs identified in T2T assemblies for the same species. We then classified species-specific NUMTs by whether they are shared by all individuals (fixed in the population), shared by all but one individual (high frequency), variable, or rare (present in a single individual) in the population.
Importantly, genotyping did not include NUMTs absent from the T2T assemblies, as the majority of species do not have more than one high-quality assembly to compare, which could explain clades with missing NUMTs. To determine the robustness of clades based on a single individual per species and to identify potentially missing shared NUMTs, we aligned five human near-T2T assemblies from the HPRC (HG002, HG00597, HG01358, HG02572, and HG04184) to the T2T assemblies of every species using the BLAT-based method described above (Supplemental Fig. S5).
Genome annotations
We utilized functional annotations provided by Mohanty et al. (2025) that were derived from the NCBI Eukaryotic Genome Annotation Pipeline and RepeatMasker annotations published alongside the new ape T2T assemblies (Makova et al. 2024; Yoo et al. 2025). Each genome was divided into protein-coding genes (subdivided into CDSs, introns, and 5′ and 3′ UTRs), NPC genes, and repetitive regions (subdivided into satellites, TEs, and low complexity regions). The remaining fraction of the genome was categorized as NFNR regions. To compute the number of NUMT events and NUMT base pairs that overlap these genome annotations (Fig. 3A), at least 10% of the NUMT was required to overlap the feature. The fraction of functional regions of a certain type covered by NUMTs was calculated by dividing the fraction of NUMTs (or NUMT base pairs) within these regions by the fraction of the genome covered by these regions (Fig. 3B).
Enrichment analysis
To study the distribution of NUMTs along each genome, we utilized NUMT flanks (50 bp in length), and at least an 80% overlap in one NUMT flank and genome annotations was required (Fig. 3; Supplemental Fig. S5). Enrichment was computed as the fraction of total NUMTs observed at a genomic feature, normalized by the fraction of the genome covered by that feature. To obtain 95% confidence intervals, we performed a bootstrap procedure (Efron 1979) by resampling each genome annotation with replacement 1000 times and recomputing the enrichment score for each sampling.
Functional hypothesis testing
To study potential enrichment in the sequence context of NUMTs, we performed functional hypothesis testing using the IWTomics package (Supplemental Fig. S7; Cremona et al. 2019). The test set consisted of 50 kb flanks around NUMTs concatenated into 100 kb windows. The control set was 100 kb windows in the parts of the genome not included in the test set. We considered the following genome annotations (derived from the work of Mohanty et al. 2025) that may be related to NUMT accumulation—origins of replication; to CpG islands and non-B DNA motifs (Smeds et al. 2025)—APRs, GQs, MRs, and Z-DNA (Z); to TEs (Yoo et al. 2025)—SINEs, LINE1 and LINE2/3, long tandem repeat retrotransposons (LTRs), DNA transposons, retroposons, and rolling circle transposons; and to other repeat annotations (Yoo et al. 2025)—satellites, simple repeats, and low complexity regions.
Genome-wide comparison of NUMTs and TEs
To compare NUMT and TE densities across the genome, we computed such densities among nonoverlapping genome windows (0.1 Mb and 1 Mb in length) for each species. The genome windows were created using BEDTools makewindows, and the density was computed using BEDTools annotate (Quinlan and Hall 2010). A Pearson's correlation test was utilized to compare NUMT density (in log scale) to TE density.
Long-fragment polymerase chain reaction
A long-fragment polymerase chain reaction (PCR) to make probes for validating the long NUMT on the chimpanzee Chr 5 (HSA6) was performed following the manufacturer's instructions (Vazyme, 2x Phanta Max master mix version 23.1) with minor modifications. Briefly, PCR reactions were performed with 2x Phanta Max master mix 25 µL, primers forward and reverse (10 µM) at 2 µL each, and 50 ng of DNA adding ddH2O up to 50 µL. The reaction was performed under these conditions: (1) initial denaturation for 3 min at 95°C, (2) 35 cycles of denaturation for 15 sec at 95°C and annealing for 15 sec at 60°C, and (3) an extension for 16 min at 72°C and a final elongation step for 5 min at 72°C.
Fluorescence in situ hybridization
The metaphase spreads were obtained from lymphoblast cell lines with standard procedures (de Gennaro et al. 2024) from a chimpanzee cell line (GM18354), a chimpanzee (PTR17, P. troglodytes), and a human HapMap individual (GM18548, Coriell Cell Repository) available at the University of Bari. Cytogenetic analyses were performed by fixing metaphase spreads onto slides and then incubating for 1 h 30 min at 90°C to contribute to sample fixation and dehydration. The 0.005% pepsin/HCl 0.01 M treatments were performed to eliminate cytoplasm proteins for better hybridization rates. Subsequent treatments in 1 × PBS, MgCl2 0.5 M, 8% paraformaldehyde, and 70%/90%/absolute alcohols allowed proper stabilization, fixation, and dehydration of metaphases and nuclei DNA molecules. FISH experiments were performed as previously described (Ventura et al. 2003): 200 ng of the DNA probe (originating from long PCR fragments above), labeled by nick-translation with Cy3-dUTP or fluorescein-dUTP, was precipitated by ion-exchange alcohol precipitation with canine Cot1 DNA and finally denatured for 2 min at 70°C and hybridized overnight at 37°C. Posthybridization washing was done at 60°C in 0.1× SSC (three times, high stringency). The slides were then stained with DAPI, producing a Q-banding pattern. The fluorescence signals from Cy3, fluorescein, and DAPI were detected separately with specific filters using a Leica DMRXA epifluorescence microscope equipped with a cooled CCD camera (Teledyne Princeton Instruments) and recorded as grayscale images. A total of 50 cells per experiment were scored. Finally, Adobe Photoshop software (2024) was used for image pseudocolorization and merging of the acquired images.
Time of divergence
We utilized the following formula to estimate the time of divergence for NUMTs: T = d/2u, where d is the divergence between sequences, and u is the mutation rate. Given the uncertain time of insertion of the NUMT, we were conservative in estimating time of divergence by assuming mutation rates of 10−7 substitutions per site per year for mtDNA (Arbeithuber et al. 2025) and 10−8 substitutions per site per year for the nuclear genome (Cagan et al. 2022).
Code availability
The in-house scripts generated for this paper are available at GitHub (https://github.com/makovalab-psu/T2T_greatApe_NUMTs) and as Supplemental Code.
Competing interest statement
The authors declare no competing interests.
Acknowledgments
We thank Mark Loftus, Miriam K. Konkel, Erin Molloy, Christine R. Beck, Arang Rhie, Gabrielle Hartley, Glennis Logsdon, Prajna Hebbar, and the other members of the T2T Transposable Element and CenSat working groups for their invaluable feedback in the development of this project. We also thank Saswat Mohanty, Karol Pál, Linnéa Smeds, and Alexis Santos for their critical feedback and discussions that helped improve this project. This work was funded, in part, by the National Institutes of Health (NIH) Office of Extramural Research (OER) award R35GM151945 and the Willaman Endowed Chair Fund for K.D.M. and by the GlaxoSmithKline (GSK) graduate fellowship and NIH-sponsored Genes, Brains, and Behavior (GBB) Postdoctoral Training Program at the University of Minnesota Twin Cities (OER, grant number T32DA050560) for E.T.-G.
Author contributions: E.T.-G. was responsible for conceptualization, data curation, formal analysis, funding acquisition, investigation, methodology, project administration, software, resources, visualization, and writing the original draft. M.A.C. was responsible for methodology, software (IWTomics implementation), and reviewing and editing. J.M.S. was responsible for methodology, resources (repeat annotations), and reviewing and editing. M.V. was responsible for investigation, validation (FISH experiment), and reviewing and editing. R.J.O. was responsible for supervision, funding acquisition, and reviewing and editing. K.D.M. was responsible for conceptualization, supervision, funding acquisition, project administration, resources, and writing the original draft.
Footnotes
[1] Supplementary material [Supplemental material is available for this article.]
[2] Article published online before print. Article, supplemental material, and publication date are at https://www.genome.org/cgi/doi/10.1101/gr.280875.125.
[3] Freely available online through the Genome Research Open Access option.
References
- ↵Arbeithuber B, Anthony K, Higgins B, Oppelt P, Shebl O, Tiemann-Boege I, Chiaromonte F, Ebner T, Makova KD. 2025. Allele frequency selection and no age-related increase in human oocyte mitochondrial mutations. Sci Adv 11: eadw4954. 10.1126/sciadv.adw4954
- ↵Balachandran P, Walawalkar IA, Flores JI, Dayton JN, Audano PA, Beck CR. 2022. Transposable element-mediated rearrangements are prevalent in human genomes. Nat Commun 13: 7115. 10.1038/s41467-022-34810-8
- ↵Behura SK. 2007. Analysis of nuclear copies of mitochondrial sequences in honeybee (Apis mellifera) genome. Mol Biol Evol 24: 1492–1505. 10.1093/molbev/msm068
- ↵Bourque G, Burns KH, Gehring M, Gorbunova V, Seluanov A, Hammell M, Imbeault M, Izsvák Z, Levin HL, Macfarlan TS, 2018. Ten things you should know about transposable elements. Genome Biol 19: 199. 10.1186/s13059-018-1577-z
- ↵Cagan A, Baez-Ortega A, Brzozowska N, Abascal F, Coorens THH, Sanders MA, Lawson ARJ, Harvey LMR, Bhosle S, Jones D, 2022. Somatic mutation rates scale with lifespan across mammals. Nature 604: 517–524. 10.1038/s41586-022-04618-z
- ↵Calabrese FM, Simone D, Attimonelli M. 2012. Primates and mouse NumtS in the UCSC Genome Browser. BMC Bioinformatics 13 (Suppl 4): S15. 10.1186/1471-2105-13-S4-S15
- ↵Calabrese FM, Balacco DL, Preste R, Diroma MA, Forino R, Ventura M, Attimonelli M. 2017. NumtS colonization in mammalian genomes. Sci Rep 7: 16357. 10.1038/s41598-017-16750-2
- ↵Chatre L, Ricchetti M. 2011. Nuclear mitochondrial DNA activates replication in Saccharomyces cerevisiae. PLoS One 6: e17235. 10.1371/journal.pone.0017235
- ↵Chen S. 2025. fastp 1.0: an ultra-fast all-round tool for FASTQ data quality control and preprocessing. iMeta 4: e70078. 10.1002/imt2.70078
- ↵Chen Y, Ye W, Zhang Y, Xu Y. 2015. High speed BLASTN: an accelerated MegaBLAST search tool. Nucleic Acids Res 43: 7762–7768. 10.1093/nar/gkv784
- ↵Cremona MA, Pini A, Cumbo F, Makova KD, Chiaromonte F, Vantini S. 2018. IWTomics: testing high-resolution sequence-based “omics” data at multiple locations and scales. Bioinformatics 34: 2289–2291. 10.1093/bioinformatics/bty090
- ↵Cremona MA, Xu H, Makova KD, Reimherr M, Chiaromonte F, Madrigal P. 2019. Functional data analysis for computational biology. Bioinformatics 35: 3211–3213. 10.1093/bioinformatics/btz045
- ↵Dayama G, Emery SB, Kidd JM, Mills RE. 2014. The genomic landscape of polymorphic human nuclear mitochondrial insertions. Nucleic Acids Res 42: 12640–12649. 10.1093/nar/gku1038
- ↵Dayama G, Zhou W, Prado-Martinez J, Marques-Bonet T, Mills RE. 2020. Characterization of nuclear mitochondrial insertions in the whole genomes of primates. NAR Genom Bioinform 2: lqaa089. 10.1093/nargab/lqaa089
- ↵de Gennaro L, Burgio M, Lacalandra GM, Petronella F, L'Abbate A, Ravasini F, Trombetta B, Rizzo A, Ventura M, Cicirelli V. 2024. Genomic sequencing to detect cross-breeding quality in dogs: an example studying disorders in sexual development. Int J Mol Sci 25: 10763. 10.3390/ijms251910763
- ↵Efron B. 1979. Bootstrap methods: another look at the jackknife. Ann Stat 7: 1–26. 10.1214/aos/1176344552
- ↵Finnegan DJ. 1989. Eukaryotic transposable elements and genome evolution. Trends Genet 5: 103–107. 10.1016/0168-9525(89)90039-5
- ↵Fleischmann Z, Cote-L'Heureux A, Franco M, Oreshkov S, Annis S, Khrapko M, Aidlen D, Popadin K, Woods DC, Tilly JL, 2024. Reanalysis of mtDNA mutations of human primordial germ cells (PGCs) reveals NUMT contamination and suggests that selection in PGCs may be positive. Mitochondrion 74: 101817. 10.1016/j.mito.2023.10.005
- ↵González-Sánchez M, García-Martínez V, Bravo S, Kobayashi H, Martínez de Toda I, González-Bermúdez B, Plaza GR, De la Fuente M. 2022. Mitochondrial DNA insertions into nuclear DNA affecting chromosome segregation: insights for a novel mechanism of immunosenescence in mice. Mech Ageing Dev 207: 111722. 10.1016/j.mad.2022.111722
- ↵Hazkani-Covo E, Covo S. 2008. Numt-mediated double-strand break repair mitigates deletions during primate genome evolution. PLoS Genet 4: e1000237. 10.1371/journal.pgen.1000237
- ↵Hazkani-Covo E, Graur D. 2007. A comparative analysis of numt evolution in human and chimpanzee. Mol Biol Evol 24: 13–18. 10.1093/molbev/msl149
- ↵Hazkani-Covo E, Zeller RM, Martin W. 2010. Molecular poltergeists: mitochondrial DNA copies (numts) in sequenced nuclear genomes. PLoS Genet 6: e1000834. 10.1371/journal.pgen.1000834
- ↵Hindson CM, Chevillet JR, Briggs HA, Gallichotte EN, Ruf IK, Hindson BJ, Vessella RL, Tewari M. 2013. Absolute quantification by droplet digital PCR versus analog real-time PCR. Nat Methods 10: 1003–1005. 10.1038/nmeth.2633
- ↵Hoyt SJ, Storer JM, Hartley GA, Grady PGS, Gershman A, de Lima LG, Limouse C, Halabian R, Wojenski L, Rodriguez M, 2022. From telomere to telomere: the transcriptional and epigenetic state of human repeat elements. Science 376: eabk3112. 10.1126/science.abk3112
- ↵Jackson SA, Wang ML, Goodman HM, Jiang J. 1998. Application of fiber-FISH in physical mapping of Arabidopsis thaliana. Genome 41: 566–572. 10.1139/g98-093
- ↵Jensen-Seaman MI, Wildschutte JH, Soto-Calderón ID, Anthony NM. 2009. A comparative approach shows differences in patterns of Numt insertion during hominoid evolution. J Mol Evol 68: 688–699. 10.1007/s00239-009-9243-4
- ↵Ju YS, Tubio JMC, Mifsud W, Fu B, Davies HR, Ramakrishna M, Li Y, Yates L, Gundem G, Tarpey PS, 2015. Frequent somatic transfer of mitochondrial DNA into the nuclear genome of human cancer cells. Genome Res 25: 814–824. 10.1101/gr.190470.115
- ↵Kent WJ. 2002. BLAT—the BLAST-like alignment tool. Genome Res 12: 656–664. 10.1101/gr.229202
- ↵Laricchia KM, Lake NJ, Watts NA, Shand M, Haessly A, Gauthier L, Benjamin D, Banks E, Soto J, Garimella K, 2022. Mitochondrial DNA variation across 56,434 individuals in gnomAD. Genome Res 32: 569–582. 10.1101/gr.276013.121
- ↵Lavrov DV, Pett W. 2016. Animal mitochondrial DNA as we do not know it: mt-genome organization and evolution in nonbilaterian lineages. Genome Biol Evol 8: 2896–2913. 10.1093/gbe/evw195
- ↵Lewis SC, Joers P, Willcox S, Griffith JD, Jacobs HT, Hyman BC. 2015. A rolling circle replication mechanism produces multimeric lariats of mitochondrial DNA in Caenorhabditis elegans. PLoS Genet 11: e1004985. 10.1371/journal.pgen.1004985
- ↵Liao W-W, Asri M, Ebler J, Doerr D, Haukness M, Hickey G, Lu S, Lucas JK, Monlong J, Abel HJ, 2023. A draft human pangenome reference. Nature 617: 312–324. 10.1038/s41586-023-05896-x
- ↵Liu X, Liu N, Jing X, Khan H, Yang K, Zheng Y, Nie Y, Song H, Huang Y. 2024. Genomic and transcriptomic perspectives on the origin and evolution of NUMTs in Orthoptera. Mol Phylogenet Evol 201: 108221. 10.1016/j.ympev.2024.108221
- ↵Lopez JV, Yuhki N, Masuda R, Modi W, O'Brien SJ. 1994. Numt, a recent transfer and tandem amplification of mitochondrial DNA to the nuclear genome of the domestic cat. J Mol Evol 39: 174–190. 10.1007/BF00163806
- ↵Lutz-Bonengel S, Niederstätter H, Naue J, Koziel R, Yang F, Sänger T, Huber G, Berger C, Pflugradt R, Strobl C, 2021. Evidence for multi-copy mega-NUMTs in the human genome. Nucleic Acids Res 49: 1517–1531. 10.1093/nar/gkaa1271
- ↵Makova KD, Pickett BD, Harris RS, Hartley GA, Cechova M, Pal K, Nurk S, Yoo D, Li Q, Hebbar P, 2024. The complete sequence and comparative analysis of ape sex chromosomes. Nature 630: 401–411. 10.1038/s41586-024-07473-2
- ↵Maude H, Davidson M, Charitakis N, Diaz L, Bowers WHT, Gradovich E, Andrew T, Huntley D. 2019. NUMT confounding biases mitochondrial heteroplasmy calls in favor of the reference allele. Front Cell Dev Biol 7: 201. 10.3389/fcell.2019.00201
- ↵Mishmar D, Ruiz-Pesini E, Brandon M, Wallace DC. 2004. Mitochondrial DNA-like sequences in the nucleus (NUMTs): insights into our African origins and the mechanism of foreign DNA integration. Hum Mutat 23: 125–133. 10.1002/humu.10304
- ↵Mohanty SK, Chiaromonte F, Makova KD. 2025. Evolutionary dynamics of predicted G-quadruplexes in human and other great apes. Genome Biol 26: 161. 10.1186/s13059-025-03635-1
- ↵Namasivayam S, Sun C, Bah AB, Oberstaller J, Pierre-Louis E, Etheridge RD, Feschotte C, Pritham EJ, Kissinger JC. 2023. Massive invasion of organellar DNA drives nuclear genome evolution in Toxoplasma. Proc Natl Acad Sci 120: e2308569120. 10.1073/pnas.2308569120
- ↵Nurk S, Koren S, Rhie A, Rautiainen M, Bzikadze AV, Mikheenko A, Vollger MR, Altemose N, Uralsky L, Gershman A, 2022. The complete sequence of a human genome. Science 376: 44–53. 10.1126/science.abj6987
- ↵Prado-Martinez J, Sudmant PH, Kidd JM, Li H, Kelley JL, Lorente-Galdos B, Veeramah KR, Woerner AE, O'Connor TD, Santpere G, 2013. Great ape genetic diversity and population history. Nature 499: 471–475. 10.1038/nature12228
- ↵Prokopov D, Saluev T, Romanenko S, Bakloushinskaya I, Graphodatsky A. 2023. Genomic underground: unraveling NUMTs in mole voles. bioRxiv 10.1101/2023.12.30.573699
- ↵Puertas MJ, González-Sánchez M. 2020. Insertions of mitochondrial DNA into the nucleus: effects and role in cell evolution. Genome 63: 365–374. 10.1139/gen-2019-0151
- ↵Quinlan AR, Hall IM. 2010. BEDTools: a flexible suite of utilities for comparing genomic features. Bioinformatics 26: 841–842. 10.1093/bioinformatics/btq033
- ↵Rhie A, Nurk S, Cechova M, Hoyt SJ, Taylor DJ, Altemose N, Hook PW, Koren S, Rautiainen M, Alexandrov IA, 2023. The complete sequence of a human Y chromosome. Nature 621: 344–354. 10.1038/s41586-023-06457-y
- ↵Saccone C, Gissi C, Reyes A, Larizza A, Sbisà E, Pesole G. 2002. Mitochondrial DNA in metazoa: degree of freedom in a frozen event. Gene 286: 3–12. 10.1016/S0378-1119(01)00807-1
- ↵Sagan L. 1967. On the origin of mitosing cells. J Theor Biol 14: 225–274. 10.1016/00225193(67)90079-3
- ↵Sen SK, Han K, Wang J, Lee J, Wang H, Callinan PA, Dyer M, Cordaux R, Liang P, Batzer MA. 2006. Human genomic deletions mediated by recombination between Alu elements. Am J Hum Genet 79: 41–53. 10.1086/504600
- ↵Sloan DB, Fields PD, Havird JC. 2015. Mitonuclear linkage disequilibrium in human populations. Proc Biol Sci 282: 20151704. 10.1098/rspb.2015.1704
- ↵Smeds L, Kamali K, Kejnovská I, Kejnovský E, Chiaromonte F, Makova KD. 2025. Non-canonical DNA in human and other ape telomere-to-telomere genomes. Nucleic Acids Res 53: gkaf298. 10.1093/nar/gkaf298
- ↵Smit AFA, Hubley R, Green P. 2013–2015. RepeatMasker Open-4.0. http://www.repeatmasker.org.
- ↵Spuhler JN. 1988. Evolution of mitochondrial DNA in monkeys, apes, and humans. Am J Phys Anthropol 31: 15–48. 10.1002/ajpa.1330310504
- ↵Srinivasainagendra V, Sandel MW, Singh B, Sundaresan A, Mooga VP, Bajpai P, Tiwari HK, Singh KK. 2017. Migration of mitochondrial DNA in the nuclear genome of colorectal adenocarcinoma. Genome Med 9: 31. 10.1186/s13073-017-0420-6
- ↵Stupar RM, Lilly JW, Town CD, Cheng Z, Kaul S, Buell CR, Jiang J. 2001. Complex mtDNA constitutes an approximate 620-kb insertion on Arabidopsis thaliana chromosome 2: implication of potential sequencing errors caused by large-unit repeats. Proc Natl Acad Sci 98: 5099–5103. 10.1073/pnas.091110398
- ↵Tamura K, Nei M. 1993. Estimation of the number of nucleotide substitutions in the control region of mitochondrial DNA in humans and chimpanzees. Mol Biol Evol 10: 512–526. 10.1093/oxfordjournals.molbev.a040023
- ↵Tamura K, Nei M, Kumar S. 2004. Prospects for inferring very large phylogenies by using the neighbor-joining method. Proc Natl Acad Sci 101: 11030–11035. 10.1073/pnas.0404206101
- ↵Tamura K, Stecher G, Kumar S. 2021. MEGA11: molecular evolutionary genetics analysis version 11. Mol Biol Evol 38: 3022–3027. 10.1093/molbev/msab120
- ↵Tao Y, He C, Lin D, Gu Z, Pu W. 2023. Comprehensive identification of mitochondrial pseudogenes (NUMTs) in the human telomere-to-telomere reference genome. Genes (Basel) 14: 2092. 10.3390/genes14112092
- ↵Thorvaldsdóttir H, Robinson JT, Mesirov JP. 2013. Integrative Genomics Viewer (IGV): high-performance genomics data visualization and exploration. Brief Bioinform 14: 178–192. 10.1093/bib/bbs017
- ↵Tsuzuki T, Nomiyama H, Setoyama C, Maeda S, Shimada K. 1983. Presence of mitochondrial-DNA-like sequences in the human nuclear DNA. Gene 25: 223–229. 10.1016/0378-1119(83)90226-3
- ↵Uvizl M, Puechmaille SJ, Power S, Pippel M, Carthy S, Haerty W, Myers EW, Teeling EC, Huang Z. 2024. Comparative genome microsynteny illuminates the fast evolution of nuclear mitochondrial segments (NUMTs) in mammals. Mol Biol Evol 41: msad278. 10.1093/molbev/msad278
- ↵Ventura M, Mudge JM, Palumbo V, Burn S, Blennow E, Pierluigi M, Giorda R, Zuffardi O, Archidiacono N, Jackson MS, 2003. Neocentromeres in 15q24-26 map to duplicons which flanked an ancestral centromere in 15q25. Genome Res 13: 2059–2068. 10.1101/gr.1155103
- ↵Wei W, Schon KR, Elgar G, Orioli A, Tanguy M, Giess A, Tischkowitz M, Caulfield MJ, Chinnery PF. 2022. Nuclear-embedded mitochondrial DNA sequences in 66,083 human genomes. Nature 611: 105–114. 10.1038/s41586-022-05288-7
- ↵Wu J, Liu Y, Ou L, Gan T, Zhangding Z, Yuan S, Liu X, Liu M, Li J, Yin J, 2024. Transfer of mitochondrial DNA into the nuclear genome during induced DNA breaks. Nat Commun 15: 9438. 10.1038/s41467-024-53806-0
- ↵Yang Z, Zhang L, Jiang X, Yang X, Ma K, Yoo D, Lu Y, Zhang S, Chen J, Nie Y, 2026. Incomplete lineage sorting of segmental duplications defines the human chromosome 2 fusion site early during African great ape speciation. Cell Genom 6: 101079. 10.1016/j.xgen.2025.101079
- ↵Yoo D, Rhie A, Hebbar P, Antonacci F, Logsdon GA, Solar SJ, Antipov D, Pickett BD, Safonova Y, Montinaro F, 2025. Complete sequencing of ape genomes. Nature 641: 401–418. 10.1038/s41586-025-08816-3
- ↵Zhou W, Karan KR, Gu W, Klein H-U, Sturm G, De Jager PL, Bennett DA, Hirano M, Picard M, Mills RE. 2024. Somatic nuclear mitochondrial DNA insertions are prevalent in the human brain and accumulate over time in fibroblasts. PLoS Biol 22: e3002723. 10.1371/journal.pbio.3002723