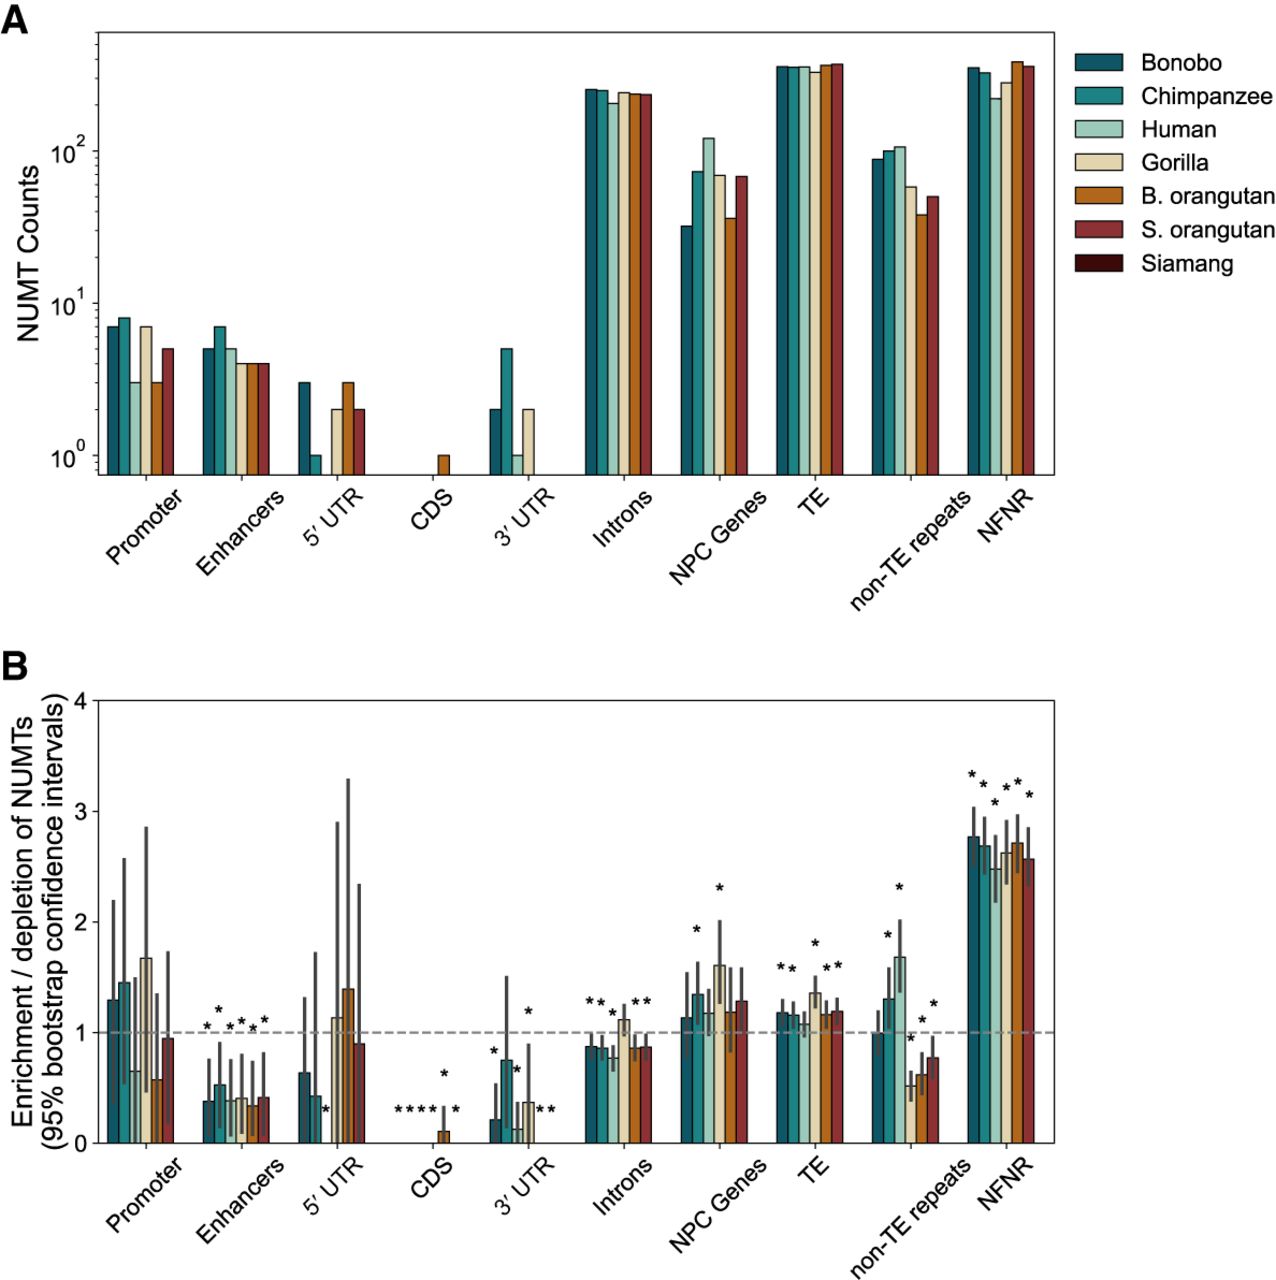
NUMTs at functional, repetitive, and presumably neutrally evolving genome regions. (A,B) The number of NUMTs (A) and enrichment in NUMT counts (B), flanked (50 bp up- or downstream) by each genomic feature. Enrichment scores were computed as the fraction of total NUMTs within the genomic feature divided by the fraction of the genome encompassed by the genomic feature. The horizontal line at one represents the genome-wide average. Values above one indicate enrichment of NUMTs in that feature, whereas values below one indicate depletion of NUMTs. Significant enrichment or depletion was determined by 95% confidence intervals (obtained with bootstrap, 1000 repetitions) that do not overlap one, detailed by a star above the bar. (NPC) Non-protein-coding genes, (NFNR) nonfunctional nonrepetitive regions.