
Abstract
All forms of genetic variation originate from new mutations, making it crucial to understand their rates and mechanisms. Here, we use long-read sequencing from Pacific Biosciences (PacBio) to investigate de novo mutations that accumulated in 12 inbred mouse lines derived from three commonly used inbred strains (C3H, C57BL/6, and FVB) maintained for 8 to 15 generations in a mutation accumulation (MA) experiment. We built chromosome-level genome assemblies based on the MA line founders’ genomes and then employed a combination of read and assembly-based methods to call the complete spectrum of new mutations. On average, there are about 45 mutations per haploid genome per generation, about half of which (54%) are insertions and deletions shorter than 50 bp (indels). The remainder are single-nucleotide mutations (SNMs; 44%) and large structural mutations (SMs; 2%). We found that the degree of DNA repetitiveness is positively correlated with SNM and indel rates and that a substantial fraction of SMs can be explained by homology-dependent mechanisms associated with repeat sequences. Most (90%) indels can be attributed to microsatellite contractions and expansions, and there is a marked bias toward 4 bp indels. Among the different types of SMs, tandem repeat mutations have the highest mutation rate, followed by insertions of transposable elements (TEs). We uncover a rich landscape of active TEs, notable differences in their spectrum among MA lines and strains, and a high rate of gene retroposition. Our study offers novel insights into mammalian genome evolution and highlights the importance of repetitive elements in shaping genomic diversity.
All forms of genetic variation originate from new mutations, so it is important to know the rate at which the different types of changes in the DNA sequence arise and their underlying mechanisms. New mutations are fundamental for many questions in evolutionary biology, and efforts to estimate their rates originated early in the history of genetics by phenotypic analysis of mutation accumulation (MA) lines of Drosophila melanogaster (Muller 1928; Bateman 1959; Mukai 1964) and in humans by pedigree analysis (for review, see Nachman 2004). In recent decades, DNA sequencing techniques have greatly enhanced the ability to detect new mutations, allowing the estimation of mutation rates at the molecular level (Halligan and Keightley 2009; Bergeron et al. 2022). This has enabled mutation rates to be estimated in a wide range of taxa (Lynch et al. 2023; Wang and Obbard 2023), including humans and mice (Ohno 2019). However, the most widely available short-read sequencing technologies only allow inference of the rate and spectrum of single-nucleotide mutations (SNMs) and short insertions and deletions in nonrepetitive genomic regions. Thanks to recent advancements in long-range sequencing techniques, it is now possible to overcome these limitations and to infer the complete spectrum of new mutations, including structural mutations (SMs) (López-Cortegano et al. 2023).
Often defined as mutations longer than 50 bp (Mahmoud et al. 2019), SMs represent a heterogeneous and complex group of mutations that have many diverse mechanisms influencing their rate and genomic distribution. Copy-number variants, including deletions and duplications, may affect gene dosage and are important for adaptation, gene family evolution, and disease (Zhang et al. 2009). Chromosome rearrangements, such as inversions and translocations, alter the landscape of recombination and are involved in processes such as speciation and sex chromosome evolution (Potter et al. 2017). All of these types of SMs emerge predominantly owing to failure of the repair of double-strand breaks and involve mechanisms that typically depend on either homologous recombination or end-joining (So et al. 2017). Thus, chromosome instability and processes such as nonallelic homologous recombination result in “hotspots” of structural variants near highly repetitive sequences (Coghlan et al. 2005; Nesta et al. 2021). Transposable elements (TEs) are repeated mobile DNA sequences whose activity can lead to mutations by means of excision and insertion. Such events can occur in functionally important sequences (van't Hof et al. 2016). In addition, TEs can contribute to new genes and regulatory sequences (Long et al. 2013; Chuong et al. 2017; Etchegaray et al. 2021) and can also cause diverse types of SMs, either from nonallelic homologous recombination between interspersed TE copies or directly as a consequence of transposition. For example, LINE retrotransposons occasionally promote large deletions upon aberrant insertion into the genome (Rodriguez-Martin et al. 2020) and can act as substrate for ectopic recombination, resulting in diverse types of SM (Balachandran et al. 2022).
SMs have been found to be common but tend to be present in populations at low frequencies, owing to their deleterious effects (Chakraborty et al. 2019). This suggests that they contribute to a genomic architecture of rare alleles with high effect sizes and could reveal new insights concerning the genomic architecture of human complex traits (Cmero et al. 2020; Gao et al. 2023; Olson et al. 2023). For example, information on structural variation in genome-wide association studies can contribute to narrowing the missing heritability gap for human diseases (Billingsley et al. 2023; Kaivola et al. 2023). Despite their broad importance, our understanding of how SMs originate and at which rates remains limited. Long-read sequencing is a relatively new technology for improving SM discovery (Hollox et al. 2022), and its application promises a more comprehensive description of the spectrum of new mutations. For example, Pacific Biosciences (PacBio) long reads have been used to discover de novo mutations in MA lines of the green alga Chlamydomonas (López-Cortegano et al. 2023), revealing that 5% of mutations are SMs and highlighting the important contribution of active TEs in shaping the SM spectrum. Current estimates of SM rates in mammals are limited to studies that used short-read technology (Uchimura et al. 2015; Collins et al. 2020; Belyeu et al. 2021; Flynn et al. 2021; Lee et al. 2023; Steensma et al. 2023), but this may result in an inferred SM spectrum that is biased toward simple copy-number variants. The main objective of the present study is to obtain the complete spectrum of the new SMs that have accumulated in an MA experiment in mice that does not suffer from the above limitation.
In addition to enabling the detection of large SMs, long-read technology also offers a more robust means than short-read sequencing for identifying mutations within highly repeated regions, such as microsatellite sequences. This capability also enables the accurate estimation of the rate of indels, which we arbitrarily define here as insertions and deletions shorter than 50 bp, including microsatellite contractions and expansions. It is notable that even in compact bacterial genomes, long-read sequencing has led to improved indel rate estimates (Zhou et al. 2023). Copy-number variants of tandem repeats of 1–6 bp, known as simple sequences or microsatellites (Tautz 1993), have significant medical importance owing to their involvement in inherited and de novo acquired disorders (Mirkin 2007; Hannan 2018; Trost et al. 2020; Mitra et al. 2021). Indels and other mutations occurring within microsatellite regions are, however, frequently overlooked. In cases in which indel rates have been estimated in mice by short-read sequencing, they have generally been substantially lower than SNM rates (e.g., ∼5% of the SNM rate) (Uchimura et al. 2015). However, this may be because of the calling criteria, which excluded repeat regions (Uchimura et al. 2015). Similarly in humans, genome-wide indel rate estimates have been low (Ohno 2019). Limited evidence combining short- and long-read sequencing indicates that indel rates are higher than SNM rates (Sun et al. 2012; Kristmundsdottir et al. 2023), but these estimates are restricted to annotated microsatellites of 1–6 bp motifs and may not provide a comprehensive picture of the genome-wide indel rate or its association with sequence repetitiveness. Microsatellites and, more generally, tandem repeat sequences are known to be among the fastest evolving sequences. Consequently, when the genomic background of the aligned samples differs from the reference genome, short tandem repeats may be unusually susceptible to alignment failures. The use of long reads for assembling strain-specific reference genomes may therefore become an essential step for accurately detecting copy-number variations and SMs in fast-evolving sequences, such as repeats (Noyes et al. 2022).
The mouse is a well-established model mammal that has a relatively short generation time, allowing for the accumulation of a large number of mutations in a short time. Furthermore, the mouse genome is similar to humans, and this has been of immense value for biomedical research (Schofield et al. 2012; Groza et al. 2023). The mouse additionally serves as a model for evolutionary studies (Guénet and Bonhomme 2003; Harr et al. 2016). To gain a deeper understanding of mammal genome evolution, we conducted an MA experiment in mice. Lines were maintained by full-sib mating to minimize the effective population size and the effectiveness of selection acting on newly arising mutations. To study variation in the mutation rate among mouse strains, our experiment included MA lines of three different commonly used inbred mouse strains (C3H, C57BL/6, and FVB). We used PacBio HiFi technology to sequence four MA samples from each of the three strains after 8 to 15 generations of MA. To aid the analysis of the complex and repetitive mouse genome (Lilue et al. 2018; Nurk et al. 2022; Liao et al. 2023), we produced strain-specific chromosome-level assemblies for use as reference genomes in order to improve mutation calling and to avoid reference bias. By employing variant calling approaches based on both sequencing reads and genome assemblies, we investigated the rate and spectrum of new mutations in mice, thereby offering insight into the causes of variation among inbred strains, and the evolution of mammalian genomes.
Results
We used PacBio HiFi long reads from inbred mouse MA line founders of the strains C3H/HeNRj (C3H), C57BL/6JRj (BL6), and FVB/NRj (FVB) to generate chromosome-level assemblies (Supplemental Figs. S1–S4). These assemblies were then used as reference genomes for calling mutations. At the contig level, the assemblies have a mean N50 ≈ 50 Mb (Supplemental Table S1) and were thereafter nearly as contiguous as the current GRCm39 reference genome (N50 = 59.5 Mb), which is derived from the C57BL/6J strain. They are also substantially more contiguous than the current C3H/HeJ v3 and FVB/NJ v3 reference genomes (N50 ≈ 2–8 Mb). We subsequently defined ∼96% of the genome as “callable” for each strain (Supplemental Table S2), namely, the sites where mutations could be called with high confidence (see Methods). Uncallable sites were usually located within highly repetitive acrocentric centromeres (Supplemental Figs. S1–S3). Chromosome X had a lower callability in BL6 and FVB than in C3H (i.e., ∼74% vs. 93%) (Supplemental Table S2), presumably owing to the somewhat lower contiguity of the former two assemblies (Supplemental Table S1) and the high density of TEs on that chromosome (Supplemental Figs. S1–S3).
We also sequenced four MA samples from each strain after 8 to 15 generations of the MA experiment and built de novo assemblies for all samples. Subsequently, SMs were called from read alignments using Sniffles (Smolka et al. 2024), from assembly mappings using dipcall (Li et al. 2018), and from a multisample pangenome built with minigraph (Li et al. 2020). Leveraging the low error rate of our assemblies (genomic quality values QV > 45 on the Phred scale) (Supplemental Table S1), we employed DeepVariant (Poplin et al. 2018) to detect SNMs and indels from read alignments. All variant calls were merged, filtered and curated, guided by the visualization of read and assembly alignments using the Integrative Genomics Viewer (IGV) (Robinson et al. 2011), among other tools (see Methods).
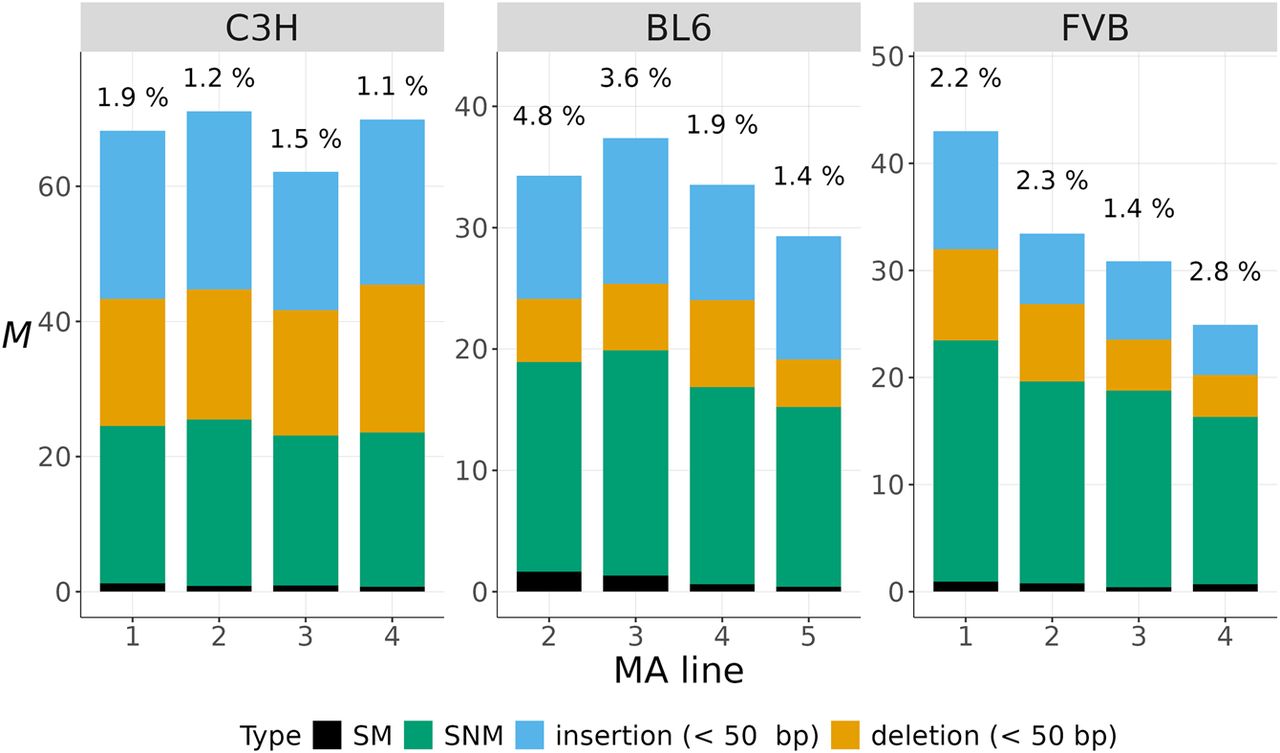
A list of the types and location of the mutations found in this study is provided in Supplemental Tables S3–S5. The average mutation rate, including all types of mutations across mouse strains, was calculated as M = 44.8 mutations per haploid genome per generation (corresponding to μ = 1.80 × 10⁻⁸ mutations per nucleotide site per generation). Mutation rates for each MA sample by type of mutation are detailed in Supplemental Table S6 and displayed in Figure 1. The spectrum of mutations was dominated by SNMs and indels, which occurred at similar rates, and comprised 33% to 66% of mutations across samples (Fig. 1). The proportion of SMs ranged from ∼1% to 5% (Fig. 1). In the sections below, we briefly detail results for SNMs and then elaborate on the rate and spectrum of new indels and SMs.
The complete spectrum of new mutations. The mutation rate per haploid genome per generation (M) for different types of mutations (in colors) is shown for four MA samples from each strain. The percentages at the top of each bar indicate the proportion of SMs.
Single-nucleotide mutations
Based on the discovery of 2981 SNMs, we estimate that approximately 20 new SNMs arise de novo per haploid genome per generation in the mouse MA lines (i.e., M = 19.6 and μ = 7.86 × 10⁻⁹ SNMs per site per generation). This estimate falls within the range of previous estimates obtained using short-read sequencing (Adewoye et al. 2015; Uchimura et al. 2015; Milholland et al. 2017; Lindsay et al. 2019). It is also close to the estimate of μ = 7.9 × 10⁻⁹ obtained by Chebib et al. (2021) based on the observed number of SNMs segregating in the founders of our MA experiment. Moreover, this estimate is not significantly different from our recent estimate obtained by Illumina sequencing of 59 MA line samples (μ = 6.7 × 10⁻⁹; Wilcoxon rank-sum test, P = 0.07) (López-Cortegano et al. 2024). The spectrum of SNMs differs from the expectation based on equally frequent SNM types and a GC content of 41.7% and is characterized by a strong bias toward C→T transitions. Furthermore, nearly one-third of C→T mutations occur at methylated CpG sites (Supplemental Fig. S5). In the FVB samples, there was also a marked twofold bias toward C→A transversions, which agrees with previous studies in this strain (Supplemental Fig. S5; Dumont 2019; López-Cortegano et al. 2024). Overall, the SNM spectra were similar to what we previously observed based on Illumina sequencing (χ2 test, χ25 < 0.4, P > 0.9) (López-Cortegano et al. 2024).
Indels
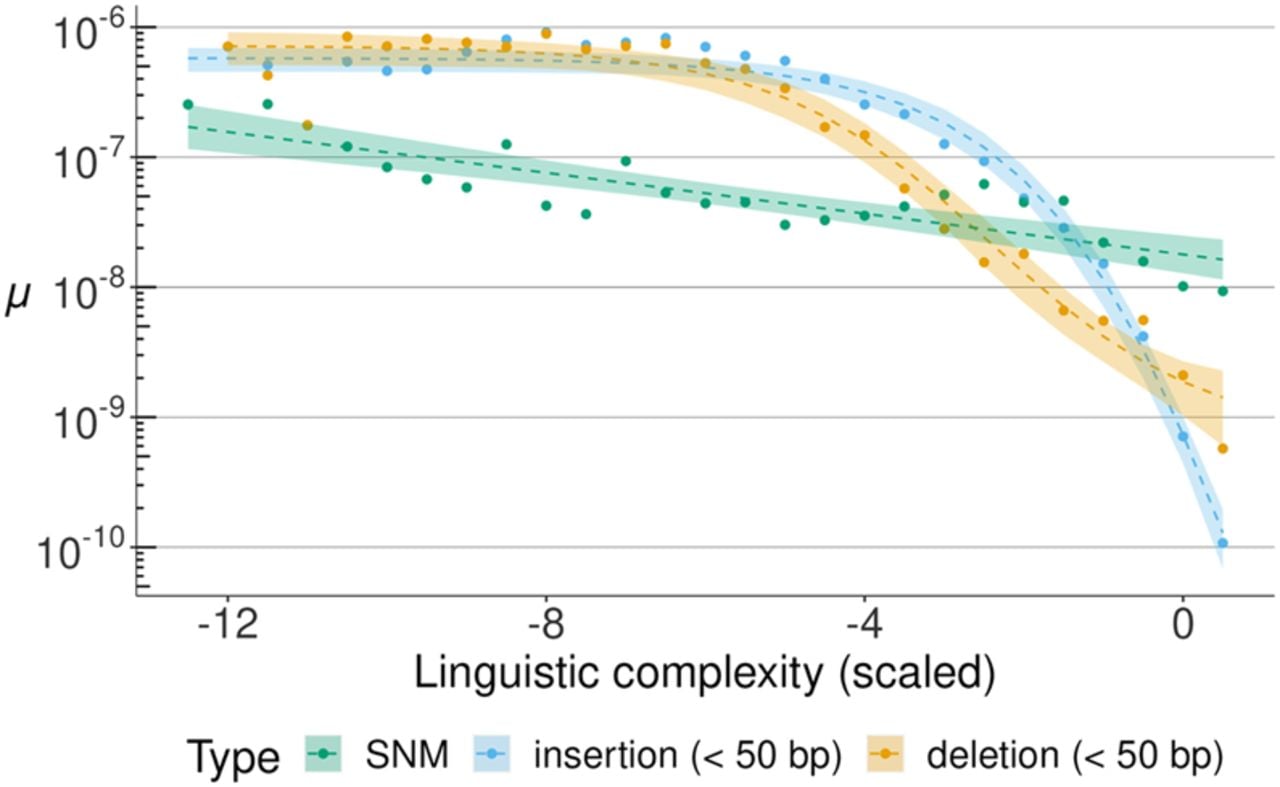
We identified a total of 3997 indels, resulting in a rate of M = 24.4 indels per haploid genome per generation (μ = 9.76 × 10⁻⁹). Overall, this rate is slightly higher than that observed for SNMs. Compared with previous studies in mice based on short-read sequencing, the higher rate of indels in this study can be largely attributed to the inclusion of microsatellite contractions and expansions, because 90.5% of indels occurred in sites annotated as microsatellites (Supplemental Table S4). Considering the total length of microsatellite sequences within the callable genome, the average indel rate in sites annotated in microsatellites was two orders of magnitude higher than the rate for nonannotated regions (μ = 1.02 × 10⁻⁷ vs. μ = 1.05 × 10⁻⁹). To better understand the association of indels with tandemly repeated sequences, we investigated the relationship between the mutation rate and the linguistic complexity of the nucleotide sequence, which is a measure of the degree of sequence repetitiveness (Orlov and Potapov 2004). In the C3H data, we observed that on a logarithmic scale the rate of both insertions and deletions increased by almost three orders of magnitude, from μ ≈ 10−9.5 in genomic regions with average repetitiveness (near-zero scaled linguistic complexity) to μ ≈ 10−6 in the most repetitive, least complex sequences (Fig. 2). The rate of SNMs increased approximately linearly from μ = 10−7.7 to 10−8.7 (Fig. 2). We also observed similar relationships between the mutation rate and sequence repetitiveness in the other mouse strains and in data from an MA experiment in the green algae Chlamydomonas reinhardtii (Supplemental Fig. S6; López-Cortegano et al. 2023). The association of the mutation rate with a quantitative measure of sequence repetitiveness also confirms a previous hypothesis on the role of tandem repeats and irregularly spaced repeats as a source of genetic variation (Tautz et al. 1986).
Relationship between SNM and indel rates (on a log10 scale) and sequence repetitiveness. Sequence repetitiveness was measured as the linguistic complexity of 101 bp genomic windows and then scaled to standard deviation units, with a mean of zero. On this scale, more negative values indicate more repetitive sequences. The observed rates of different types of mutations (in colors) are shown in data points. Dashed lines represent regression model fits of mutation rate against linguistic complexity. For SNMs, a linear model was fitted, whereas indel data fitted best a logistic regression; 95% confidence intervals are presented for all regression models.
We observed that insertions occurred ∼30% more frequently than deletions, but deletions were slightly longer than insertions on average (4.54 vs. 3.93 bp; Wilcoxon rank-sum test, P = 1.24 × 10⁻²) (Supplemental Fig. S7). The spectrum of new indels was strongly biased toward 4 bp insertions and deletions in all strains, and these represent 66.3% of indels (Supplemental Fig. S7A). Almost all (99.2%) of these 4 bp indels are associated with microsatellite sequences. Among the indels identified in microsatellites (which comprise 90.5% of all indels), the most common microsatellite sequence motif was AGAT (>44%, Supplemental Fig. S7B), highlighting its hypermutability in mice. Our data do not, however, allow us to determine whether modifiers of the indel rate are present in any of the strains (Maksimov et al. 2023). Regarding indels of other lengths, 95.5% involved contractions and expansions of microsatellites that have a motif length equal to the indel length or an integer multiple/divisor of it (Supplemental Fig. S7C), consistent with polymerase slippage as a mechanism of mutagenesis (Ellegren 2004; Montgomery et al. 2013). Short (1 bp) indels predominated in the spectrum of indels unrelated to microsatellite annotation (66.9%) (Supplemental Fig. S7A).
Structural mutations
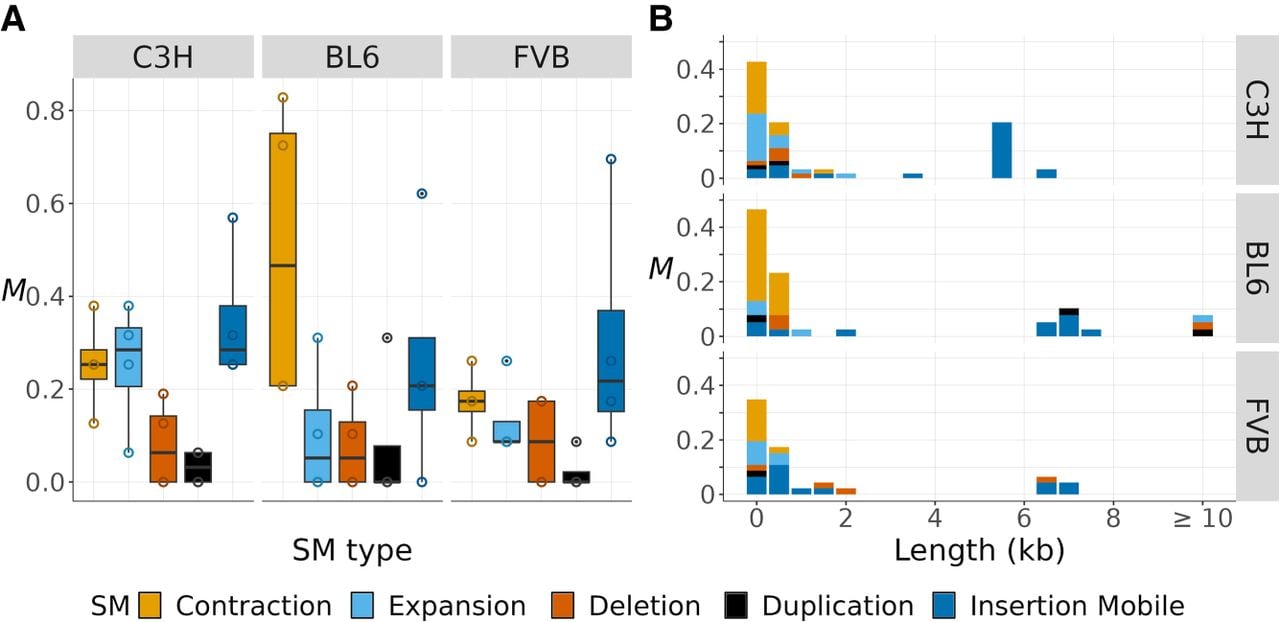
Although the strain-specific reference assemblies derived from the MA line founders are highly contiguous, >74% of the variant calls obtained from the assembly mapping methods were rejected as false positives following manual visualization of read alignments in IGV, underscoring the need for improved assembly mapping, alignment, and calling methods, particularly for long tandem repeats. In total, we report the discovery of 133 de novo SMs (61 in C3H, 39 in BL6, and 33 in FVB) (Supplemental Table S5). On average, we estimate that about one SM arises de novo per haploid genome per generation in the mouse genome (i.e., M = 0.90 and μ ≈ 3.60 × 10⁻¹⁰), and there is no statistical difference in the rate among strains (Kruskal–Wallis test [KW test], χ22 = 0.81, P = 0.67). Among the different types of SM, their rates were also similar across strains (KW test, χ22 < 2.84, P > 0.24) (Fig. 3A). Out of eight possible categories of SMs considered, only five were found. These are contractions and expansions of tandem repeats, deletions, duplications, and insertions of mobile elements. We found no evidence of new inversions, translocations, or excisions of mobile elements. Based on their rates and length distribution, the spectra of SMs can be categorized into two main types of mutations (Fig. 3B). SMs <1 kb are predominantly contractions and expansions of tandem repeat sequences. The spectra of SMs >1 kb differ to a greater extent among strains and are dominated by TE insertions, with remarkable variation in the types of active TEs (see below). SMs >10 kb were only present in BL6.
Rates and spectra of SMs for three mouse strains. (A) The SM rate per haploid genome per generation (M) is plotted as open points and boxplots for different types of SMs (in colors). Data points represent individual MA samples. (B) The spectrum of new SMs by rate (M) and length (in kilobases, rounded to the nearest 0.5 kb).
Tandem repeat mutations, which include contractions and expansions, are the most common type of SM, contributing M = 0.47 genome-wide (corresponding to μ ≈ 1.88 × 10⁻¹⁰). However, their rate is likely underestimated because highly repetitive sequences are more likely to be uncallable (Supplemental Figs. S1–S3). Additionally, the genome-wide rate of tandem repeat mutations can be recalculated to account for the fact that these mutations can only be called in tandem repeat sequences. This adjustment increases the mutation rate approximately 10-fold, implying a rate of about μ ≈ 2.18 × 10⁻⁹ mutations per tandem repeat site per generation.
Although most contractions and expansions were <1 kb, we observed a single instance of an expansion of a ∼3 kb TCTTCT satellite into a higher-order repeat, possibly >100 kb (Supplemental Fig. S8). Although DNA strand slippage during the polymerization reaction is commonly implicated in short tandem repeat mutations (Schlötterer and Tautz 1992; Ellegren 2004), this cannot explain large expansions such as the one described here. An alternative mechanism is proposed in the Discussion section.
Repeat sequences were also commonly involved in deletions (M = 8.12 × 10⁻², μ ≈ 3.26 × 10⁻¹¹) and duplications (M = 4.37 × 10⁻², μ ≈ 1.76 × 10⁻¹¹). To elucidate the mechanisms underlying deletions and duplications, we searched for evidence of homology between their breakpoints, following the method of Belyeu et al. (2021). Our analysis revealed that only the shortest (113 bp) and the two longest (6.5 and ∼45 kb) deletions appeared to have arisen through nonhomologous end-joining repair of double-strand breaks. Most (75%) of the remaining deletions could be attributed to homology-mediated DNA repair mechanisms. Among these, three deletions ranging in length between 600 and 1500 kb could be attributed to homologous recombination between interspersed paralogous sequences, namely, nonallelic homologous recombination. These included deletions of regions flanked by repeat annotation, such as TEs, and the deletion of previously duplicated TE sequences (Supplemental Fig. S9). Another six deletions ranging in length between 200 and 2100 bp could be attributed to microhomology-mediated end-joining involving homology tracts <10 bp (Supplemental Fig. S9). Microhomology-based mechanisms of DNA repair, such as break-induced replication, can be mutagenic (Kramara et al. 2018), and we observed evidence of this. Two deletions attributed to microhomology-mediated repair were only separated by 63 bp, whereas another was in close proximity to a 147 bp duplication. Among the remaining five duplications in our data set, three could be explained by nonallelic homologous recombination (Supplemental Fig. S10). Finally, the two smallest duplications, which are shorter than 150 bp, could not be attributed to any homology-mediated mechanism.
Mobile elements
Insertions of mobile elements occurred at an average rate of M = 0.30 per haploid genome per generation (corresponding to μ ≈ 1.22 × 10⁻¹⁰) (Fig. 3). This rate suggests that the majority (60%) of individuals in a mouse population experience one new insertion per generation. Most (∼93%) mobile insertions were owing to TEs, with the exception of three gene retrocopies in the FVB strain and one in C3H (see below). We found substantial heterogeneity in the rate and spectra of mobile elements among MA samples of the same strain (Fig. 4).
Mobile insertions. The rate of insertions per haploid genome per generation (M) is shown by MA sample (on the y-axis) and type of mobile element (in colors).
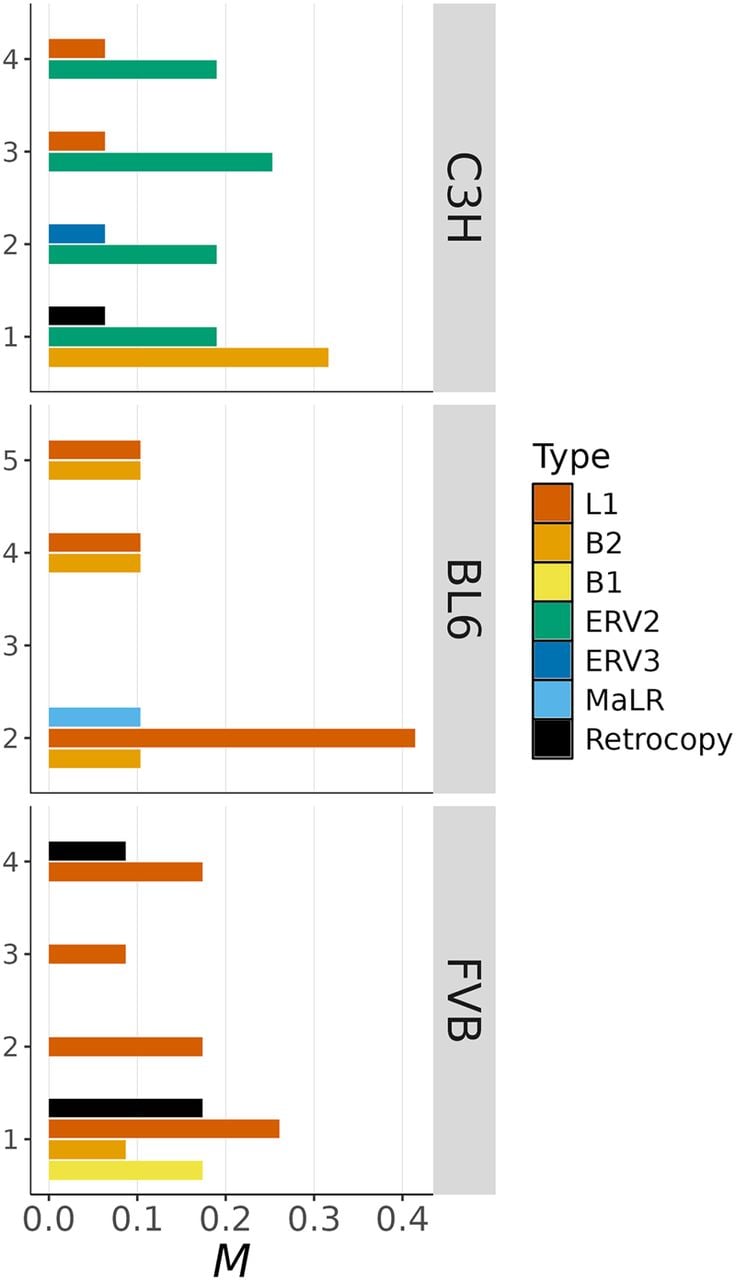
All active TEs identified corresponded to class I transposons (i.e., retrotransposons). The most active TEs in BL6 and FVB samples were long interspersed element-1 (LINE-1 or L1) transposons (MBL6 = 0.155 and MFVB = 0.174, vs. MC3H = 0.032). However, there was a notable difference in the length of L1 insertions between BL6 and FVB, BL6 exhibiting large and nearly complete L1 elements insertions (ranging from 6.5 kb to 7.3 kb), whereas 50% of L1 insertions in FVB were 5′-truncated to lengths <1.6 kb. Although L1-dependent nonautonomous transposons were mobilized in all strains, their activity was most pronounced in the FVB samples (MFVB = 0.261, vs. MC3H = 0.105, and MBL6 = 0.078). The majority (82%) of insertions of L1-dependent short interspersed elements (SINEs) were of type B2 (∼82%), whereas B1 SINE insertions were only observed in one FVB sample.
In contrast to BL6 and FVB, TE activity in C3H was predominantly caused by endogenous retroviruses (ERVs). Among these, intracisternal A-particles (IAPs) (Kuff and Lueders 1988) were the most active TEs in this C3H, inserting at similar rates among samples of this strain (M ≈ 0.206) (Fig. 4). IAPs are indeed a type of ERV that is known to be highly active in C3H mice (Ferraj et al. 2023). We identified only one insertion of a 6.3 kb murine ERV in a single C3H sample, but ERV activity was also evident in BL6 via the insertion of a large (1.9 kb) ERV3-dependent nonautonomous TE named “mammal apparent LTR retrotransposon” (MaLR).
To gain further insight into TE activity in the three mouse strains, we used the megablast algorithm (Camacho et al. 2009) to trace individual TE insertions back to their putative mother copies in the MA line founders’ genomes. For this analysis, only fully autonomous TEs that had multiple insertions in our samples were considered. By filtering the BLAST results by their highest score, all matches had sequence identities >99% and an E-value of zero. We found that nearly all (∼70%) IAP insertions were derived from unique mother copies not shared by other insertions (Supplemental Table S7), contradicting the hypothesis that low-copy “master copies” exist in the genome and are responsible for most recent insertion events (Rebollo et al. 2020). This result is further evidenced by the highly variable length of IAP insertions, which ranged from 5283 bp to 5491 bp (Supplemental Table S7). Among L1 insertions >500 bp, all were traced back to unique copies in the C3H, BL6, and FVB MA founder genomes.
In addition to TE insertions, we also found four gene retrocopies (i.e., RNA-mediated gene duplications). Retrocopies were identified by using BLASTX to query DNA insertions against the release 106 of the Ensembl peptide library of the GRCm39 reference, which returned 100% sequence identity in all cases. One large retrocopy (3.3 kb long) in C3H corresponded to the gene S-adenosylmethionine decarboxylase 1 (Amd1). The remaining retrocopies were in FVB and corresponded to the bromodomain containing 2 (Brd2), 60S ribosomal protein L12 (Rpl12), and the survival motor neuron 1 (Smn1) genes. Independent retrocopies of two of these genes (Brd2 and Smn1) were also detected in retrocopy surveys of natural mouse populations (Zhang et al. 2021; Zhang and Tautz 2022). According to the EBI Gene Expression Atlas (Kapushesky et al. 2010; Moreno et al. 2022), these genes are highly expressed in the testis and more so than in the ovaries (Supplemental Fig. S11). This parallels the known effect of paternal age on SNM rates (Kong et al. 2012), suggesting that new retrocopies might predominantly originate in males. Additionally, it implies that the actual rates of de novo retroposition could effectively double our rate estimates (see below), because retrocopies would primarily arise in the male germline. Retrocopies were present in C3H and FVB samples with many insertions of L1 or L1-dependent elements (Fig. 4), suggesting high L1 activity. The rates of retroposition in these two strains were MC3H = 1.58 × 10⁻² and MFVB = 6.52 × 10⁻². The combined rate of new retrocopies across strains and MA samples was M = 2.70 × 10⁻², a rate substantially higher than previously described in mammals (Ewing et al. 2013).
Discussion
Characterizing the complete spectrum of new mutations is important for understanding the origin and nature of genetic variation. However, mammalian genomes are complex and are rich in repeat sequences, and this complicates the analysis of new variation arising from mutation. Many previous studies on the rate of de novo mutation in humans and mice have focused solely on SNMs (e.g., Kong et al. 2012; Lindsay et al. 2019). Several studies have also reported rates of de novo structural variation in mammals (e.g., Kloosterman et al. 2015; Belyeu et al. 2021; Steensma et al. 2023), but these studies have employed short-read technology, which limits the SMs detected primarily to copy-number variants and hinders the discovery of mutations within repetitive sequences. Here, we provide the first estimates of the de novo mutation rate in the house mouse (Mus musculus) obtained from long-read sequencing of individuals from MA lines. To avoid reference bias and minimize false-positive variant calls, we built strain-specific chromosome-level assemblies from the MA line founders. Using a combination of read and assembly-based approaches, we obtained estimates of the SNM rate that are highly consistent with previous estimates from the same lines based on Illumina sequencing. We estimate that each individual mouse experiences approximately 90 new mutations per generation, of which ∼54% are indels. Additionally, we find that SMs comprise ∼2% of new mutations, involving ∼1.5 kb of sequence change per generation and accounting for >90% of the changes in base pairs, which presumably have larger effects on quantitative phenotypes and fitness-related traits than SNMs and indels (Chakraborty et al. 2019; Mérot et al. 2020).
We show that the degree of sequence complexity is strongly associated with the mutation rate (Fig. 2; Supplemental Fig. S6). About 90% of indels in our study occurred within low complexity, highly repetitive microsatellite sequences, a sequence class that is usually excluded from short-read analyses. In cases in which indels have been included, short-read sequencing has yielded lower estimates of indel rates, but this is likely because of challenges in variant calling in repetitive regions. For example, Uchimura et al. (2015) reported an indel rate of μ = 3.1 × 10⁻¹⁰, consistent with our estimate in the least repetitive regions (μ ≈ 3.2 × 10⁻¹⁰, μ ≈ 10−9.5 in Fig. 2).
Our finding that indel rates may be considerably higher than previously believed has important implications across several fields. Tandem repeat mutations are implicated in numerous medical conditions and disorders (Mirkin 2007), including cancers (Vilar and Gruber 2010). Moreover, it has been proposed that tandem repeat contractions and expansions could explain part of the missing heritability for quantitative traits, because these variants are often undetected in the absence of dedicated analysis techniques. These variants, however, may have substantial effects on quantitative traits (Gymrek and Goren 2021; Mukamel et al. 2021). Our findings in mice suggest that indel rates in other mammals may also exceed current estimates (Venn et al. 2014; Harland et al. 2018; Deng et al. 2019; Ohno 2019). However, it is noteworthy that a substantial fraction of indels are associated with “AGAT” microsatellite instability. The reasons for the hypermutability of “AGAT” microsatellites is unknown to us, as is whether this phenomenon extends to other species.
Tandem repeat mutations, such as indels and large contractions and expansions, can be explained by stepwise models of DNA strand slippage or nonallelic homologous recombination, also known as ectopic recombination. However, the mechanisms underlying the expansion we observed affecting many repeat copies (Supplemental Figs. S7, S8) remain poorly understood. For example, mutations such as the 30-fold expansion of a 3 kb satellite in MA sample BL6 2 (Supplemental Fig. S8) cannot be explained by processes such as DNA strand slippage. An alternative mechanism, extrachromosomal rolling-circle replication followed by reinsertion, has been proposed as a mechanism for the amplification and dispersal of satellite DNA (Garrido-Ramos 2017). Evidence suggests that this mechanism is active in vertebrates (Rossi et al. 1990; Feliciello et al. 2006; Cohen et al. 2010) including in the human germline (Henriksen et al. 2022). It is possible that this mechanism could explain the expansion of a large DNA satellite in MA sample 2 of BL6 (Supplemental Fig. S8). The same mechanism could also explain previous results in mice involving tandemly repeated small nucleolar regulatory RNA (SNORD) loci, in which inter-generational changes in the copy number of SNORD repeats were observed (Keshavarz et al. 2021). However, SNORD clusters consist of tandem repeats that are substantially longer than the PacBio reads obtained here, and we were unable to detect evidence of copy-number variation in these loci. De novo extrachromosomal circular DNA (eccDNA) variants have previously been observed to be transmitted in the germline (Stoll and Roth 1983; Turner et al. 2008), but the use of the circular consensus sequencing (CCS) mode with PacBio, which involves circularizing DNA, did not allow the analysis of eccDNA in our study.
In addition to tandem repeats, interspersed repeats can mediate large SMs, such as deletions and duplications, via homology-dependent mechanisms (Supplemental Figs. S9, S10). Indeed, ectopic recombination is widely recognized as a major contributor to structural variation in the genome (Gray 2000; Parks et al. 2015; Belyeu et al. 2021; Balachandran et al. 2022), and many instances are mediated by copies of TE sequences. Interspersed TE sequences represent a substantial fraction of mammalian genomes and have been linked to genome size evolution (Naville et al. 2019). Considering all types of SM, we estimate that the mouse genome expands at an average rate of ∼1 kb per generation and that TEs contribute ∼70% of this expansion. TEs are also recognized to play important and diverse roles in adaptation, health, and genome evolution (Konkel and Batzer 2010; van't Hof et al. 2016; Ricci et al. 2018). For example, both L1 and IAP elements can contribute regulatory sequences that could reshape the transcription landscape (Ferraj et al. 2023). TE insertions stand out in our data because of their high rates relative to other types of SM (Fig. 3) and their diverse spectrum among samples and strains (Fig. 4). Notably, we detected movement of IAP elements, a kind of element that is known to be highly active in C3H mice (Gagnier et al. 2019; Rebollo et al. 2020). We also saw movements of L1 elements in all strains, and this is expected because these elements are believed to be 20–30 times more active in mice than in humans (Gagnier et al. 2019). Our analyses appear to suggest a substantially higher rate of de novo TE insertion in mice than in humans (Maksakova et al. 2006; Feusier et al. 2019), but future pedigree-based studies in humans using long-read technology may lead to higher estimates of TE insertion rates.
Additionally, pedigree-based studies could help determine whether LINEs and SINEs are predominantly inherited via the male germline. A previous study estimating the TE insertion bias from polymorphic TE variants on Chromosome X and the autosomes suggested that the majority of TE insertions occur in the male germline (Nellåker et al. 2012). Consistent with this result, the transcription profile of retrocopied genes in our study (Supplemental Fig. S11) suggests that TEs, particularly LINEs, are most active in the male germline. Because our MA experimental design minimizes selection, our results also suggest that the high rate of parentally inherited de novo TE insertions could be owing to distinct TE suppression pathways between male and female germlines (Almeida et al. 2022). A previous estimate for the generation of new retrocopies obtained by comparing two closely related natural populations of mice suggested a rate of 200 new retrocopies per 10,000 years (Zhang et al. 2021), approximately equivalent to M = 1 × 10⁻², assuming two generations per year. The rates MC3H and MFVB observed in the MA lines are higher than this estimated rate for natural populations, supporting the idea that retrotransposed copies are subject to negative selection owing to frequent interference with the expression of the parental genes (Zhang et al. 2021). Finally, it is noteworthy that rates of TE insertion were similar among strains, yet there was substantial variation in the spectra of active TEs (Fig. 4). This finding is biologically meaningful, because different TEs have the potential to cause distinct types of SMs (López-Cortegano et al. 2023) and to induce differential changes in chromatin state (Ferraj et al. 2023), which may be key for understanding the evolution and divergence of closely related lineages. Given the similarities in the relative abundances of TEs and their evolutionary ages across each strain's genome (Supplemental Fig. S12), the observed differences in active TE spectra are likely because of variations in TE suppression machinery. The highly polymorphic family of Krüppel-associated box zinc finger proteins (KRAB-ZFPs), known to bind and repress TEs in mammals (Wolf et al. 2020), varies in gene copy number among the three strains we studied (Supplemental Fig. S13) and also in natural populations of mice (Pezer et al. 2015). This supports the idea that structural changes in clusters encoding KRAB-ZFPs may underlie differences in the rates and spectra of active TEs.
Many of the new mutations occurring in mice seem to be mediated by various types of repeats, as repeat sequences underlie many of the SMs observed, and greatly increase the rate of SNMs and indels. Although we used long-read sequencing technology, it is possible that we underestimated rates for contractions and expansions in large, uncallable tandem repeat regions. In our study, these regions include the centromeres (Supplemental Figs. S1–S3), which are acrocentric in mice and consist of repeated ∼120 bp motifs forming tens to hundreds of kilobases of long satellite sequences (Iwata-Otsubo et al. 2017; Packiaraj and Thakur 2024). Rodents are karyotypically diverse (Bengtsson 1980) and have experienced more chromosome rearrangements than other mammals, including primates (Bourque et al. 2004). Cytogenetic evidence (Patton and Sherwood 1983; Piálek et al. 2005) suggests that these rearrangements may frequently involve the centromeres (e.g., pericentric inversions and Robertsonian fusions and fissions), which would go undetected in our study. However, it should be noted that previous evidence suggests that chromosome rearrangements are rare in mouse inbred lines. For example, a comparison of our MA founders’ genome assemblies with previous assemblies for the same strains (Lilue et al. 2018) revealed that the only large rearrangement was a 58 Mb inversion (Supplemental Fig. S4), previously described by Akeson et al. (2006) in C3H/HeJ mice. This suggests that inversions and translocations in mice could be highly deleterious or occur at extremely low de novo rates. However, it has been suggested that inversions may have high rates in other mammalian taxa (e.g., in gibbons) (Mercuri et al. 2022). The use of ultralong reads (e.g., Oxford Nanopore Technologies) could help resolving large repeats in genome assemblies and enhance the detection of SMs. Nevertheless, further investigation is required to fully understand the complete spectrum of new mutations, which will depend on the development of improved and more accessible long-read sequencing technologies, along with tools for analyzing large tandem repeats.
Methods
Biological samples, high-molecular-weight DNA extraction, and sequencing
The mouse samples sequenced in this study were part of an MA experiment described in parallel studies (Chebib et al. 2024; López-Cortegano et al. 2024). Briefly, one pair of inbred founders from each of the three mouse strains C3H/HeNRj (C3H), C57BL/6JRj (BL6), and FVB/NRj (FVB) were obtained from Janvier Labs (https://janvier-labs.com), and mated within the facilities of the Max Planck Institute for Evolutionary Biology. From the founders, mice were bred by full-sib mating to establish MA lines for each strain. The C3H, BL6, and FVB MA lines were bred for 15, 8, and 10 generations, respectively. The shorter duration of the BL6 and FVB experiments reflects their discontinuation prior to the opportunity to sequence MA samples from multiple strains with long reads. To limit the influence of environmental factors, all mice were maintained under similar conditions in individually ventilated cages (green line, Tecniplast), with the same diet (“1328 forti” pellets, Altromin). We also limited the effect of paternal age on the rate of mutation by breeding mice within a narrow range of ages (∼12 and 20 weeks) (López-Cortegano et al. 2024). Maintenance and handling procedures adhered to the German animal welfare law (Tierschutzgesetz) and the Federation of European Laboratory Animal Science Associations (FELASA) guidelines. The necessary permits for housing and caring for the mice were acquired from the local veterinary office “Veterinäramt Kreis Plön” (permit number PLÖ-0004697).
We sequenced the C3H, BL6, and FVB founders and four mice from each strain randomly selected from different MA lines. High-molecular-weight (HMW) DNA was extracted from 8 to 15 mg of kidney tissue using the Bionano animal tissue DNA isolation kit (Plug Lysis). DNA was then eluted into TE buffer and sequenced at the Max Planck Institute of Molecular Cell Biology and Genetics using the PacBio Sequel II platform with the CCS mode to generate HiFi reads. The read coverage values for each sample are given in Supplemental Table S1.
Raw PacBio files were processed with ccs 6.4.0, part of the PacBio pbccs package (https://ccs.how/), using the option “‐‐hifi-kinetics” to generate highly accurate consensus HiFi reads with kinetic information for 5-methylcytosine (5mC) prediction. Details on the prediction of 5mC sites are given in the Supplemental Material.
Genome assembly
De novo contig-level assemblies were generated for all samples sequenced using hifiasm 0.16.1 (Cheng et al. 2021, 2022). Unless otherwise stated, two partially phased assemblies returned by hifiasm for each mouse were used. These partially phased assemblies provide information of the diploid genome, but accurate phasing was not possible in the absence of Hi-C data or sequencing data from the parents.
Chromosome-level assemblies were generated for each strain using the data from two MA founders. To do so, highly contiguous primary assemblies were first generated to the contig level with hifiasm using a pool of PacBio HiFi reads from the MA founders, following the assumption that the two full-sib inbred founders are nearly identical at the sequence level (Chebib et al. 2021). When running hifiasm on the MA founders, the option “-l0” was invoked to disable the purge duplication step, as recommended for primary assemblies from highly inbred genomes. Raw assemblies were then filtered to retain only high-quality contigs that have at least 5× mean read coverage support and a minimum length of 30 kb. Finally, the polished assemblies were mapped for manual scaffolding to the GRCm39 reference genome (NCBI Genomes database [https://www.ncbi.nlm.nih.gov/home/genomes/] assembly accession GCA_000001635.9). C3H and FVB assemblies were also validated following their mapping against the C3H/HeJ v3 (GCA_921997125.2) and FVB/NJ v3 (GCA_921998635.2) reference genomes, respectively. Further details can be found in the Supplemental Material.
Genome alignment
As described below, we used three distinct variant calling methods to detect SMs, each based on a different genome alignment approach. First, aligning individual MA sample reads to the reference genome. Second, aligning individual MA sample assemblies to the reference. Third, aligning assemblies from multiple MA samples into strain-specific “pangenomes.” In all cases, the chromosome-level assemblies of each strain served as reference genomes.
Read alignments were produced with the PacBio recommended software pbmm2 1.7.0 (https://github.com/PacificBiosciences/pbmm2), using the “‐‐preset HIFI” option. Read alignment files were further processed with the command “calmd” from SAMtools v.1.13 (Danecek et al. 2021) in order to retain mismatching positions in the reads. Assembly alignments for single MA samples were produced with minimap2 v.2.24 (Li 2018), including the option “-x asm5” for the alignment of assemblies that have low divergence from the reference. Pangenomes were produced with the software minigraph 0.17 (Li et al. 2020), using the recommended options “-c” for base alignment, and “-x ggs” to generate an output file in graphical fragment assembly (GFA) format. In addition, pangenomes were produced in hierarchical alignment (HAL) format with cactus 2.7.0 (Garrison et al. 2018; Armstrong et al. 2020) by applying the Minigraph-Cactus pangenome pipeline (Hickey et al. 2024).
Genome annotation
Gene annotation for the GRCm39 reference genome was downloaded from Ensembl (https://ftp.ensembl.org/pub/release-106/gff3/mus_musculus/). Gene coordinates from GRCm39 were transferred to the C3H, BL6, and FVB chromosome-level assemblies using the HAL pangenome files and the software halLiftover 2.1 (Hickey et al. 2013).
Repeat annotation was generated de novo for each reference genome by running RepeatMasker 4.1.2 (https://www.repeatmasker.org) with the option “-species ‘Mus musculus’” in order to include annotation of known murine repeats and TEs from the open library Dfam 3.3 (Storer et al. 2021). The repeat annotation produced by RepeatMasker was complemented with microsatellite and satellite sequences annotated by Tandem Repeats Finder (TRF) (Benson 1999), run with options “2 7 7 80 10 50 1000 -f -d -m -ngs.” When more than one TRF annotation overlapped a genomic site, we selected the annotation with the shortest repeat motif, and if several annotations remained overlapping a site, we then selected the longest annotation.
As a quantitative measure of sequence repetitiveness, we generated annotations for values of “linguistic complexity” (Orlov and Potapov 2004) using the software NeSSie (Berselli et al. 2018). Such a parameter is measured as the k-mer richness in a sequence, namely, the count of unique k-mers observed in a sequence over the maximum possible in that sequence length. Linguistic complexity was calculated at base-pair resolution (using option “-s 1”) in genomic windows of 50 bp extending upstream of and downstream from each reference site, and scaled to mean zero and to one standard deviation unit.
Callable sites
Only genomic sites where mutations could be called with high confidence were considered as “callable” sites. Here, we used a criterion similar to the one defined previously in a study of C. reinhardtii (López-Cortegano et al. 2023). The basis of this approach is to exclude highly repetitive regions where assembly mapping is inaccurate. The software minimap2 was used to map each sample's primary assembly against the reference genome, retaining only mapping sections with the highest mapping quality (MQ = 60). Then, coordinates when mapping failed for any sample were logged, and if the distance between these coordinates for any pair of samples was <30 kb, the entire region was deemed uncallable. Callable sites were further required to be supported by a minimum coverage of five reads for the two MA founders and for at least one MA sample. Because we observed that uncallable sites were usually colocalized with tandem repeat annotation >30 kb, we also removed these regions from the set of callable sites. Finally, uncallable regions at a distance <30 kb were merged together and deemed uncallable. It should be noted that using this criterion, uncallable sites will consist mostly of highly repetitive sequences (Supplemental Figs. S1–S3), and this will likely result in the underdetection of SMs in tandem repeats.
Identification of de novo SNMs and indels
We used DeepVariant 1.4.0 (Poplin et al. 2018) to call SNMs and indels from PacBio read alignments enabling the option “‐‐model_type=PACBIO.” A combined VCF containing mutation calls from all the samples was then generated with GLnexus 1.3.1 (Yun et al. 2021) using the configuration preset for raw DeepVariant VCF files (“‐‐config DeepVariant_unfiltered”). To improve indel variant calling, VCF files were postprocessed and left-aligned using gvcf_norm v.0.1.0 (https://github.com/mlin/gvcf_norm) and BCFtools norm 1.9 (Danecek et al. 2021). Mutation candidates were then filtered to retain biallelic sites where the mutation was unique to one MA sample, supported by a minimum of five reads, and a genotype quality (GQ) of 30 in the Phred scale. Homozygous calls required at least 75% of reads supporting the mutation, whereas heterozygous calls required between 25% and 75% of reads supporting the mutation. All calls were inspected visually using the Integrative Genomics Viewer (IGV) 2.13.2 (Robinson et al. 2011), and variants with ambiguous support were removed as false positives (e.g., Supplemental Fig. S14).
Identification of de novo SMs
We used a combination of read and assembly-based approaches to call SMs, followed by extensive manual curation. As mentioned above, each approach was based on alignments of different types of genomic data: reads, assemblies, and pangenomes.
SMs were called from read alignments with Sniffles 2.0.2 (Smolka et al. 2024). To ease the identification of mutations called in multiple samples, VCF files were merged using SURVIVOR v.1.0.7 (Jeffares et al. 2017). To call mutations from the assembly alignment of individual MA samples, we used the minimap2-based pipeline dipcall (Li et al. 2018). For all male samples, we included the pseudoautosomal region (PAR) as required by dipcall. Based on the mapping to the GRCm39 reference, the PARs were on Chromosome X with coordinates 160,721,147–161,549,611 for C3H, 162,666,591–163,590,379 for BL6, and 168,647,154–169,177,736 for FVB. SMs were also called from pangenome GFA files using the gfatools 0.4 command “bubble” (https://github.com/lh3/gfatools).
All SM calls were inspected visually in both read and assembly alignments using IGV, and those deemed not to be false positives (e.g., Supplemental Fig. S14) were classified into one of eight types: contraction or expansion of tandem repeats, deletion, duplication, excision or insertion of mobile elements (including TEs and retrogenes), inversion, and translocation. Consistent calls of a mutation in the reads and in the assembly alignments were necessary for the mutation to be considered genuine, and a minimum depth of five reads supporting the mutation was necessary. Large SM calls and chromosome rearrangements were also visualized in Ribbon v1.1 (Nattestad et al. 2021). Heterozygote SMs that were ambiguous in the partially phased assembly were inspected visually with Bandage 0.8.1 (Wick et al. 2015). Insertions and other SM breakpoints were queried with BLAST 2.13.0 (Camacho et al. 2009) against a local database of TEs and queried against the Dfam database (Storer et al. 2021; https://dfam.org) to identify known TE families. Self-to-self dotplots were also generated with the MAFFT v7 online server (Katoh et al. 2019) in order to visualize mutation calls, such as copy-number variants, aiding the determination of whether deletions and duplications calls corresponded to contractions and expansions of tandem repeats. In addition, only mutations that were unique to a single MA sample were considered as genuine mutations. Exceptionally, some TE families could be expected to excise in multiple samples if active, but no excisions were found. When contractions or expansions of different lengths occurred in the same microsatellite or satellite in different samples, each distinct contraction or expansion event was counted as a unique mutation. Similarly, if a MA line was heterozygous for two unique mutations (e.g., one contraction plus one expansion) in a tandem repeat, these were considered as two mutation events.
Calculation of the mutation rate
The per haploid genome per generation mutation rate (M) was estimated as M = Ni/Naj, where Ni is the total number of mutations found in sample i, and Na(j) is the number of ancestors in the strain j’s pedigree. To calculate the per nucleotide per generation mutation rate (μ), M was divided by 2Nc(j), where Nc is the length of the haploid callable genome of strain j. Additionally, both rates were multiplied to a correction factor (α) similarly as described by López-Cortegano et al. (2024). In short, α is calculated using a mutation dropping approach on each strain's pedigree to calculate the proportion of heterozygous and homozygous mutations expected to be recovered in the sequenced samples. Therefore, α accounts for two sources of bias: (1) the loss of mutations in unsequenced ancestors of the MA samples, and (2) the exclusion of genuine mutations that occurred early in the MA experiment and that were excluded because they were not unique to a single MA sample. The values of α used were 3.67, 3.00, and 3.22, for C3H, BL6, and FVB, respectively.
When calculating μ at specific regions, for example, at microsatellite sequences for indels, the value of Nc was adjusted accordingly. For SMs other than contractions and expansions, we considered providing μ estimates for repetitive and nonrepetitive regions. However, several challenges complicate their estimation and limit their interpretability. For example, deletions and duplications may contain repeats, but only repeats at the breakpoints are likely to be relevant. Specifically, for SMs mediated by nonallelic homologous recombination, only certain pairs of repeats could be involved, making it difficult to adjust Nc for “repetitive” versus “nonrepetitive” regions in a meaningful way. Regarding TE insertions, different TE families may have different target-site preferences and different values of μ at different contexts. Given these difficulties and the limited number of SMs detected compared to SNMs and indels, we did not partition the rates of SMs per genome annotations.
Data access
All PacBio HiFi reads and chromosome-level assemblies generated in this study have been submitted to the NCBI BioProject database (https://www.ncbi.nlm.nih.gov/bioproject/) under accession number PRJNA1112615.
Competing interest statement
The authors declare no competing interests.
Acknowledgments
We thank Cornelia Burghardt and Michaela Schwarz for laboratory work and handling the DNA sequencing and Kristian Ullrich for the CCS processing of BL6 and FVB PacBio reads. Analyses performed here made use of the high performance computing resources at the Ashworth Compute Co-operative Cluster (AC3) at the Institute of Ecology and Evolution of the University of Edinburgh. This project has received funding from the European Research Council under the European Union's Horizon 2020 Research and Innovation program (grant agreement no. 694212) and from institutional funds of the Max-Planck Society (Max-Planck-Gesellschaft).
Author contributions: E.L.-C., J.C., D.T., and P.D.K. conceived the study. E.L.-C. did the computational analyses. A.J., A.V., and S.K. generated the mouse lines and samples. E.L.-C. wrote the manuscript with contributions by P.D.K. and D.T.
Notes
[1] Supplementary material [Supplemental material is available for this article.]
[2] Article published online before print. Article, supplemental material, and publication date are at https://www.genome.org/cgi/doi/10.1101/gr.279982.124.
[3] Freely available online through the Genome Research Open Access option.
References
- ↵Adewoye AB, Lindsay SJ, Dubrova YE, Hurles ME. 2015. The genome-wide effects of ionizing radiation on mutation induction in the mammalian germline. Nat Commun 6: 6684. 10.1038/ncomms7684
- ↵Akeson EC, Donahue LR, Beamer WG, Shultz KL, Ackert-Bicknell C, Rosen CJ, Corrigan J, Davisson MT. 2006. Chromosomal inversion discovered in C3H/HeJ mice. Genomics 87: 311–313. 10.1016/j.ygeno.2005.09.022
- ↵Almeida MV, Vernaz G, Putman ALK, Miska EA. 2022. Taming transposable elements in vertebrates: from epigenetic silencing to domestication. Trends Genet 38: 529–553. 10.1016/j.tig.2022.02.009
- ↵Armstrong J, Hickey G, Diekhans M, Fiddes IT, Novak AM, Deran A, Fang Q, Xie D, Feng S, Stiller J, 2020. Progressive cactus is a multiple-genome aligner for the thousand-genome era. Nature 587: 246–251. 10.1038/s41586-020-2871-y
- ↵Balachandran P, Walawalkar IA, Flores JI, Dayton JN, Audano PA, Beck CR. 2022. Transposable element-mediated rearrangements are prevalent in human genomes. Nat Commun 13: 7115. 10.1038/s41467-022-34810-8
- ↵Bateman AJ. 1959. The viability of near-normal irradiated chromosomes. Int J Radiat Biol 1: 170–180. 10.1080/09553005914550241
- ↵Belyeu JR, Brand H, Wang H, Zhao X, Pedersen BS, Feusier J, Gupta M, Nicholas TJ, Brown J, Baird L, 2021. De novo structural mutation rates and gamete-of-origin biases revealed through genome sequencing of 2,396 families. Am J Hum Genet 108: 597–607. 10.1016/j.ajhg.2021.02.012
- ↵Bengtsson BO. 1980. Rates of karyotype evolution in placental mammals. Hereditas 92: 37–47. 10.1111/j.1601-5223.1980.tb01676.x
- ↵Benson G. 1999. Tandem repeats finder: a program to analyze DNA sequences. Nucleic Acids Res 27: 573–580. 10.1093/nar/27.2.573
- ↵Bergeron LA, Besenbacher S, Turner T, Versoza CJ, Wang RJ, Price AL, Armstrong E, Riera M, Carlson J, Chen H-Y, 2022. The mutationathon highlights the importance of reaching standardization in estimates of pedigree-based germline mutation rates. eLife 11: e73577. 10.7554/eLife.73577
- ↵Berselli M, Lavezzo E, Toppo S. 2018. NeSSie: a tool for the identification of approximate DNA sequence symmetries. Bioinformatics 34: 2503–2505. 10.1093/bioinformatics/bty142
- ↵Billingsley KJ, Ding J, Alvarez Jerez P, Illarionova A, Levine K, Grenn FP, Makarious MB, Moore A, Vitale D, Reed X, 2023. Genome-wide analysis of structural variants in Parkinson disease. Ann Neurol 93: 1012–1022. 10.1002/ana.26608
- ↵Bourque G, Pevzner PA, Tesler G. 2004. Reconstructing the genomic architecture of ancestral mammals: lessons from human, mouse, and rat genomes. Genome Res 14: 507–516. 10.1101/gr.1975204
- ↵Camacho C, Coulouris G, Avagyan V, Ma N, Papadopoulos J, Bealer K, Madden TL. 2009. BLAST+: architecture and applications. BMC Bioinformatics 10: 421. 10.1186/1471-2105-10-421
- ↵Chakraborty M, Emerson JJ, Macdonald SJ, Long AD. 2019. Structural variants exhibit widespread allelic heterogeneity and shape variation in complex traits. Nat Commun 10: 4872. 10.1038/s41467-019-12884-1
- ↵Chebib J, Jackson BC, López-Cortegano E, Tautz D, Keightley PD. 2021. Inbred lab mice are not isogenic: genetic variation within inbred strains used to infer the mutation rate per nucleotide site. Heredity (Edinb) 126: 107–116. 10.1038/s41437-020-00361-1
- ↵Chebib J, Jonas A, López-Cortegano E, Künzel S, Tautz S, Keightley PD. 2024. An estimate of fitness reduction from mutation accumulation in a mammal allows assessment of the consequences of relaxed selection. PLoS Biol 22: e3002795. 10.1371/journal.pbio.3002795
- ↵Cheng H, Concepcion GT, Feng X, Zhang H, Li H. 2021. Haplotype-resolved de novo assembly using phased assembly graphs with hifiasm. Nat Methods 18: 170–175. 10.1038/s41592-020-01056-5
- ↵Cheng H, Jarvis ED, Fedrigo O, Koepfli KP, Urban L, Gemmell NJ, Li H. 2022. Haplotype-resolved assembly of diploid genomes without parental data. Nat Biotechnol 40: 1332–1335. 10.1038/s41587-022-01261-x
- ↵Chuong EB, Elde NC, Feschotte C. 2017. Regulatory activities of transposable elements: from conflicts to benefits. Nat Rev Genet 18: 71–86. 10.1038/nrg.2016.139
- ↵Cmero M, Yuan K, Ong CS, Schröder J, PCAWG Evolution and Heterogeneity Working Group, Corcoran NM, Papenfuss T, Hovens CM, Markowetz F, Macintyre G, 2020. Inferring structural variant cancer cell fraction. Nat Commun 11: 730. 10.1038/s41467-020-14351-8
- ↵Coghlan A, Eichler EE, Oliver SG, Paterson AH, Stein L. 2005. Chromosome evolution in eukaryotes: a multi-kingdom perspective. Trends Genet 21: 673–682. 10.1016/j.tig.2005.09.009
- ↵Cohen S, Agmon N, Sobol O, Segal D. 2010. Extrachromosomal circles of satellite repeats and 5S ribosomal DNA in human cells. Mob DNA 8: 11. 10.1186/1759-8753-1-11
- ↵Collins RL, Brand H, Karczewski KJ, Zhao X, Alföldi J, Francioli LC, Khera AV, Lowther C, Gauthier LD, Wang H, 2020. A structural variation reference for medical and population genetics. Nature 581: 444–451. 10.1038/s41586-020-2287-8
- ↵Danecek P, Bonfield JK, Liddle J, Marshall J, Ohan V, Pollard MO, Whitwham A, Keane T, McCarthy SA, Davies RM, 2021. Twelve years of SAMtools and BCFtools. GigaScience 10: giab008. 10.1093/gigascience/giab008
- ↵Deng L, Lou H, Zhang X, Thiruvahindrapuram B, Lu D, Marshall CR, Liu C, Xie B, Xu W, Wong L-P, 2019. Analysis of five deep-sequenced trio-genomes of the Peninsular Malaysia Orang Asli and North Borneo populations. BMC Genomics 20: 842. 10.1186/s12864-019-6226-8
- ↵Dumont BL. 2019. Significant strain variation in the mutation spectra of inbred laboratory mice. Mol Biol Evol 36: 865–874. 10.1093/molbev/msz026
- ↵Ellegren H. 2004. Microsatellites: simple sequences with complex evolution. Nat Rev Genet 5: 435–445. 10.1038/nrg1348
- ↵Etchegaray E, Naville M, Volff JN, Haftek-Terreau Z. 2021. Transposable element-derived sequences in vertebrate development. Mob DNA 12: 1. 10.1186/s13100-020-00229-5
- ↵Ewing AD, Ballinger TJ, Earl D, Broad Institute Genome Sequencing and Analysis Program and Platform, Harris CC, Ding L, Wilson RK, Haussler D. 2013. Retrotransposition of gene transcripts leads to structural variation in mammalian genomes. Genome Biol 14: R22. 10.1186/gb-2013-14-3-r22
- ↵Feliciello I, Picariello O, Chinali G. 2006. Intra-specific variability and unusual organization of the repetitive units in a satellite DNA from Rana dalmatina: molecular evidence of a new mechanism of DNA repair acting on satellite DNA. Gene 383: 81–92. 10.1016/j.gene.2006.07.016
- ↵Ferraj A, Audano PA, Balachandran P, Czechanski A, Flores JI, Radecki AA, Mosur V, Gordon DS, Walawalkar IA, Eichler EE, 2023. Resolution of structural variation in diverse mouse genomes reveals chromatin remodeling due to transposable elements. Cell Genomics 3: 100291. 10.1016/j.xgen.2023.100291
- ↵Feusier J, Watkins WS, Thomas J, Farrell A, Witherspoon DJ, Baird L, Ha H, Xing J, Jorde LB. 2019. Pedigree-based estimation of human mobile element retrotransposition rates. Genome Res 29: 1567–1577. 10.1101/gr.247965.118
- ↵Flynn JM, Brown EJ, Clark AG. 2021. Copy number evolution in simple and complex tandem repeats across the C57BL/6 and C57BL/10 inbred mouse lines. G3 (Bethesda) 11: jkab184. 10.1093/g3journal/jkab184
- ↵Gagnier L, Belancio VP, Mager DL. 2019. Mouse germ line mutations due to retrotransposon insertions. Mob DNA 10: 15. 10.1186/s13100-019-0157-4
- ↵Gao H, Hamp T, Ede J, Schraiber JG, McRae J, Singer-Berk M, Yang Y, Dietrich ASD, Fiziev PP, Kuderna LFK, 2023. The landscape of tolerated genetic variation in humans and primates. Science 380: eabn8153. 10.1126/science.abn8197
- ↵Garrido-Ramos MA. 2017. Satellite DNA: an evolving topic. Genes (Basel) 8: 230. 10.3390/genes8090230
- ↵Garrison E, Sirén J, Novak AM, Hickey G, Eizenga JM, Dawson ET, Jones W, Garg S, Markello C, Lin MF, 2018. Variation graph toolkit improves read mapping by representing genetic variation in the reference. Nat Biotechnol 36: 875–879. 10.1038/nbt.4227
- ↵Gray YH. 2000. It takes two transposons to tango: transposable element-mediated chromosomal rearrangements. Trends Genet 16: 461–468. 10.1016/S0168-9525(00)02104-1
- ↵Groza T, Lopez Gomez F, Mashhadi HH, Muñoz-Fuentes V, Gunes O, Wilson R, Cacheiro P, Frost A, Keskivali-Bond P, Vardal B, 2023. The International Mouse Phenotyping Consortium: comprehensive knockout phenotyping underpinning the study of human disease. Nucl Acids Res 51: D1038–D1045. 10.1093/nar/gkac972
- ↵Guénet JL, Bonhomme F. 2003. Wild mice: an ever-increasing contribution to a popular mammalian model. Trends Genet 19: 24–31. 10.1016/S0168-9525(02)00007-0
- ↵Gymrek M, Goren A. 2021. Missing heritability may be hiding in repeats. Science 373: 1440–1441. 10.1126/science.abl7794
- ↵Halligan DL, Keightley PD. 2009. Spontaneous mutation accumulation studies in evolutionary genetics. Annu Rev Ecol Evol Syst 40: 151–172. 10.1146/annurev.ecolsys.39.110707.173437
- ↵Hannan AJ. 2018. Tandem repeats mediating genetic plasticity in health and disease. Nat Rev Genet 19: 286–298. 10.1038/nrg.2017.115
- ↵Harland CK, Durkin M, Artesi L, Karim N, Cambisano M, Deckers M, Mni M, Mullaart E, Coppieters W, Georges M. 2018. Rate of de novo mutation in dairy cattle and potential impact of reproductive technologies. Proc World Congr Genet Appl Livest Prod 11: 983.
- ↵Harr B, Karakoc E, Neme R, Teschke M, Pfeifle C, Pezer Ž, Babiker H, Linnenbrink M, Montero I, Scavetta R, 2016. Genomic resources for wild populations of the house mouse, Mus musculus and its close relative Mus spretus. Sci Data 3: 160075. 10.1038/sdata.2016.75
- ↵Henriksen RA, Jenjaroenpun P, Sjøstrøm IB, Jensen KR, Prada-Luengo I, Wongsurawat T, Nookaew I, Regenberg B. 2022. Circular DNA in the human germline and its association with recombination. Mol Cell 82: 209–217.e7. 10.1016/j.molcel.2021.11.027
- ↵Hickey G, Paten B, Earl D, Zerbino D, Haussler D. 2013. HAL: a hierarchical format for storing and analyzing multiple genome alignments. Bioinformatics 29: 1341–1342. 10.1093/bioinformatics/btt128
- ↵Hickey G, Monlong J, Ebler J, Novak A, Eizenga JM, Gao Y, Human Pangenome Reference Consortium, Marschall T, Li H, Paten B. 2024. Pangenome graph construction from genome alignments with minigraph-cactus. Nat Biotechnol 42: 663–673. 10.1038/s41587-023-01793-w
- ↵Hollox EJ, Zuccherato LW, Tucci S. 2022. Genome structural variation in human evolution. Trends Genet 38: 45–58. 10.1016/j.tig.2021.06.015
- ↵Iwata-Otsubo A, Dawicki-McKenna J, Akera T, Falk SJ, Chmátal L, Yang K, Sullivan BA, Schultz RM, Lampson MA, Black BE. 2017. Expanded satellite repeats amplify a discrete CENP-A nucleosome assembly site on chromosomes that drive in female meiosis. Curr Biol 27: 2365–2373.e8. 10.1016/j.cub.2017.06.069
- ↵Jeffares DC, Jolly C, Hoti M, Speed D, Shaw L, Rallis C, Balloux F, Dessimoz C, Bähler J, Sedlazeck FJ. 2017. Transient structural variations have strong effects on quantitative traits and reproductive isolation in fission yeast. Nat Commun 8: 14061. 10.1038/ncomms14061
- ↵Kaivola K, Chia R, Ding J, Rasheed M, Fujita M, Menon V, Walton RL, Collins RL, Billingsley K, Brand H, 2023. Genome-wide structural variant analysis identifies risk loci for non-Alzheimer's dementias. Cell Genomics 3: 100316. 10.1016/j.xgen.2023.100316
- ↵Kapushesky M, Emam I, Holloway E, Kurnosov P, Zorin A, Malone J, Rustici G, Williams E, Parkinson H, Brazma A. 2010. Gene Expression Atlas at the European Bioinformatics Institute. Nucleic Acids Res 38(Database issue): D690–D698. 10.1093/nar/gkp936
- ↵Katoh K, Rozewicki J, Yamada KD. 2019. MAFFT online service: multiple sequence alignment, interactive sequence choice and visualization. Brief Bioinform 20: 1160–1166. 10.1093/bib/bbx108
- ↵Keshavarz M, Savriama Y, Refki P, Reeves RG, Tautz D. 2021. Natural copy number variation of tandemly repeated regulatory SNORD RNAs leads to individual phenotypic differences in mice. Mol Ecol 30: 4708–4722. 10.1111/mec.16076
- ↵Kloosterman WP, Francioli LC, Hormozdiari F, Marschall T, Hehir-Kwa JY, Abdellaoui A, Lameijer E-W, Moed MH, Koval V, Renkens I, 2015. Characteristics of de novo structural changes in the human genome. Genome Res 25: 792–801. 10.1101/gr.185041.114
- ↵Kong A, Fridge ML, Masson G, Besenbacher S, Sulem P, Magnusson G, Gudjonsson SA, Sigurdsson A, Jonasdottir A, Jonasdottir A, 2012. Rate of de novo mutations and the importance of father's age to disease risk. Nature 488: 471–475. 10.1038/nature11396
- ↵Konkel MK, Batzer MA. 2010. A mobile threat to genome stability: the impact of non-LTR retrotransposons upon the human genome. Semin Cancer Biol 20: 211–221. 10.1016/j.semcancer.2010.03.001
- ↵Kramara J, Osia B, Malkova A. 2018. Break-induced replication: the where, the why, and the how. Trends Genet 34: 518–531. 10.1016/j.tig.2018.04.002
- ↵Kristmundsdottir S, Jonsson H, Hardarson MT, Palsson G, Beyter D, Eggertsson HP, Gylfason A, Sveinbjornsson G, Holley G, Stefansson OA, 2023. Sequence variants affecting the genome-wide rate of germline mutations. Nat Commun 14: 3855. 10.1038/s41467-023-39547-6
- ↵Kuff EL, Lueders KK. 1988. The intracisternal A-particle gene family: structure and functional aspects. Adv Cancer Res 51: 183–276. 10.1016/S0065-230X(08)60223-7
- ↵Lee YL, Bouwman AC, Harland C, Bosse M, Moreira GCM, Veerkamp RF, Mullaart E, Cambisano N, Groenen MAM, Karim L, 2023. The rate of de novo structural variation is increased in in vitro–produced offspring and preferentially affects the paternal genome. Genome Res 33: 1455–1464. 10.1101/gr.277884.123
- ↵Li H. 2018. Minimap2: pairwise alignment for nucleotide sequences. Bioinformatics 34: 3094–3100. 10.1093/bioinformatics/bty191
- ↵Li H, Bloom JM, Farjoun Y, Fleharty M, Gauthier L, Neale B, MacArthur D. 2018. A synthetic-diploid benchmark for accurate variant-calling evaluation. Nat Methods 15: 595–597. 10.1038/s41592-018-0054-7
- ↵Li H, Feng X, Chu C. 2020. The design and construction of reference pangenome graphs with minigraph. Genome Biol 21: 265. 10.1186/s13059-020-02168-z
- ↵Liao WW, Asri M, Ebler J, Doerr D, Haukness M, Hickey G, Lu S, Lucas JK, Monlong J, Abel HJ, 2023. A draft human pangenome reference. Nature 617: 312–324. 10.1038/s41586-023-05896-x
- ↵Lilue J, Doran AG, Fiddes IT, Abrudan M, Armstrong J, Bennett R, Chow W, Collins J, Collins S, Czechanski A, 2018. Sixteen diverse laboratory mouse reference genomes define strain-specific haplotypes and novel functional loci. Nat Genet 50: 1574–1583. 10.1038/s41588-018-0223-8
- ↵Lindsay SJ, Rahbari R, Kaplanis J, Keane T, Hurles ME. 2019. Similarities and differences in patterns of germline mutation between mice and humans. Nat Commun 10: 4053. 10.1038/s41467-019-12023-w
- ↵Long M, VanKuren NW, Chen S, Vibranovski MD. 2013. New gene evolution: little did we know. Annu Rev Genet 47: 307–333. 10.1146/annurev-genet-111212-133301
- ↵López-Cortegano E, Craig RJ, Chebib J, Balogun EJ, Keightley PD. 2023. Rates and spectra of de novo structural mutation in Chlamydomonas reinhardtii. Genome Res 33: 45–60. 10.1101/gr.276957.122
- ↵López-Cortegano E, Chebib J, Jonas A, Vock A, Künzel S, Tautz D, Keightley PD. 2024. Variation in the spectrum of new mutations among inbred strains of mice. Mol Biol Evol 41: msae163. 10.1093/molbev/msae163
- ↵Lynch M, Ali F, Lin T, Wang Y, Ni J, Long H. 2023. The divergence of mutation rates and spectra across the tree of life. EMBO Rep 24: e57561. 10.15252/embr.202357561
- ↵Mahmoud M, Gobet N, Cruz-Dávalos DI, Mounier N, Dessimoz C, Sedlazeck FJ. 2019. Structural variant calling: the long and the short of it. Genome Biol 20: 246. 10.1186/s13059-019-1828-7
- ↵Maksakova IA, Romanish MT, Gagnier L, Dunn CA, van de Lagemaat LN, Mager DL. 2006. Retroviral elements and their hosts: insertional mutagenesis in the mouse germ line. PLoS Genet 2: e2. 10.1371/journal.pgen.0020002
- ↵Maksimov MO, Wu C, Ashbrook DG, Villani F, Colonna V, Mousavi N, Ma N, Lu L, Pritchard JK, Goren A, 2023. A novel quantitative trait locus implicates Msh3 in the propensity for genome-wide short tandem repeat expansions in mice. Genome Res 33: 689–702. 10.1101/gr.277576.122
- ↵Mercuri L, Palmisano D, L'Abbate A, D'Addabbo P, Montinaro F, Catacchio CR, Hasenfeld P, Ventura M, Korbel JO, Sanders AD, 2022. A high-resolution map of small-scale inversions in the gibbon genome. Genome Res 32: 1941–1951. 10.1101/gr.276960.122
- ↵Mérot C, Oomen RA, Tigano A, Wellenreuther M. 2020. A roadmap for understanding the evolutionary significance of structural genomic variation. Trends Ecol Evol 35: 561–572. 10.1016/j.tree.2020.03.002
- ↵Milholland B, Dong X, Zhang L, Hao X, Suh Y, Vijg J. 2017. Differences between germline and somatic mutation rates in humans and mice. Nat Commun 8: 15183. 10.1038/ncomms15183
- ↵Mirkin SM. 2007. Expandable DNA repeats and human disease. Nature 447: 932–940. 10.1038/nature05977
- ↵Mitra I, Huang B, Mousavi N, Ma N, Lamkin M, Yanicky R, Shleizer-Burko S, Lohmueller KE, Gymrek M. 2021. Patterns of de novo tandem repeat mutations and their role in autism. Nature 589: 246–250. 10.1038/s41586-020-03078-7
- ↵Montgomery SB, Goode DL, Kvikstad E, Albers CA, Zhang ZD, Mu XJ, Ananda G, Howie B, Karczewski KJ, Smith KS, 2013. The origin, evolution, and functional impact of short insertion-deletion variants identified in 179 human genomes. Genome Res 23: 749–761. 10.1101/gr.148718.112
- ↵Moreno P, Fexova S, George N, Manning JR, Miao Z, Mohammed S, Muñoz-Pomer A, Fullgrabe A, Bi Y, Bush N, 2022. Expression Atlas update: gene and protein expression in multiple species. Nucl Acids Res 50: D129–D140. 10.1093/nar/gkab1030
- ↵Mukai T. 1964. The genetic structure of natural populations of Drosophila melanogaster. I. Spontaneous mutation rate of polygenes controlling viability. Genetics 50: 1–19. 10.1093/genetics/50.1.1
- ↵Mukamel RE, Handsaker RE, Sherman MA, Barton AR, Zheng Y, McCarroll SA, Loh P-R. 2021. Protein-coding repeat polymorphisms strongly shape diverse human phenotypes. Science 373: 1499–1505. 10.1126/science.abg8289
- ↵Muller HJ. 1928. The measurement of gene mutation rate in Drosophila, its high variability, and its dependence upon temperature. Genetics 13: 279–357. 10.1093/genetics/13.4.279
- ↵Nachman MW. 2004. Haldane and the first estimates of the human mutation rate. J Genet 83: 231–233. 10.1007/BF02717891
- ↵Nattestad M, Aboukhalil R, Chin CS, Schatz MC. 2021. Ribbon: intuitive visualization for complex genomic variation. Bioinformatics 37: 413–415. 10.1093/bioinformatics/btaa680
- ↵Naville M, Henriet S, Warren I, Sumic S, Reeve M, Volff J-N, Chourrout D. 2019. Massive changes of genome size driven by expansions of non-autonomous transposable elements. Curr Biol 29: 1161–1168.e6. 10.1016/j.cub.2019.01.080
- ↵Nellåker C, Keane TM, Yalcin B, Wong K, Agam A, Belgard TG, Flint J, Adams DJ, Frankel WN, Ponting CP. 2012. The genomic landscape shaped by selection on transposable elements across 18 mouse strains. Genome Biol 13: R45. 10.1186/gb-2012-13-6-r45
- ↵Nesta AV, Tafur D, Beck CR. 2021. Hotspots of human mutation. Trends Genet 37: 717–729. 10.1016/j.tig.2020.10.003
- ↵Noyes MD, Harvey WT, Porubsky D, Sulovari A, Li R, Rose NR, Audano PA, Munson KM, Lewis AP, Hoekzema K, 2022. Familial long-read sequencing increases yield of de novo mutations. Am J Hum Genet 109: 631–646. 10.1016/j.ajhg.2022.02.014
- ↵Nurk S, Koren S, Rhie A, Rautiainen M, Bzikadze AV, Mikheenko A, Vollger MR, Altemose N, Uralsky L, Gershman A, 2022. The complete sequence of a human genome. Science 376: 44–53. 10.1126/science.abj6987
- ↵Ohno M. 2019. Spontaneous de novo germline mutations in humans and mice: rates, spectra, causes and consequences. Genes Genet Syst 94: 13–22. 10.1266/ggs.18-00015
- ↵Olson ND, Wagner J, Dwarshuis N, Miga KH, Sedlazeck FJ, Salit M, Zook JM. 2023. Variant calling and benchmarking in an era of complete human genome sequences. Nat Rev Genet 24: 464–483. 10.1038/s41576-023-00590-0
- ↵Orlov YL, Potapov VN. 2004. Complexity: an internet resource for analysis of DNA sequence complexity. Nucl Acids Res 32: W628–W633. 10.1093/nar/gkh466
- ↵Packiaraj J, Thakur J. 2024. DNA satellite and chromatin organization at mouse centromeres and pericentromeres. Genom Biol 25: 52. 10.1186/s13059-024-03184-z
- ↵Parks MM, Lawrence CE, Raphael BJ. 2015. Detecting non-allelic homologous recombination from high-throughput sequencing data. Genom Biol 16: 72. 10.1186/s13059-015-0633-1
- ↵Patton JL, Sherwood SW. 1983. Chromosome evolution and speciation in rodents. Ann Rev Ecol Syst 14: 139–158. 10.1146/annurev.es.14.110183.001035
- ↵Pezer Z, Harr B, Teschke M, Babiker H, Tautz D. 2015. Divergence patterns of genic copy number variation in natural populations of the house mouse (Mus musculus domesticus) reveal three conserved genes with major population-specific expansions. Genome Res 25: 1114–1124. 10.1101/gr.187187.114
- ↵Piálek J, Hauffe HC, Searle JB. 2005. Chromosomal variation in the house mouse. Biol J Linn Soc 84: 535–563. 10.1111/j.1095-8312.2005.00454.x
- ↵Poplin R, Chang PC, Alexander D, Schwartz S, Colthurst T, Ku A, Newburger D, Dijamco J, Nguyen N, Afshar PT, 2018. A universal SNP and small-indel variant caller using deep neural networks. Nat Biotechnol 36: 983–987. 10.1038/nbt.4235
- ↵Potter S, Bragg JG, Blom MPK, Deakin JE, Kirkpatrick M, Eldridge MDB, Moritz C. 2017. Chromosomal speciation in the genomics era: disentangling phylogenetic evolution of rock-wallabies. Front Genet 8: 10. 10.3389/fgene.2017.00010
- ↵Rebollo R, Galvão-Ferrarini M, Gagnier L, Zhang Y, Ferraj A, Beck CR, Lorincz MC, Mager DL. 2020. Inter-strain epigenomic profiling reveals a candidate IAP master copy in C3H mice. Viruses 12: 783. 10.3390/v12070783
- ↵Ricci M, Peona V, Guichard E, Taccioli C, Boattini A. 2018. Transposable elements activity is positively related to rate of speciation in mammals. J Mol Evol 86: 303–310. 10.1007/s00239-018-9847-7
- ↵Robinson JT, Thorvaldsdóttir H, Winckler W, Guttman M, Lander ES, Getz G, Mesirov JP. 2011. Integrative genomics viewer. Nat Biotechnol 29: 24–26. 10.1038/nbt.1754
- ↵Rodriguez-Martin B, Alvarez EG, Baez-Ortega A, Zamora J, Supek F, Demeulemeester J, Santamarina M, Ju YS, Temes J, Garcia-Souto D, 2020. Pan-cancer analysis of whole genomes identifies driver rearrangements promoted by LINE-1 retrotransposition. Nat Genet 52: 306–319. 10.1038/s41588-019-0562-0
- ↵Rossi MS, Reig OA, Zorzópulos J. 1990. Evidence for rolling-circle replication in a major satellite DNA from the south American rodents of the genus Ctenomys. Mol Biol Evol 7: 340–350. 10.1093/oxfordjournals.molbev.a040606
- ↵Schlötterer C, Tautz D. 1992. Slippage synthesis of simple sequence DNA. Nucleic Acids Res 20: 211–215. 10.1093/nar/20.2.211
- ↵Schofield PN, Hoehndorf R, Gkoutos GV. 2012. Mouse genetic and phenotypic resources for human genetics. Hum Mutat 33: 826–836. 10.1002/humu.22077
- ↵Smolka M, Paulin LF, Grochowski CM, Horner DW, Mahmoud M, Behera S, Kalef-Ezra E, Gandhi M, Hong K, Pehlivan D, 2024. Detection of mosaic and population-level structural variants with sniffles2. Nat Biotechnol 42: 1571–1580. 10.1038/s41587-023-02024-y
- ↵So A, Le Guen T, Lopez BS, Guirouilh-Barbat J. 2017. Genomic rearrangements induced by unscheduled DNA double strand breaks in somatic mammalian cells. FEBS J 284: 2324–2344. 10.1111/febs.14053
- ↵Steensma MJ, Lee YL, Bouwman AC, Barros CP, Derks MFL, Bink MCAM, Harlizius B, Huisman AE, Crooijmans RPMA, Groenen MAM, 2023. Identification and characterisation of de novo germline structural variants in two commercial pig lines using trio-based whole genome sequencing. BMC Genomics 24: 208. 10.1186/s12864-023-09296-3
- ↵Stoll C, Roth MP. 1983. Segregation of a 22 ring chromosome in three generations. Hum Genet 63: 294–296. 10.1007/BF00284669
- ↵Storer J, Hubley R, Rosen J, Wheeler TJ, Smit AF. 2021. The Dfam community resource of transposable element families, sequence models, and genome annotations. Mob DNA 12: 2. 10.1186/s13100-020-00230-y
- ↵Sun JX, Helgason A, Masson G, Ebenesersdóttir SS, Li H, Mallick S, Gnerre S, Patterson N, Kong A, Reich D, 2012. A direct characterization of human mutation based on microsatellites. Nat Genet 44: 1161–1165. 10.1038/ng.2398
- ↵Tautz D. 1993. Notes on the definition and nomenclature of tandemly repetitive DNA sequences. EXS 67: 21–28. 10.1007/978-3-0348-8583-6_2
- ↵Tautz D, Trick M, Dover GA. 1986. Cryptic simplicity in DNA is a major source of genetic variation. Nature 322: 652–656. 10.1038/322652a0
- ↵Trost B, Engchuan W, Nguyen CM, Thiruvahindrapuram B, Dolzhenko E, Backstrom I, Mirceta M, Mojarad BA, Yin Y, Dov A, 2020. Genome-wide detection of tandem DNA repeats that are expanded in autism. Nature 586: 80–86. 10.1038/s41586-020-2579-z
- ↵Turner DJ, Miretti M, Rajan D, Fiegler H, Carter NP, Blayney ML, Beck S, Hurles ME. 2008. Germline rates of de novo meiotic deletions and duplications causing several genomic disorders. Nat Genet 40: 90–95. 10.1038/ng.2007.40
- ↵Uchimura A, Higuchi M, Minakuchi Y, Ohno M, Toyoda A, Fujiyama A, Miura I, Wakana S, Nishino J, Yagi T. 2015. Germline mutation rates and the long-term phenotypic effects of mutation accumulation in wild-type laboratory mice and mutator mice. Genome Res 25: 1125–1134. 10.1101/gr.186148.114
- ↵van't Hof AE, Campagne P, Rigden DJ, Yung CJ, Lingley J, Quail MA, Hall N, Darby AC, Saccheri IJ. 2016. The industrial melanism mutation in British peppered moths is a transposable element. Nature 534: 102–105. 10.1038/nature17951
- ↵Venn O, Turner I, Mathieson I, de Groot N, Bontrop R, McVean G. 2014. Strong male bias drives germline mutation in chimpanzees. Science 344: 1272–1275. 10.1126/science.344.6189.1272
- ↵Vilar E, Gruber SB. 2010. Microsatellite instability in colorectal cancer: the stable evidence. Nat Rev Clinical Oncology 7: 153–162. 10.1038/nrclinonc.2009.237
- ↵Wang Y, Obbard DJ. 2023. Experimental estimates of germline mutation rate in eukaryotes: a phylogenetic meta-analysis. Evol Lett 7: 216–226. 10.1093/evlett/qrad027
- ↵Wick RR, Schultz MB, Zobel J, Holt KE. 2015. Bandage: interactive visualization of de novo genome assemblies. Bioinformatics 31: 3350–3352. 10.1093/bioinformatics/btv383
- ↵Wolf G, de Laco A, Sun MA, Bruno M, Tinkham M, Hoang D, Mitra A, Ralls S, Trono D, Macfarlan TS. 2020. KRAB-zinc finger protein gene expansion in response to active retrotransposons in the murine lineage. eLife 9: e56337. 10.7554/eLife.56337
- ↵Yun T, Li H, Chang PC, Lin MF, Carroll A, McLean CY. 2021. Accurate, scalable cohort variant calls using deepVariant and GLnexus. Bioinformatics 36: 5582–5589. 10.1093/bioinformatics/btaa1081
- ↵Zhang W, Tautz D. 2022. Tracing the origin and evolutionary fate of recent gene retrocopies in natural populations of the house mouse. Mol Biol Evol 39: msab360. 10.1093/molbev/msab360
- ↵Zhang F, Gu W, Hurles ME, Lupski JR. 2009. Copy number variation in human health, disease and evolution. Annu Rev Genomics Hum Genet 10: 451–481. 10.1146/annurev.genom.9.081307.164217
- ↵Zhang W, Xie C, Ullrich K, Zhang YE, Tautz D. 2021. The mutational load in natural populations is significantly affected by high primary rates of retroposition. Proc Natl Acad Sci 118: e20130423118. 10.1073/pnas.2013043118
- ↵Zhou X, Pan J, Wang Y, Lynch M, Long H, Zhang Y. 2023. De novo structural variations of Escherichia coli detected by nanopore long-read sequencing. Genome Biol Evol 15: evad106. 10.1093/gbe/evad106