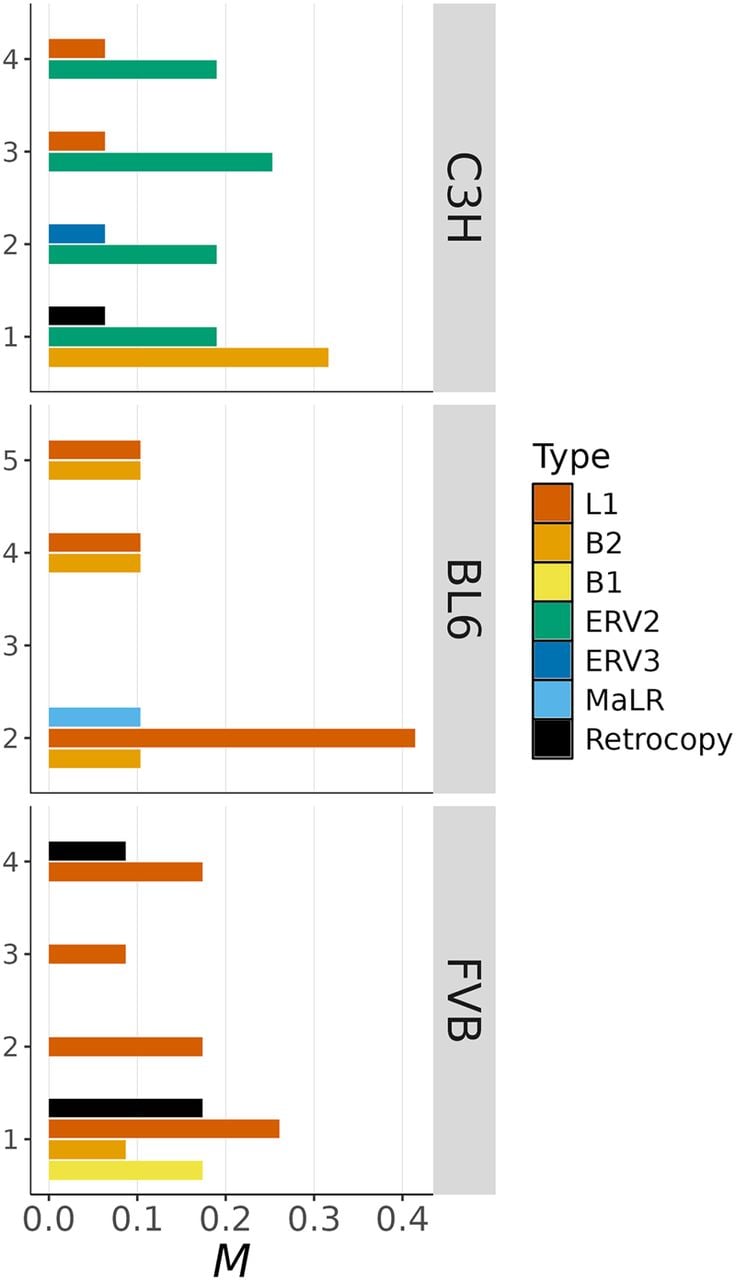
Figure 4.
Mobile insertions. The rate of insertions per haploid genome per generation (M) is shown by MA sample (on the y-axis) and type of mobile element (in colors).
Mobile insertions. The rate of insertions per haploid genome per generation (M) is shown by MA sample (on the y-axis) and type of mobile element (in colors).