
Abstract
Seed-chain-extend with k-mer seeds is a powerful heuristic technique for sequence alignment used by modern sequence aligners. Although effective in practice for both runtime and accuracy, theoretical guarantees on the resulting alignment do not exist for seed-chain-extend. In this work, we give the first rigorous bounds for the efficacy of seed-chain-extend with k-mers in expectation. Assume we are given a random nucleotide sequence of length ∼n that is indexed (or seeded) and a mutated substring of length ∼m ≤ n with mutation rate θ < 0.206. We prove that we can find a k = Θ(log n) for the k-mer size such that the expected runtime of seed-chain-extend under optimal linear-gap cost chaining and quadratic time gap extension is O(mnf(θ) log n), where f(θ) < 2.43 · θ holds as a loose bound. The alignment also turns out to be good; we prove that more than fraction of the homologous bases is recoverable under an optimal chain. We also show that our bounds work when k-mers are sketched, that is, only a subset of all k-mers is selected, and that sketching reduces chaining time without increasing alignment time or decreasing accuracy too much, justifying the effectiveness of sketching as a practical speedup in sequence alignment. We verify our results in simulation and on real noisy long-read data and show that our theoretical runtimes can predict real runtimes accurately. We conjecture that our bounds can be improved further, and in particular, f(θ) can be further reduced.
Introduction
Since the earliest years of bioinformatics, one primitive task has been sequence alignment (Smith and Waterman 1981; Altschul et al. 1990), which plays a major role in genomic sequencing and phylogenetics. Intuitively, alignment matches together similar parts of two strings, inserting gaps where needed. More formally, alignment is defined by a set of allowed edit operations (e.g., single-character substitutions, insertions, deletions) with associated costs; an alignment is a sequence of those operations transforming one string into another string (or for local alignment, transforming one string into a substring of the other), and the alignment score is the summed cost of those operations (Berger et al. 2021).
Unfortunately, the best-guaranteed algorithms for computing alignment (Needleman and Wunsch 1970; Smith and Waterman 1981) are quadratic in time complexity; worse, this bound appears to be tight (Backurs and Indyk 2018). There exist optimal algorithms with parameterized runtimes based on sequence similarity (Marco-Sola et al. 2021) that are faster and used in practice, but these still have worst-case quadratic time complexity as a function of the sequence length. Thus, to deal with large volumes of sequencing data (Berger et al. 2016; Marçais et al. 2019), sequence alignment programs use heuristics (Lipman and Pearson 1985; Altschul et al. 1990; Li and Durbin 2009; Kiełbasa et al. 2011; Langmead and Salzberg 2012; Li 2018; Marçais et al. 2018) without performance guarantees (Medvedev 2022a) for computational efficiency. All these heuristic algorithms are by necessity fast, achieving empirically subquadratic runtimes on real problems. They fail for adversarial examples, but aligners perform well in practice because the sequences being aligned are similar and not pathological examples (Ukkonen 1983; Myers 1986; Ivanov et al. 2022; Koerkamp and Ivanov 2022).
Phylogenetics often makes use of comparative genomics, in which aligning together multiple whole genomes allows annotating the ways in which two species have diverged over evolutionary time (Koonin et al. 2000). In genomic sequencing, the alignment task manifests because the sequencing machines are only able to read a small portion of a chromosome at a time, producing short snippets known as reads (Alser et al. 2021). It is then incumbent on read-mapping software to determine the likely origin location of that read in the genome, and for already sequenced species, this is usually performed by aligning the read to a known reference genome (Nurk et al. 2022).
Historically, different types of heuristics were used for the two tasks, because aligning a very small substring to a longer string is easier than aligning comparable-size strings. Indeed, the seed-and-extend heuristic, as seen in BWA-MEM (Li 2013) and Bowtie 2 (Langmead and Salzberg 2012), is preferred for aligning short reads to genomes instead of aligning genomes to genomes. However, as third-generation long-read sequencing becomes more prominent, the two tasks become more similar, and the same heuristics can be used for both (Sahlin et al. 2023); in this paper, we address the seed-chain-extend heuristic (distinct from seed-and-extend) used in modern software for both read mapping and whole-genome alignment.
Our contribution
Our goal in this paper is to close the gap between theory and practice, rigorously justifying the heuristics used in some of the most widely used alignment software. To this end, we turn to the methods of average-case analysis (Szpankowski 2001), which give us a way of breaking through the quadratic barrier of alignment (Medvedev 2022b). Given a random string, we define a substitution model giving rise to a distribution on pairs of inputs and then average our analysis on pairs of strings over this distribution.
Recently, Ganesh and Sy (2020) also used probabilistic analysis to show that a heuristic algorithm based on banded alignment can run in O(n log n) time for two length-n sequences and is optimal with high probability. However, their specific method has not yet seen any usage in practical software, and their analysis is invalid in the case of read mapping as it only pertains to two nearly-equal-length strings. Thus, we turn instead to the analysis of an empirically battle-tested heuristic for sequence alignment: seed-chain-extend. Seed-chain-extend is a well-established technique for comparative genomics (Myers and Miller 1995; Abouelhoda and Ohlebusch 2005), and recently, the addition of sketching (or subsampling) has made it popular for long-read aligners (Chaisson and Tesler 2012; Sović et al. 2016; Ren and Chaisson 2021), including minimap2 (Li 2018), the primary algorithm our model of seed-chain-extend is based on.
We provide, to the best of our knowledge, the first average-case bounds on runtime and optimality for the sketched k-mer seed-chain-extend alignment heuristic under a pairwise mutation model. Our optimality result shows that for large-enough k-mer size k, the alignment is mostly constrained to be near the correct diagonal of the alignment matrix, and that runtime is close to linear when the mutation or error rate is reasonably small. We also show that subsampling of k-mers asymptotically reduces our bounds on chaining time but not extension time. Our results give a theoretical justification for both the empirical accuracy and subquadratic runtime of seed-chain-extend.
Results
We first give a specific, simplified version of our main theorem.
Simplified Theorem 1 (informal main result; no sketching). Suppose we are given a uniformly random DNA string of length n and a mutated substring of length m, where each base is substituted with probability θ. If θ < 0.206 and the longer string is already seeded, then we can choose k = Θ (log n) such that the expected runtime of k-mer seed-chain-extend is O(mnf(θ)log (n)) = O(mn2.43·θlog (n)), and in expectation, fraction of the homologous bases can be recovered from this alignment.
We will state our models and definitions precisely below. Our main result, Theorem 1, precisely defines the function f(θ) < 2.43 · θ in the exponent, but 2.43 · θ is a convenient upper bound. We can quickly see from this bound that for modest mutation rates, n2.43·θ is not too large.
Mutation model
Let S = x1x2…xn+k−1 be a random uniform string with n + k − 1 i.i.d. letters on an alphabet of size σ for some k = Θ (log n). Let S′ = yp+1yp+2…yp+m+k−1 be a substring of S of length m + k − 1 starting at a fixed position p + 1 with each character independently mutated to a different letter with probability θ. Although notationally a little confusing at first, the k − 1 term ensures S, S′ contain exactly n and m k-mers, respectively: k-mers are in many ways the natural unit of measurement rather than individual characters. We model only point substitutions here and not indels. Independent substitution models have been considered in theoretical work (Ganesh and Sy 2020; Blanca et al. 2022; Shaw and Yu 2022) and, importantly, also have shown to be useful empirically (Chaisson and Tesler 2012; Ondov et al. 2016; Sarmashghi et al. 2019). Also, although genomes can be repetitive, on the level of k-mers, a random model has been shown to be reasonable (Fofanov et al. 2004). We discuss other possible random models in the Discussion section.
Modeling seed-chain-extend
A brief overview of seed-chain-extend-based alignment is given as follows: First, a subset of k-mers in both S, S′ is taken as seeds, and exact seed matches between S, S′, called anchors, are obtained. We only use k-mer seeds in this study, although other types of seeds are possible (Keich et al. 2004). An optimal increasing subsequence of possibly overlapping anchors based on some score is then collected into a chain, in which increasing is defined with the standard precedence relationship (Jain et al. 2022) between k-mer anchors (see subsection “Chaining” below) (see Fig. 5A, below). The chain is extended into a full alignment by aligning between anchor gaps in the chain.
Model overview
Our model of seed-chain-extend is primarily inspired by minimap2 with a few key differences. It captures the following steps: seeding the query S′, matching the k-mers to obtain anchors, sorting the anchors, chaining, and extending. We assume the reference S has already been seeded and only the query needs seeding, as in the case of read alignment. For comparing two similar-length genomes, the seeding time of either genome is comparable, so the asymptotics will be the same for comparative genomics.
Runtimes
Nonsketched seeding runtime with a hash table is O(m), whereas sketched seeding runtime is O(mk) (for discussion, see Methods subsection “Sketching and local k-mer selection”). Letting N be a random variable for the number of anchors, matching is O(N + m) by iterating through a hash table, sorting is O(Nlog N), and (optimal) chaining is O(Nlog N) (see subsection “Chaining”). Extension is the only step with unknown time complexity. It will turn out that extension and Nlog N are the dominating asymptotic terms, so our goal is to bound these terms in expectation. Empirically, it has been shown that chaining and alignment usually take the most time (Kalikar et al. 2022) for read mapping.
Chaining
A chain is a sequence of tuples , where iℓ and jℓ are the starting positions of the anchoring k-mers on S and S′, respectively, under the convention that S′ = yp+1… so the k-mer labeled (p + 1) on S′ is actually the first k-mer. The precedence relation iℓ > iℓ−1 and jlℓ > jℓ−1 must hold for all ℓ, and k-mers can overlap. Our chaining score is the L1 or linear-gap cost (Abouelhoda and Ohlebusch 2005; Li et al. 2020) of the form u − ζ[(iu − i1) + (ju − j1)] for ζ > 0, which penalizes long chains from distant spurious anchors and is necessary for our proofs when n > m. The score is sometimes defined equivalently as . In the language of Abouelhoda and Ohlebusch (2005), we let our anchor fragments have length 1, so the k-mers can overlap. Although minimap2 v2.22's default chaining score is different and uses a heuristic banded chaining approach, it does use a linear-gap cost (without overlaps) in certain situations, for example, mapping long contigs (Li 2021).
Extension
We use quadratic time extension between gaps based on any alignment score (e.g., edit distance, affine gap costs) (Durbin et al. 1998) as our optimality criterion only depends on the chain (see Methods subsection “Homology and recoverability”). We do not extend past the ends of the chain and do not use banded alignment (Chao et al. 1992) in this step, unlike minimap2.
Extension and chaining runtimes
Given sorted anchors, let TChain be the time spent finding an optimal chain. TChain depends on the objective function (Abouelhoda and Ohlebusch 2005; Otto et al. 2011; Mäkinen and Sahlin 2020; Jain et al. 2022). Because our gap costs are linear, TChain = O(Nlog N), where N is the number of anchors (Abouelhoda and Ohlebusch 2005). For extension time TExt, let be the size of the gaps for an optimal chain. Gℓ indicates the length of the substring between the k-mers iℓ, iℓ+1 on S and similarly for S′; can be zero. The extension time is . Using the fact that and , one can get that . We will show that the expected runtime is better than this upper bound, but it serves as a useful worst case. Because S, S′ are random strings, TChain, TExt, N, and the alignment itself all become random variables. Our goal will be to bound E[TChain] and E[TExt].
Theoretical results
First, a few definitions are in order. Recall that , and are our string lengths. We define σ > 1 to be the size of the alphabet and 0 < θ < 1 to be the probability a base mutates. Our theory holds for any alphabet size, but we use σ = 4 for specifying numerical constants. Let with base σ, and let ln be the natural logarithm. Let k = C log n for a fixed C > 0 so that key quantities can be expressed interchangeably as σk = nC and (1 − θ)k = n−Cα, where . We define the actual goodness of the chain in terms of recoverability in the Methods subsection “Homology and recoverability”; it measures the fraction of homologous bases under our mutation model that could potentially be recovered by extending through an optimal chain and only depends on the chain, not the actual alignment.
Theorem 1 (main result; no sketching). Under our model of seed-chain-extend in the subsection “Modeling seed-chain-extend”, assume θ < 0.206, let α = −log 4(1 − θ), and pick any . If for some arbitrary , letting k = C log n and , where ; the expected running time is O(mnCαlog (n)) for extension and O(mn−Cαlog m) for (optimal) chaining. Cα can always be chosen to be , and the expected recoverability of any optimal chain is .
The above condition on C is equivalent to for any δ > 0. In practice, we will make δ very small so k is not too large. is plotted in Supplemental Figure S7; it is convex and thus leads to the bound Cα < 2.43 · θ. For example, if |S| = |S′| and θ = 0.05, which is approximately the level of divergence seen between human and chimpanzee genomes (Britten 2002), , so for Cα = 0.08, the running time is O(n1.08log (n)). Even for relatively large values of n, say the entire human genome, which has size of approximately 3 billion, n1.08 is essentially linear as (3,000,000,000)0.08 ≈ 5.73.
Our proof follows in three main steps. First, we bound the first and second moments of the random variable N, which denotes the number of anchors, implying that chaining is fast. Second, we use concentration inequalities for sums of dependent random variables and exploit the structure of chaining to show that with high probability, an optimal chain does not deviate much from the chain with only “homologous anchors” (Fig. 5A). The failure probabilities will be on the order of , allowing us to also bound everything in expectation. Lastly, we bound the expected runtime of extension through gaps between homologous anchors.
Asymptotically, the chaining runtime is smaller than the extension runtime. However, the implied constants can be much smaller for the extension term (Kalikar et al. 2022), so it is practically useful to reduce the runtime of chaining via sketching. Let 0 < 1/c ≤ 1 be the expected fraction of selected k-mers for a sketching method. We use the open syncmer k-mer seeding method (Edgar 2021), which has a useful mathematical property (Theorem 7), giving the following:
Theorem 2 (sketched result). In addition to the hypotheses outlined in Theorem 1, let c = O(log n) < k and instead, where . For open syncmer sketched seed-chain-extend, the expected running time is for extension and for chaining. The expected recoverability of any optimal chain is .
This shows that the asymptotic upper bound on extension runtime is the same even if we let c grow with n like c = Θ (log n) < k, leading to the following conclusion: Sketching can reduce chaining time without increasing extension time much. Other seeding schemes used, for example, minimizers (Li 2018; Rautiainen and Marschall 2020; Colquhoun et al. 2021; Sirén et al. 2021) or FracMinHash (Irber et al. 2022), behave differently, but our techniques provide intuition and, in some cases, can be extended.
Simulated genome alignment experiments
Although the model of seed-chain-extend we consider in the theory is based off of real aligners (e.g., minimap2), real aligners implement many additional tricks to make things work better. As such, to empirically validate our theory, we implemented a basic version of sketched seed-chain-extend and tested it on simulated random sequences with independent point substitutions. For the chaining step, we implemented an AVL tree–based max-range-query method (Mäkinen et al. 2015; Li et al. 2020). For the extension step, we used a standard dynamic programming (DP) algorithm implemented in rust-bio (Köster 2016).
We let k = C log n, where , and do seed-chain-extend on two length n sequences in this section, but we do an additional experiment for a substrings of length m = n0.7 + 100 in Supplemental Figure S10. As k cannot be fractional, we let for varying integer values of k. We will set c = k − 7 = C log (n) − 7, which grows with n. The constant 7 is arbitrary but chosen to be sufficiently large so that s-mers in the open syncmer method are not so small as to make the method degenerate. We found that recoverability was always quite high and that breaks did not occur very often in actual simulations; we show this in Supplemental Figure S9. Thus, the primary focus of the empirical results will be runtime.
Accuracy of asymptotic extension runtime predictions
We first empirically investigate our upper bound on expected extension runtime, which is O(n1+Cαlog (n)) for both sketched and nonsketched extension when c = Θ (log n). Assuming that the runtime is simply for some fixed constant λ, we can predict the ratio of the runtimes as . Of course, this is incorrect for small n, as smaller terms may dominate runtime, but we expect it to be reasonably accurate for large n. We plot the empirical and predicted ratios of extension runtimes in Figure 1A.
Runtime results on seed-chain-extend between for two sequences of length n and , where θ = 0.10 and α = −log 4(1 − θ). (A) The y-axis shows the runtime ratios (with 95% confidence intervals) for iteration k + 1 divided by runtime for iteration k, where the sequence length nk is plotted on the x-axis. As n grows, both the sketched and nonsketched extension ratios asymptotically approach the predicted ratio of runtimes. (B) Multiplicative speed-up for sketched versus nonsketched alignment when sketching with density , where k = C log n. The slow-down for extension flattens out, whereas the chaining speed-up is almost linear on the log-scaled x-axis; chaining speed-up dominates extension slow-down as predicted by our theory.
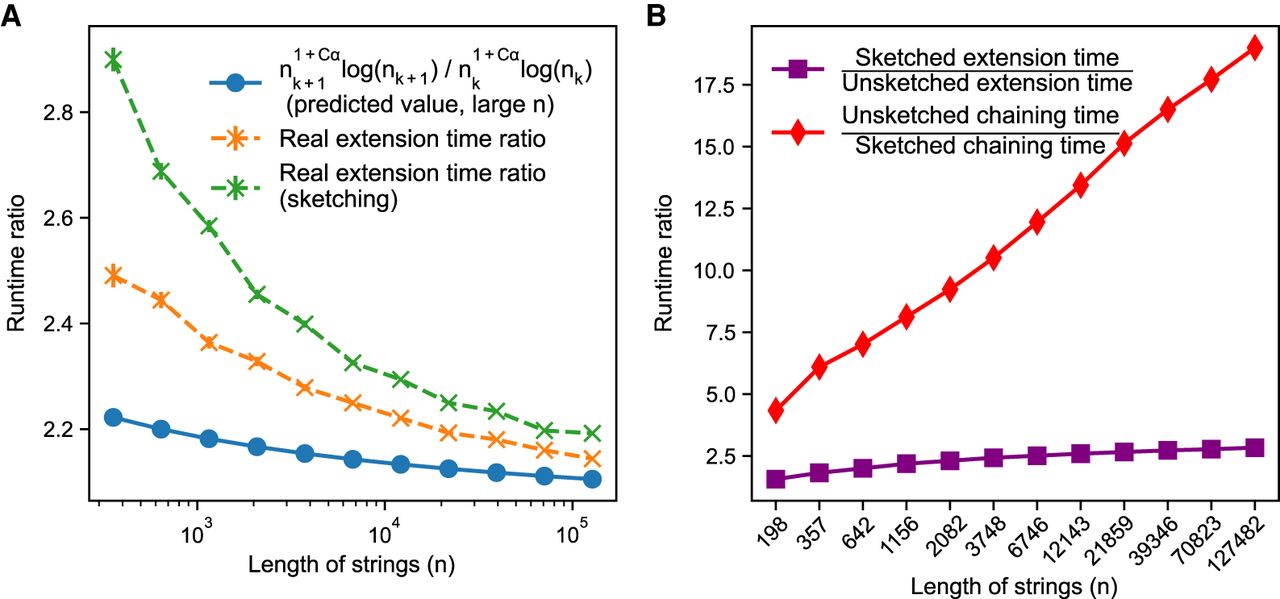
Figure 1A shows that our upper bound looks reasonable for both sketched and nonsketched cases for θ = 0.10. In Supplemental Figure S8, we show the same plots for θ = 0.05. The empirical results never cross the predicted ratio, but this is not too surprising as the predicted ratio is only approximate. Importantly, the empirical extension runtime ratios slope downward, which agrees with the prediction.
Sketching with density gives favorable runtime tradeoffs
One of our key results in Theorem 2 is that the upper bound on asymptotic runtime of extension does not depend on the density as long as 1/c < k, but chaining speed-up scales multiplicatively with c. In Figure 1B, we plot the multiplicative speed-up and slow-down of chaining and extension runtimes. This figure shows why sketching is so effective in practice with respect to runtimes; the maximal extension slow-down plateaus to three or fewer times in this case, whereas the chaining speed-up is linear as the string grows exponentially. Therefore, it is worth sketching aggressively to reduce runtime if chaining is slow. One should, however, still be careful of the sensitivity loss owing to sketching in practice (Shaw and Yu 2022).
In practice, because extension is heavily optimized (Farrar 2007; Suzuki and Kasahara 2018; Marco-Sola et al. 2021) and repetitive k-mers lead to more anchors, chaining can be a bottleneck even though it is asymptotically faster in runtime. In fact, we tried using WFA (Marco-Sola et al. 2021), a highly optimized algorithm for extension, instead of the generic DP algorithm and found it was about 60 times faster than chaining without sketching for n ≈ 2,800,000, k = 23, θ = 0.05 in our implementation.
Real nanopore read alignment experiments
To test the applicability and generalizability of our theorems to real, nonsimulated data, we performed an experiment by aligning real long-read data from Oxford Nanopore Technologies (ONT) using seed-chain-extend. We use the sketched seed-chain-extend aligner in the simulated experiments with a slight modification, which is explained in the next section. Importantly, our two main assumptions with respect to uniform random strings and point substitutions are violated in this setup: Real genomes are not uniformly random strings, and ONT reads contain a significant amount of indel errors (Delahaye and Nicolas 2021).
Our data set consists of five reference genomes and corresponding long-read data sets. The references consist of a viral genome (SARS-CoV-2), a bacterial genome (Escherichia coli), a fungi genome (Magnaporthe oryzae), an insect genome (Drosophila melanogaster), and a human genome (Homo sapiens). For each genome, we aligned a corresponding set of publicly available ONT long-reads, which may have different length and error distributions. The data sets can be found in Supplemental Table S1.
We are interested in testing the predicted results as a function of m (the read length) and n (the genome size). We let as before. Because α and C in our results depend on the error rate θ, we first aligned each read set to the genomes with minimap2 and retained only reads with gap-compressed identity of > 94.5% and < 95.5% so that θ ≈ 0.05 is fixed. In addition, we only used reads for which minimap2 aligned >90% of the read, to avoid benchmarking on unalignable reads.
Practical linear-gap cost consideration
We use almost the same seed-chain-extend algorithm as before and fix the density to be 1/7 (i.e., not scaling with n), except we apply one change: We found that the predicted linear-gap cost ζ(n) given by our theorems, although asymptotically appropriate in theory for large n, was too small for reasonable n. Therefore, we multiplied ζ by 1000.
This discrepancy is because the bounds we use in our proofs do not have optimized constants. The exact (nonasymptotic) value of ζ is only used in proving the recoverability result, and our change does not modify ζ’s asymptotic behavior, which is used in other parts of our proofs. Thus, our runtime results are still technically valid, and our experiments below will also suggest that the recoverability result is also still valid.
Evaluating model assumptions
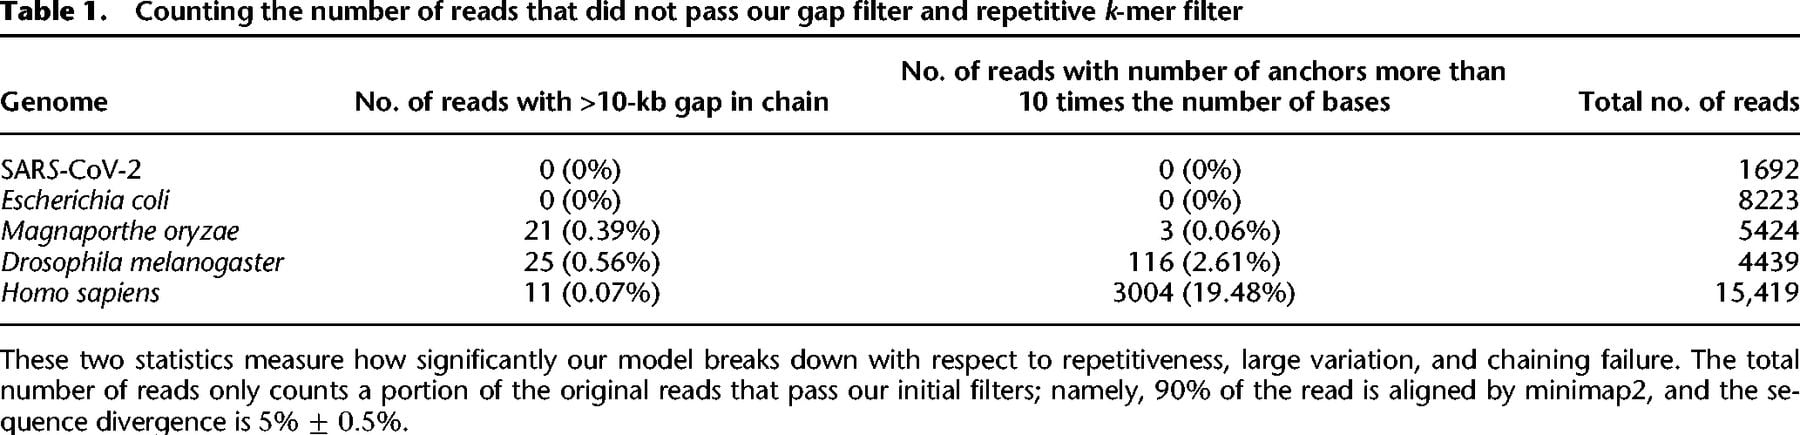
We first introduced the following filters to our basic seed-chain-extend alignment algorithm for computational reasons:
We filtered reads when the number of anchors is more than 10 times the number of bases. This occurs because of extremely repetitive k-mers and can cause the chaining step to stall.
We did not consider reads when the chains had gaps of a length >10,000 bp, which could occur because of structural variations or failure of chaining and can cause extension to stall.
The two filters also measure how significantly our model assumptions, with respect to independent substitutions and uniform random strings, are violated. We report the number of reads that fail the above filters in Table 1. Only a small fraction of reads fails the 10,000-bp gap filter, but the repetitive k-mer filter is violated more frequently as the genomes become more complex. Still, >80% of the human reads and > 97% of the D. melanogaster reads are not deemed too repetitive. Mapping to repetitive regions is an active area of research (Jain et al. 2020), which is beyond the scope of this paper, but effective heuristics such as repetitive k-mer masking (Li 2018; Sahlin 2022) exist.
Counting the number of reads that did not pass our gap filter and repetitive k-mer filter
Extension and chaining runtimes are well predicted by theory
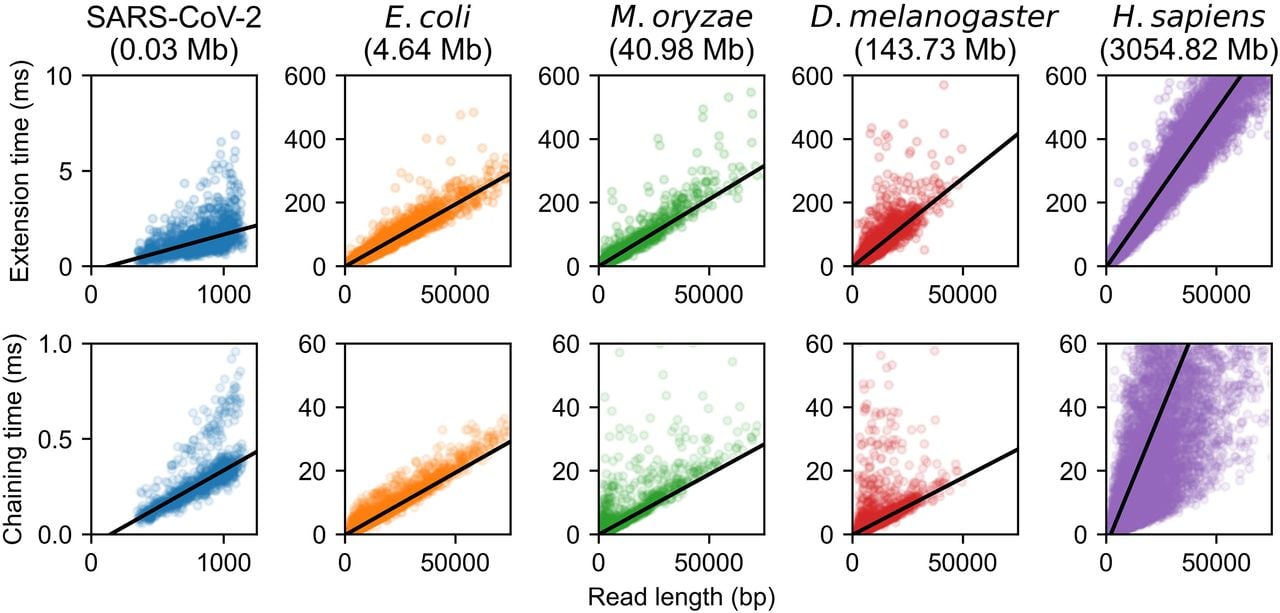
In Figure 2, we plot the times of chaining and extension and perform a robust linear regression using the Siegel estimator (Siegel 1982) as a function of the read length m. For this plot specifically, we only timed alignments in which the read was > 90% aligned by our seed-chain-extend implementation. For each plot, the genome size n is held fixed. For fixed n, all runtimes are well approximated by a linear function in m as predicted by our theory, although chaining times for the human genome have higher variance owing to the presence of repetitive k-mers.
Extension and chaining time for real ONT reads with ≈5% sequence divergence. k-mer size was chosen to be k = C log n for reference length n and with error parameter θ = 0.05. Exact data sets are described in Supplemental Table S1. Note the scaled axes for the SARS-CoV-2 reads, which were much smaller than the other data sets. The well-fit linear regression lines indicate essentially linear runtime in read length with fixed reference length n (i.e., fixed k = C log n and constant C), although larger human chaining time variance is owing to repetitive k-mers.
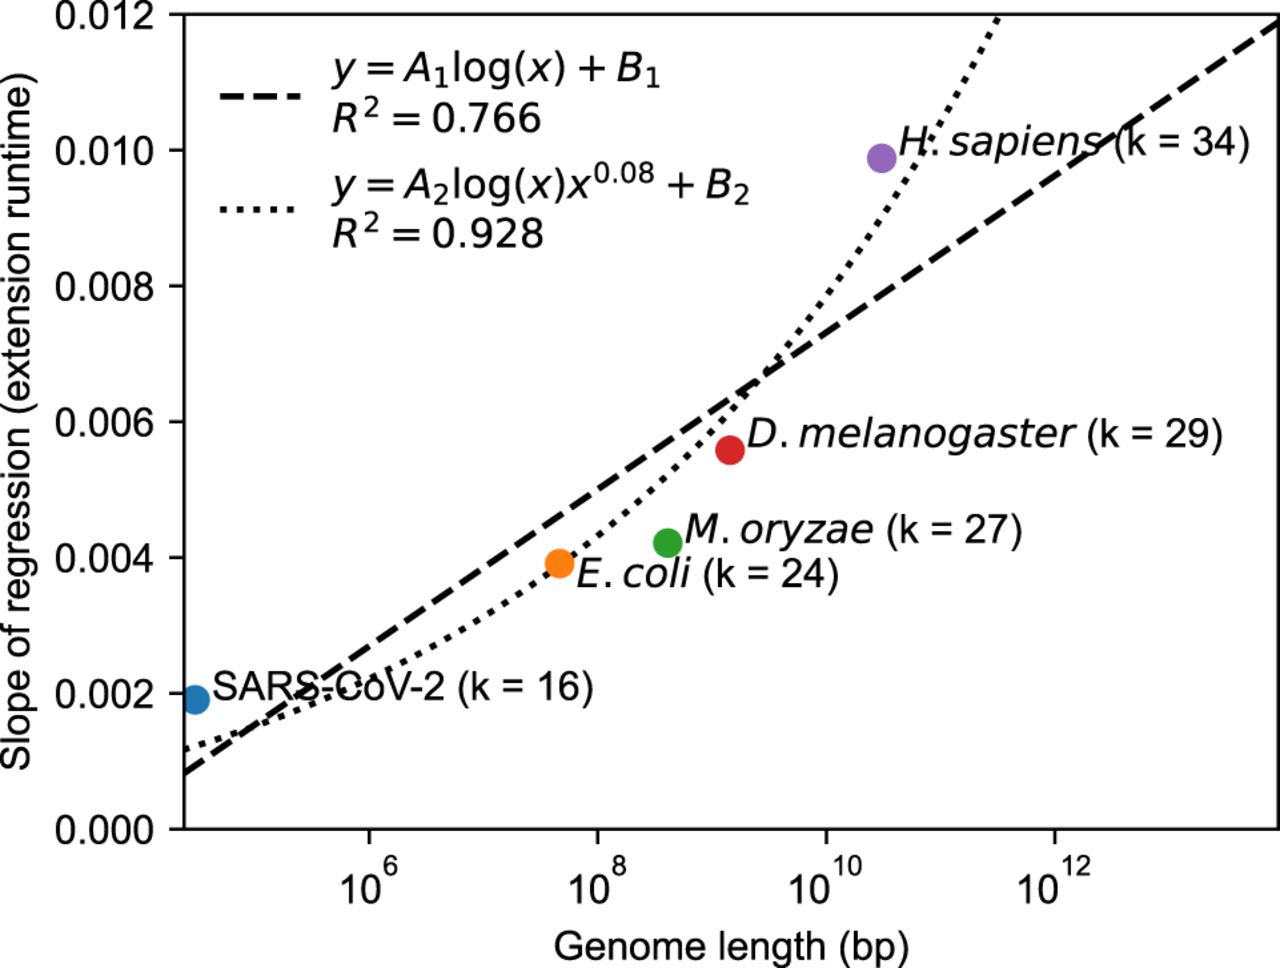
In Figure 3, we plot the slopes of the regressions for extension time obtained from the first row of Figure 2, which measures the dependence on n given fixed m. This dependence is reasonably fit by a log n function (R2 = 0.766), so O(mlog n) is not a bad approximation for the runtime in practice. However, our theory leads to a nCαlog n dependence, which comes from the big O extension runtime. Cα ≈ 0.08 when θ = 0.05 in our setup, so by using a n0.08log n function instead, we end up getting a better fit (R2 = 0.928), as predicted by our theory.
Data points represent the slopes of the linear regressions in Figure 2 for extension, with the corresponding value of k (which is k = C log n for a constant ). This dependence of the genome size, n (x-axis), is decently approximated by a naive A1log (n) + B1 fit, where A1 and B1 are parameters. However, our theory states that the dependence should be log (n)nCα with Cα ≈ 0.08 when θ = 0.05. Fitting A2log (n)n0.08 + B2 gives a better R2 value (0.928 vs. 0.766) with the same number of parameters (two parameters for both fits), indicating the goodness of our theoretical predictions.
Recoverability upper bound by aligned fraction
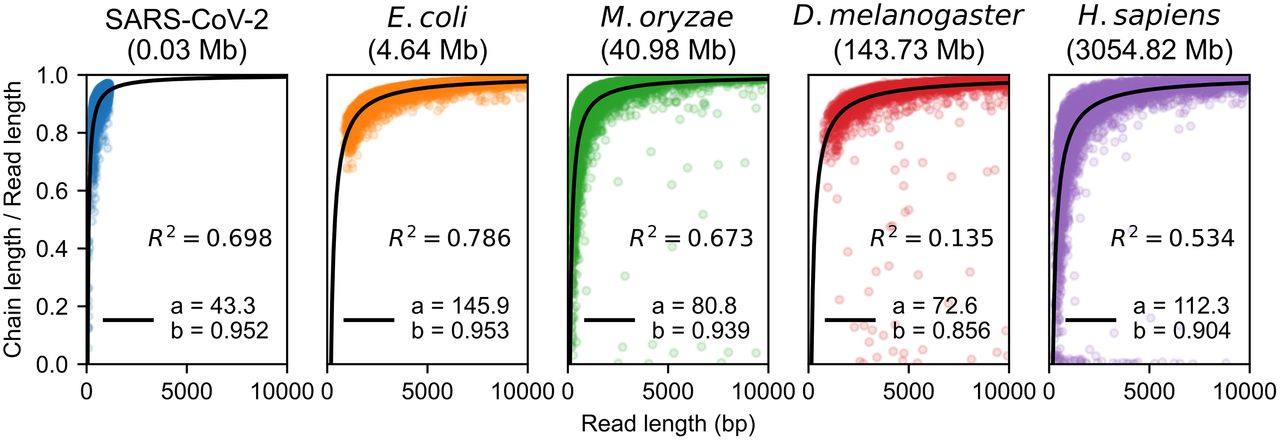
Recoverability is not measurable on real, nonsimulated reads because true sequence homology is not known. However, we can upper bound recoverability by simply measuring the length of the chain relative to the read length, as any homologous bases outside of the chain (i.e., not within the first and last anchor) cannot be recovered under our model. We call this the aligned fraction, which our theory also predicts should be in expectation (with implied constants depending on θ and n). Practically, the aligned fraction is easily interpretable, and the ability to predict the aligned fraction is useful for ensuring that reads with a given error rate and k-mer size are long enough to align to a reference.
We also observed that the aligned fraction was the main cause of recoverability loss in the simulated experiments (see Supplemental Fig. S9), and it turns out that the main term in the theoretical recoverability result exactly comes from bounding the aligned fraction in the proof (Supplemental Lemma S7), so this quantity is theoretically relevant as well.
In Figure 4, we plot the aligned fraction for each data set. We perform a least-squares fit of the function , where a and b are parameters. We exclude points with < 0.25 aligned fraction if the read length is greater than 1000 when fitting because these points appear to be outliers caused by poor chaining and can bias the least-squares fit. The resulting fits for all plots are reasonable, with R2 > 0.5 except for the D. melanogaster data set. The seemingly small value of R2 can be explained by the fact that most reads (passing our filters) are well aligned, so the data are almost constant and ≈1. Constant data will have R2 = 0, so we cannot do much better in this case. Nevertheless, b > 0.85 on all data sets, suggesting that our term may be too conservative. However, the exact parameter values in the fit are highly sensitive to the fitting methodology, so the exact values displayed are only suggestive and not to be overinterpreted.
The aligned fraction of the aligned reads, which is chain length divided by read length. We fit a function of the form , where m is the read length (x-axis), and display the resulting R2 values. Aligned fraction is an upper bound for recoverability, and our lower bound on recoverability (and also aligned fraction) is , which the data suggest may be too conservative.
Discussion
In this work, we are able to rigorously justify the empirical results seen by the seed-chain-extend heuristic through average case analysis under a simple mutation model. We showed the alignment is both accurate and fast: fraction of the sequence homology is recoverable from the chain while only running in O(mnCαlog (n)) time, where for even a moderate mutation rate θ = 0.05, Cα < 0.08. A recent aligner (Koerkamp and Ivanov 2022) empirically achieved this predicted n1.08 runtime for θ = 0.05 on two length-n sequences using similar but distinct techniques. In addition, we also proved that one can sketch to arbitrary densities 1/c, where c < k = O(log n), while asymptotically decreasing runtime and without asymptotically decreasing recoverability, justifying the effectiveness of sketching. Because our setup is modeled by techniques used by practical software such as minimap2, our results provide a theoretical backing for why modern sequence alignment software actually performs so well in practice.
We verified our theoretical results in a synthetic experiment, which showed that our main theoretical predictions were valid for our random model. Specifically, our strongly subquadratic bounds predict runtime well; sketching can decrease chaining time without increasing extension time too much; and recoverability is high. Importantly, our results generalize past our uniform string and point substitution assumptions; we show that the runtimes for aligning real nanopore reads to references are still well approximated by our theory. However, on more complex, repetitive genomes, our runtime predictions for chaining break down owing to real k-mers being much more repetitive than under a uniform random model.
In terms of further work, we propose two possible directions. The first is to optimize the bounds obtained for the current random model proposed in this work, which assumes uniformly random strings and point substitutions. The second is to generalize the random model to model complex genomes more accurately, for example, repetitive k-mers.
Improving bounds for the current random model
For runtime, it seems unlikely that the expected runtime is truly quasilinear owing to the fundamental quantity (1 − θ)k = (1 − θ)C log n = n−Cα, the likelihood of a k-mer match, decreasing faster than logarithmically in n when k = Θ(log n); this turns out to be the cause of the nCα term in the runtime (see Methods). Despite this, we believe there can be significant improvements for our bounds in Theorems 1 and 2. The most significant aspect that we believe can be improved is the restriction on the constant C. C is required to be , which seems unsatisfactory because this leads to high k-mer sizes, for example, k = 34 for θ = 0.05 on the human genome. This is much larger than the k-mer sizes used by noisy long-read aligners in practice (minimap2 defaults to k = 15).
The restricted values of C is because of our analysis of spurious anchors relying on a relatively weak variance bound (Lemmas 3 and 4). To use the bound effectively, C must be quite large. The variance bound is also the cause for the bound for recoverability, which we also believe can be tightened based on both the simulated and real experiments. To surpass these bounds, a deeper understanding of spurious anchor subsequences must be developed. Spurious subsequences of anchors is a very similar problem to common subsequences in random strings for extremely large alphabets, a topic that has had much theoretical attention (Chvátal and Sankoff 1975; Navarro 2001; Kiwi et al. 2005; Lember and Matzinger 2009).
Generalizing the random model
Our current random model does not model complex genomes properly. It is well known that genomes can be extremely repetitive (de Koning et al. 2011), which violates the uniform random string assumption. This is why the expected runtime of chaining deviates from our predictions in Figure 2 for the human genome. One idea for modeling repeats is to use a k-mer Markov model for the random strings instead of an independent uniform string. However, the analysis of such models is highly nontrivial (Reinert et al. 2000), and our techniques for analyzing k-mers in this work may not apply. Regardless of how repeats are modeled, any sort of nontrivial analysis would still require a better handling of spurious anchor subsequences, which is exactly the issue that needs to be tackled in order to improve the bounds for our current model.
Another direction is to incorporate indels into the random model. The technical reason we opted for modeling point substitutions instead of indels is that indels complicate the statistics of k-mer matching. For example, an indel of the nucleotide A may not “change” the 4-mers in the sequence AAAAAA, and sequence homology becomes ambiguous. A formulation of an “indel channel” as a model of sequence mutation was used by Ganesh and Sy (2020) for analysis of edit distance, but the resulting analysis for this model was more complex than in the independent substitution case.
Generalizing our model to small indels seems less pressing as our theory was successful for real nanopore data, which have many small indel errors, showing that the substitution model already generalizes well to small indels. However, modeling large structural variations could be a relevant problem.
Methods
Homology and recoverability
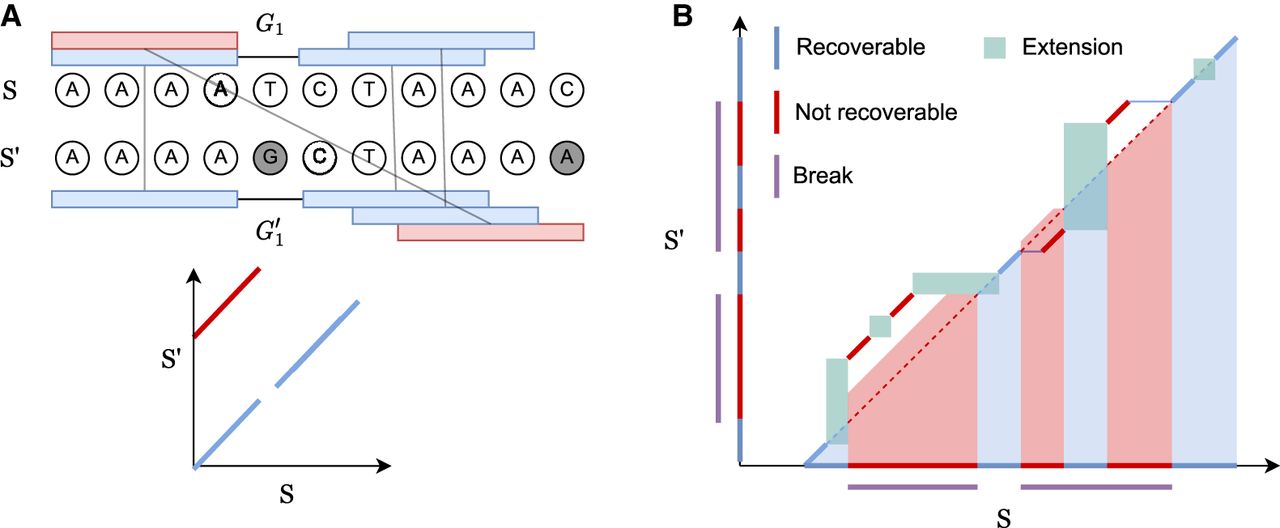
Let the interval [a..b] be the discrete interval {a, a + 1, …, b} and S[a..b] be the substring indexed by [a..b]. S′ is a mutated version of the substring S[p + 1..p + m] of length m starting at p + 1, so the optimal alignment should map S′ to the homologous indices [p + 1..p + m]. We now define recoverability as the number of homologous bases one can possibly recover by seed-chain-extend; a visual example is shown in Figure 5.
Definition 1. Let an alignment matrix be given as [1..|S|] × [p + 1..p + |S′|]. Define the homologous diagonal DH = {(p + 1, p + 1), …, (p + |S′|, p + |S′|)}. Given a chain C, let be the set of possible alignments obtained by extending through gaps and k-mer matching, where indicates x and y can be aligned. Then the set of recoverable bases is , and the recoverability is .
We define carefully in Section B in the Supplemental Materials and give a visual explanation in Figure 5B. Note that an optimal chain with respect to our linear-gap cost objective u − ζ[(iu − i1) + (ju − j1)] does not directly optimize for recoverability. We provably find the chain with the optimal linear-gap cost, and then we will argue that it leads to good recoverability.
Seed-chain-extend visualized on an alignment matrix. Anchors are short diagonal matches in the matrix. Extension corresponds to performing dynamic programming (DP) on the submatrix between anchors. (A) k-mer anchors under mutations and their corresponding alignment matrix. Blue anchors are homologous anchors, and red are spurious anchors. (B) consists of anchors and DP matrices. Recoverable bases correspond to the bases on the homologous diagonal where a k-mer lies or is accessible by the green DP matrix between gaps. Breaks cover nonrecoverable sections.
Traditionally, alignment optimality is defined using a generalized edit distance (Vingron and Waterman 1994). However, these distances are only used as a proxy for detecting sequence homology (Thorne et al. 1991; Batzoglou 2005; Lunter et al. 2005). We know the true underlying sequence ancestry in our model, so defining optimality with respect to sequence homology suits the actual goal of sequence alignment. The reason for the name “recoverability” is that extension could potentially recover all recoverable bases, but this depends on the extension algorithm and is not guaranteed (Lunter et al. 2008).
Under our model, the trivial O(1) alignment that aligns S′ back to the originating substring of S without indels is the most homologous. This may seem to make our results superfluous; however, remember that the algorithm does not know where S′ “begins” if m < n. Also, although we do not attempt the case with indels, seed-chain-extend is still valid when indels are present, whereas the trivial solution does not allow for indels.
We will lower bound . To do this, we will work with a more natural object called a break.
Definition 2. (inspired by Ganesh and Sy 2020). We call matching bases and anchors of the form (x, x) homologous and spurious otherwise. Given a chain ((i1, j1), …, (iu, ju)) and a maximal interval [p..q] such that (ip, jp), …, (iq, jq) are all spurious anchors, define the break B as B = [min (ip, jp)..max (iq, jq) + k − 1]. Let the length or size of a break be L(B) = max (iq, jq) − min (ip, jp) + k and be the total length over all breaks.
Lemma 1. Given any chain , we have that .
We prove Lemma 1 in the Supplemental Materials. The concept of a break is illustrated in Figure 5B. Breaks cover nonrecoverable regions, so subtracting the breaks from the span of the anchors lower bounds the recoverability.
Fundamental tools and bounds
In this section, we describe some fundamental tools for dealing with pairs of random mutating strings. We first need to give a careful probabilistic exploration of random k-mer anchors on S = x1x2… and S′ = yp+1yp+2… . This requires a bit of work owing to the dependence between the random strings S, S′. For the rest of the paper, missing proofs can be found in the Supplemental Materials. Supplemental Figures S2 through S6 are visual aids for our proofs and can also be found in the Supplemental Materials.
Definition 3. Let M(i, j) be random variables such that M(i, j) = 1 if xi = yj and 0 otherwise. Let A(i, j) be a random variable is an indicator random variable for the presence of a k-mer anchor at positions (i, j). We will also refer to A(i, j) variables as “anchors.”
We would like for M(i, j), M(i + 1, j + 1) to be independent, so finding the probability of k-mer matches is easy. However, in our model, it is not actually obvious a priori that M(i, j), M(i + 1, j + 1) are independent when j ≠ i. Consider M(1, 2) and M(2, 3). The former is a function of x1, y2; the latter, x2, y3. However, x2 and y2 are dependent in our model, so more work is needed. A convenient graphical representation of independence for the M random variables is the match graph, which we define below.
Definition 4. The match graph of a set of random variables of the form is a graph , where the vertices V are the letters x1, …, xn+k−1, yp+1, …, yp+m+k−1, and the edges
A match graph is shown in Supplemental Figure S1. The main reason for defining the match graph is the following theorem, which allows us to graphically determine independence of the A variables.
Theorem 3. The random variables , where iℓ ≠ jℓ for all , are independent if the induced match graph has no cycles.
Corollary 1. If i ≠ j, . Otherwise, .
We will denote the random variables and , respectively, as the number of homologous anchors and spurious anchors; we will drop the dependence on n, m to simplify notation. These are key random variables that we wish to bound later on. The theorem below follows directly from Corollary 1 by linearity of expectation.
Theorem 4. , and . In particular, .
Bounding sums of k-mer random variables
We proceed to bound the distribution of the random variables NS and NH, which are sums of dependent random variables. We first bound NS by computing the second moments and using variance-based bounds. To do this, we need to examine the independence structure of the A(i, j) random variables.
Lemma 2. For A(i, j) and A(h, l), if both of the following conditions hold—
1. |i − h| ≥ k or |j − l| ≥ k and
2. |i − l| ≥ k or |j − h| ≥ k,
Intuitively, the first condition states that two anchors do not overlap too much; for example, A(1, 1) and A(2, 2) are not independent when k = 3. The intuition behind the second condition can be illustrated by the following situation in which k = 1 and θ ≈ 0: consider the anchors A(1, 5), A(5, 1). Because it is likely that x1 = y1 and x5 = y5, if x1 = y5, then x5 = y1 with high probability, so x1 = y5 is not independent of x5 = y1.
Corollary 2. If A(i, j) and A(h, l) satisfy Lemma 2, they are independent.
Proof. By Condition 1 in Lemma 2, A(i, j) and A(h, l) do not share any M variables; that is, A(i, j) = M(i, j)M(i + 1, j + 1)… and similarly for A(h, l), but no product shares a variable with the others. Because the match graph has no cycles under these conditions, by Theorem 3, all M variables are independent so as desired.
We can also bound expected values of , and NSNH, giving us variance estimates.
Lemma 3. . Thus, the variance Var(NS) can be upper bounded by . Furthermore, and .
Now we can use the variance bound and Chebyshev's inequality to get the result below. Note the bound uses k = C log n; we will prefer this form for quantities directly used for proving the main result. The label F1 in the theorem refers to the particular event space for which the bound always holds. We will label each proposition that holds with high probability with the event space that we are operating in. We will continue this convention for the rest of the paper as this will be useful when computing our final bounds.
Lemma 4 (F1). With probability , the number of spurious anchors is . That is,
Proof. Use Chebyshev's inequality with Lemma 3's bound on Var(NS) along with the inequality .
If C > 3, then for large n, NS = 0 with high probability, and our analysis would be easy. However, we want C as small as possible. It turns out we can make C ≈ 2 for reasonable θ, significantly tightening our bounds.
For NH, we can get a stronger exponential bound because of its independence structure. A(i, i)s, which we call homologous anchors, are only dependent in a small neighborhood around i of size k because k-mers on nonoverlapping substrings are independent. This is called k-dependence (not to be confused with k-independence) and is used by Blanca et al. (2022) to show NH is asymptotically normal. Concentration bounds can also be translated in the k-dependent scenario (Janson 2004).
Theorem 5. (dependent Chernoff–Hoeffding bound; corollary 2.4 from Janson 2004 reworded and simplified). Suppose we have for some 0 < q < 1. A proper cover of A is a family of subsets such that all random variables in are independent and . Let be the minimum size of the cover, |I|, over all possible proper covers. Then for t ≥ 0,
Lemma 5.
Proof. We simply use Theorem 5 with q = (1 − θ)k. By k-dependence, we can easily see that , where is a partition satisfying the independence condition, and we will have at most k sets. Thus, , and we are done.
Proof of nonsketched main result
To prove the main result on seed-chain-extend without sketching, we will need to bound three quantities in expectation: the runtime of chaining, the recoverability of chaining, and the runtime of extension.
We first bound O(E[Nlog N]), the expected runtime of chaining (and also anchor sorting). Note that We would like E[Nlog N] = O(E[N] log E[N]) = O(mn−Cαlog m) to hold. Unfortunately, Jensen's inequality only gives E[Nlog N] ≥ E[N] log E[N] because xlog x is convex. However, with a bit more work, we get the following:
Theorem 6. Assume for some , and . Letting N be the total number of k-mer anchors, E[Nlog N] = O(E[N] log E[N]) = O(mn−Cαlog m). Thus, the runtime of chaining is O(mn−Cαlog m).
Now we bound the expected recoverability of the chain. Given S and S′, let a homologous gap of size ℓ + k − 1 bases be an interval of ℓ consecutive k-mers for which no homologous anchors exist (i.e., the k-mers are mutated). In the context of a chain, a homologous gap will refer to a gap flanked by two homologous anchors. Technically, if ℓ consecutive k-mers are uncovered but are flanked by two homologous anchors, this gives ℓ − k + 1 uncovered bases. We will ignore these factors of k as we will show that they are asymptotically small. It turns out homologous gaps grow relatively slowly in n with high probability.
Lemma 6. With probability ≥1 − 1/n, no homologous gap has size greater than
In a chain, gaps may also be flanked by one or two spurious anchors. We call these nonhomologous gaps. We first bound break lengths, which will imply good recoverability, and bound nonhomologous gaps later on.
Lemma 7 (F1 + F2). Take any and let , where . Assume for some . Then for large enough n, there are no breaks of length ≥m1/2 with probability greater than 1 − 2/n in an optimal chain.
Corollary 3. Under the same assumptions as in Lemma 7, the expected recoverability of any optimal chain is .
The idea behind proving the above propositions is to work in a space of events , where “bad events” do not occur and any optimal chain has good recoverability. Because this space of bad events is small, they do not contribute to our expected value too much. This finishes the recoverability result for the main theorem.
The last step is to bound extension running time, and this comes down to separately bounding the size of the homologous and nonhomologous gaps in any optimal chain. We bound the runtime of extension through homologous gaps by directly calculating the expectation through all possible homologous gaps. We then show that the runtime through nonhomologous gaps is small and does not contribute to the asymptotic term.
Lemma 8. Let be the time of extension over only the homologous gaps of any optimal chain. .
Lemma 9. Let be the runtime of extension through only the nonhomologous gaps of an optimal chain. Under the same assumptions as in Lemma 7, .
Now we have enough results to prove Theorem 1.
Proof (Theorem 1). The expected runtime of chaining follows from Theorem 6. The recoverability result follows from Corollary 3. The expected runtime of extension is , and are both O(mnCαlog (n)) by Lemmas 8 and 9. This completes the proof as long as we satisfy the assumptions of Lemma 7 and Theorem 6 on C, α. To satisfy the assumptions, we require , , and C α < 1/2; otherwise, for large enough n. It is not hard to check that the limiting condition is α < 1/6, so we require −log 4(1 − θ) < 1/6. This works out to be . We can also remove the minimum condition on C because α < 1/6 implies .
Sketching and local k-mer selection
Now consider not selecting all of the k-mers in a string, but only a subset of them during the initial seeding step. This allows one to chain only a subset of the k-mers, potentially providing runtime savings.
We use the open syncmer method (Edgar 2021). Given a string, we take all k-mers of the string and break the k-mer into s-mers with s < k. There are k − s + 1 s-mers in the k-mer. We select or seed the k-mer if the smallest s-mer (subject to some ordering, which we choose as uniform random) is in the -th one-indexed position; we call a selected k-mer an open syncmer. Given repeated smallest s-mers, we take the rightmost one to be the smallest. Finding the smallest s-mer among the k − s + 1 s-mers in a k-mer takes k − s + 1 iterations, so finding all open syncmer seeds in S′ takes O((k − s + 1)m) = O(mk) = O(mlog n) time.
The expected fraction of selected k-mers over a string with i.i.d. uniform letters is called the density, and it is for the open syncmer method (up to a small error term which we will ignore) (see (Zheng et al. 2020). We will let c be the reciprocal of the density, so c = (k − s + 1).
The original open syncmer definition had a parameter t, where a k-mer was selected if the smallest s-mer was in the tth position; we proved previously (Shaw and Yu 2022) that the optimal t is with respect to maximizing the number of conserved bases from k-mer matching. The reason we choose open syncmers is primarily to the following fact, which was shown by Edgar (2021):
Theorem 7. Define . If k − s + 1 is odd, two consecutive open syncmers must have starting positions ≥t bases apart. If even, they must have starting positions ≥t − 1 bases apart.
Theorem 7 follows by examining the smallest s-mer in a k-mer and noticing that in the next overlapping k-mer, the locations for the new smallest s-mer are restricted. This theorem is the reason we use open syncmers and is crucial to our proofs. The spacing property makes selected open syncmers a polar set (Zheng et al. 2021); other methods also give rise to polar sets (Frith et al. 2021, 2023) but open syncmers seem to perform well empirically (Dutta et al. 2022; Shaw and Yu 2022; Frith et al. 2023) and are easy to describe. For the rest of the section, we will assume c = k − s + 1 is odd, so .
Let A(i, j) be the random variables as defined before. Let J(i) be the indicator random variable set to 1 when the ith k-mer is selected on S as an open syncmer; J′(j), similarly for the jth k-mer on S′. We now wish to calculate E[J(i)J′(j)A(i, j)], the probability that a k-mer match exists and the k-mer is an open syncmer.
Lemma 10. If i = j, then . Otherwise, .
Proof. If A(i, j) = 1, then the ith k-mer and jth k-mer are the same. If a k-mer is selected as an open syncmer on S, it must also be selected on S′, so . A(i, j) and J(i) are independent because we assume the random ordering for the s-mers is independent of the random mutations. Using the law of total expectation and Theorem 4 gives the result for both cases.
Definition 5. We will replace all random variables involving anchors and matches with a superscript * to indicate sketched seeds; for example, A(i, j)* = A(i, j)J(i)J′(j), M*, , etc.
Corollary 4. The expected total number of anchors after applying open syncmer seeds with density is
The above follows directly from Lemma 10. As expected, subsampling to a fraction of the k-mers gives expected hits. Note the important property of context independence used in the proofs: If A(i, j) = 1, then J(i) = J′(j). This property is not satisfied if one were sampling k-mers randomly or using minimizers (Roberts et al. 2004).
We now deduce the sketched moment bounds on N*:
Lemma 11. The variance can be upper bounded by . Furthermore, and .
Lemma 12 (F1*). .
The sketched moment bounds allow us to start reanalyzing the crucial propositions in the subsection “Proof of nonsketched main result” but in the context of sketching. The first main result is that sketching reduces the chaining time as one would expect.
Theorem 8. Under the same assumptions as in Theorem 6, letting N* be the total number of sketched k-mer anchors, the expected chaining time is .
The second result we wish to highlight is the new bound on extension runtime through homologous gaps.
Lemma 13. The expected runtime of sketched extension through the homologous gaps in an optimal chain is. If c = Θ (log n), then .
It will turn out that in the sketched case, extension over homologous gaps also dominates runtime. Because we sketch with density , this result states that we can sketch with decreasing density and have the same asymptotic extension time as without sketching, which is surprising. The crucial fact we use in the proof of Lemma 13 is Theorem 7, which shows that open syncmer seeding weakens the k-dependence of the seeds because they are now at least (c + 1)/2 bases apart. This tightens the bound in Theorem 7 and also shows that the sketched maximum homologous gap size is Θ (g(n)), with g(n) as in Lemma 6.
If we used other methods such as closed syncmers (Edgar 2021) or FracMinHash (Irber et al. 2022; Rahman Hera et al. 2023), then we would recover the O(c · mnCαlog n) result in Lemma 13 but not the result. Thus, we have saved a log factor by using open syncmers when we let c = Θ (log n). The bulk of Section E in the Supplemental Materials is dedicated to proving Lemma 13.
The key quantities used for the rest of the proofs are and g′(n), the new maximum homologous gap size. We will prove g′(n) = Θ (g(n)) with g(n) as in Lemma 6, so the only asymptotic difference in these bounds is a factor of in . Because we want to be small, this does not affect downstream analysis. It follows that the proofs of the rest of the lemmas in the subsection “Proof of nonsketched main result” can be replicated almost verbatim. We give a sketch of these proofs in the Supplemental Materials.
Software availability
Scripts for regenerating the simulated experiments are available at GitHub (https://github.com/bluenote-1577/basic_seed_chainer/). The aligner used for the real nanopore experiments is available at GitHub (https://github.com/bluenote-1577/sce-aligner/) along with scripts for regenerating figures. All scripts are also available as Supplemenal Code.
Competing interest statement
The authors declare no competing interests.
Acknowledgments
J.S. was supported by a Natural Sciences and Engineering Research Council of Canada (NSERC) CGS-D scholarship. This work was supported by NSERC grant RGPIN-2022-03074.
Author contributions: Both authors contributed to the development of the methods and proofs. J.S. implemented the software and performed the experiments.
Notes
[1] Supplementary material [Supplemental material is available for this article.]
[2] Article published online before print. Article, supplemental material, and publication date are at https://www.genome.org/cgi/doi/10.1101/gr.277637.122.
[3] Freely available online through the Genome Research Open Access option.
References
- ↵Abouelhoda MI, Ohlebusch E. 2005. Chaining algorithms for multiple genome comparison. J Discrete Algorithms 3: 321–341. 10.1016/j.jda.2004.08.011
- ↵Alser M, Rotman J, Deshpande D, Taraszka K, Shi H, Baykal PI, Yang HT, Xue V, Knyazev S, Singer BD, 2021. Technology dictates algorithms: recent developments in read alignment. Genome Biol 22: 249. 10.1186/s13059-021-02443-7
- ↵Altschul SF, Gish W, Miller W, Myers EW, Lipman DJ. 1990. Basic local alignment search tool. J Mol Biol 215: 403–410. 10.1016/S0022-2836(05)80360-2
- ↵Backurs A, Indyk P. 2018. Edit distance cannot be computed in strongly subquadratic time (unless SETH is false). SIAM J Comput 47: 1087–1097. 10.1137/15M1053128
- ↵Batzoglou S. 2005. The many faces of sequence alignment. Brief Bioinform 6: 6–22. 10.1093/bib/6.1.6
- ↵Berger B, Daniels NM, Yu YW. 2016. Computational biology in the 21st century: scaling with compressive algorithms. Commun ACM 59: 72–80. 10.1145/2957324
- ↵Berger B, Waterman MS, Yu YW. 2021. Levenshtein distance, sequence comparison and biological database search. IEEE Trans Inf Theory 67: 3287–3294. 10.1109/TIT.2020.2996543
- ↵Blanca A, Harris RS, Koslicki D, Medvedev P. 2022. The statistics of k-mers from a sequence undergoing a simple mutation process without spurious matches. J Comput Biol 29: 155–168. 10.1089/cmb.2021.0431
- ↵Britten RJ. 2002. Divergence between samples of chimpanzee and human DNA sequences is 5%, counting indels. Proc Natl Acad Sci 99: 13633–13635. 10.1073/pnas.172510699
- ↵Chaisson MJ, Tesler G. 2012. Mapping single molecule sequencing reads using basic local alignment with successive refinement (BLASR): application and theory. BMC Bioinformatics 13: 238. 10.1186/1471-2105-13-238
- ↵Chao K-M, Pearson WR, Miller W. 1992. Aligning two sequences within a specified diagonal band. Bioinformatics 8: 481–487. 10.1093/bioinformatics/8.5.481
- ↵Chvátal V, Sankoff D. 1975. Longest common subsequences of two random sequences. J Appl Probab 12: 306–315. 10.2307/3212444
- ↵Colquhoun RM, Hall MB, Lima L, Roberts LW, Malone KM, Hunt M, Letcher B, Hawkey J, George S, Pankhurst L, 2021. Pandora: nucleotide-resolution bacterial pan-genomics with reference graphs. Genome Biol 22: 267. 10.1186/s13059-021-02473-1
- ↵de Koning APJ, Gu W, Castoe TA, Batzer MA, Pollock DD. 2011. Repetitive elements may comprise over two-thirds of the human genome. PLoS Genet 7: e1002384. 10.1371/journal.pgen.1002384
- ↵Delahaye C, Nicolas J. 2021. Sequencing DNA with nanopores: troubles and biases. PLoS One 16: e0257521. 10.1371/journal.pone.0257521
- ↵Durbin R, Eddy SR, Krogh A, Mitchison G. 1998. Biological sequence analysis: probabilistic models of proteins and nucleic acids. Cambridge University Press, Cambridge.
- ↵Dutta A, Pellow D, Shamir R. 2022. Parameterized syncmer schemes improve long-read mapping. PLoS Comput Biol 18: e1010638. 10.1371/journal.pcbi.1010638
- ↵Edgar R. 2021. Syncmers are more sensitive than minimizers for selecting conserved k‐mers in biological sequences. PeerJ 9: e10805. 10.7717/peerj.10805
- ↵Farrar M. 2007. Striped Smith–Waterman speeds database searches six times over other SIMD implementations. Bioinformatics 23: 156–161. 10.1093/bioinformatics/btl582
- ↵Fofanov Y, Luo Y, Katili C, Wang J, Belosludtsev Y, Powdrill T, Belapurkar C, Fofanov V, Li T-B, Chumakov S, 2004. How independent are the appearances of n-mers in different genomes? Bioinformatics 20: 2421–2428. 10.1093/bioinformatics/bth266
- ↵Frith MC, Noé L, Kucherov G. 2021. Minimally overlapping words for sequence similarity search. Bioinformatics 36: 5344–5350. 10.1093/bioinformatics/btaa1054
- ↵Frith MC, Shaw J, Spouge JL. 2023. How to optimally sample a sequence for rapid analysis. Bioinformatics 39: btad057. 10.1093/bioinformatics/btad057
- ↵Ganesh A, Sy A. 2020. Near-linear time edit distance for indel channels. In 20th International Workshop on Algorithms in Bioinformatics (WABI 2020), Pisa, Italy, Vol. 17, pp. 1–18. 10.4230/LIPIcs.WABI.2020.17
- ↵Irber LC, Brooks PT, Reiter TE, Pierce-Ward NT, Hera MR, Koslicki D, Brown CT. 2022. Lightweight compositional analysis of metagenomes with FracMinHash and minimum metagenome covers. bioRxiv 10.1101/2022.01.11.475838
- ↵Ivanov P, Bichsel B, Vechev M. 2022. Fast and optimal sequence-to-graph alignment guided by seeds. In International Conference on Research in Computational Molecular Biology, La Jolla, CA, pp. 306–325.
- ↵Jain C, Rhie A, Zhang H, Chu C, Walenz BP, Koren S, Phillippy AM. 2020. Weighted minimizer sampling improves long read mapping. Bioinformatics 36: i111–i118. 10.1093/bioinformatics/btaa435
- ↵Jain C, Gibney D, Thankachan SV. 2022. Co-linear chaining with overlaps and gap costs. In International Conference on Research in Computational Molecular Biology, San Diego, CA, pp. 246–262.
- ↵Janson S. 2004. Large deviations for sums of partly dependent random variables: large deviations for dependent random variables. Random Struct Algorithms 24: 234–248. 10.1002/rsa.20008
- ↵Kalikar S, Jain C, Vasimuddin M, Misra S. 2022. Accelerating minimap2 for long-read sequencing applications on modern CPUs. Nat Comput Sci 2: 78–83. 10.1038/s43588-022-00201-8
- ↵Keich U, Li M, Ma B, Tromp J. 2004. On spaced seeds for similarity search. Discrete Appl Math (1979) 138: 253–263. 10.1016/S0166-218X(03)00382-2
- ↵Kiełbasa SM, Wan R, Sato K, Horton P, Frith MC. 2011. Adaptive seeds tame genomic sequence comparison. Genome Res 21: 487–493. 10.1101/gr.113985.110
- ↵Kiwi M, Loebl M, Matoušek J. 2005. Expected length of the longest common subsequence for large alphabets. Adv Math (N Y) 197: 480–498. 10.1016/j.aim.2004.10.012
- ↵Koerkamp RG, Ivanov P. 2022. Exact global alignment using A* with seed heuristic and match pruning. bioRxiv 10.1101/2022.09.19.508631
- ↵Koonin EV, Aravind L, Kondrashov AS. 2000. The impact of comparative genomics on our understanding of evolution. Cell 101: 573–576. 10.1016/S0092-8674(00)80867-3
- ↵Köster J. 2016. Rust-Bio: a fast and safe bioinformatics library. Bioinformatics 32: 444–446. 10.1093/bioinformatics/btv573
- ↵Langmead B, Salzberg SL. 2012. Fast gapped-read alignment with Bowtie 2. Nat Methods 9: 357–359. 10.1038/nmeth.1923
- ↵Lember J, Matzinger H. 2009. Standard deviation of the longest common subsequence. Ann Probab 37: 1192–1235. 10.1214/08-AOP436
- ↵Li H. 2013. Aligning sequence reads, clone sequences and assembly contigs with BWA-MEM. arXiv:1303.3997 [q-bio.GN].
- ↵Li H. 2018. Minimap2: pairwise alignment for nucleotide sequences. Bioinformatics 34: 3094–3100. 10.1093/bioinformatics/bty191
- ↵Li H. 2021. New strategies to improve minimap2 alignment accuracy. Bioinformatics 37: 4572–4574. 10.1093/bioinformatics/btab705
- ↵Li H, Durbin R. 2009. Fast and accurate short read alignment with Burrows–Wheeler transform. Bioinformatics 25: 1754–1760. 10.1093/bioinformatics/btp324
- ↵Li H, Feng X, Chu C. 2020. The design and construction of reference pangenome graphs with minigraph. Genome Biol 21: 265. 10.1186/s13059-020-02168-z
- ↵Lipman DJ, Pearson WR. 1985. Rapid and sensitive protein similarity searches. Science 227: 1435–1441. 10.1126/science.2983426
- ↵Lunter G, Drummond AJ, Miklós I, Hein J. 2005. Statistical alignment: recent progress, new applications, and challenges. In Statistical methods in molecular evolution (ed. Nielsen R), pp. 375–405. Springer-Verlag, New York.
- ↵Lunter G, Rocco A, Mimouni N, Heger A, Caldeira A, Hein J. 2008. Uncertainty in homology inferences: assessing and improving genomic sequence alignment. Genome Res 18: 298–309. 10.1101/gr.6725608
- ↵Mäkinen V, Sahlin K. 2020. Chaining with overlaps revisited. In 31st Annual Symposium on Combinatorial Pattern Matching (CPM 2020), Copenhagen, Vol. 25, pp. 1–12. 10.4230/LIPIcs.CPM.2020.25
- ↵Mäkinen V, Belazzougui D, Cunial F, Tomescu AI. 2015. Genome-scale algorithm design: biological sequence analysis in the era of high-throughput sequencing. Cambridge University Press, Cambridge.
- ↵Marçais G, Delcher AL, Phillippy AM, Coston R, Salzberg SL, Zimin A. 2018. MUMmer4: a fast and versatile genome alignment system. PLoS Comput Biol 14: e1005944. 10.1371/journal.pcbi.1005944
- ↵Marçais G, Solomon B, Patro R, Kingsford C. 2019. Sketching and sublinear data structures in genomics. Annu Rev Biomed Data Sci 2: 93–118. 10.1146/annurev-biodatasci-072018-021156
- ↵Marco-Sola S, Moure JC, Moreto M, Espinosa A. 2021. Fast gap-affine pairwise alignment using the wavefront algorithm. Bioinformatics 37: 456–463. 10.1093/bioinformatics/btaa777
- ↵Medvedev P. 2022a. The theoretical analysis of sequencing bioinformatics algorithms and beyond. arXiv:2205.01785v2 [cs.DS].
- ↵Medvedev P. 2022b. Theoretical analysis of edit distance algorithms: an applied perspective. arXiv:2204.09535 [cs.DS].
- ↵Myers EW. 1986. Ano(ND) difference algorithm and its variations. Algorithmica 1: 251–266. 10.1007/BF01840446
- ↵Myers G, Miller W. 1995. Chaining multiple-alignment fragments in sub-quadratic time. In Proceedings of the Sixth Annual ACM-SIAM Symposium on Discrete Algorithms, SODA ‘95, San Francisco, CA, pp. 38–47, Society for Industrial and Applied Mathematics.
- ↵Navarro G. 2001. A guided tour to approximate string matching. ACM Comput Surv 33: 31–88. 10.1145/375360.375365
- ↵Needleman SB, Wunsch CD. 1970. A general method applicable to the search for similarities in the amino acid sequence of two proteins. J Mol Biol 48: 443–453. 10.1016/0022-2836(70)90057-4
- ↵Nurk S, Koren S, Rhie A, Rautiainen M, Bzikadze AV, Mikheenko A, Vollger MR, Altemose N, Uralsky L, Gershman A, 2022. The complete sequence of a human genome. Science (1979) 376: 44–53. 10.1126/science.abj6987
- ↵Ondov BD, Treangen TJ, Melsted P, Mallonee AB, Bergman NH, Koren S, Phillippy AM. 2016. Mash: fast genome and metagenome distance estimation using MinHash. Genome Biol 17: 132. 10.1186/s13059-016-0997-x
- ↵Otto C, Hoffmann S, Gorodkin J, Stadler PF. 2011. Fast local fragment chaining using sum-of-pair gap costs. Algorithms Mol Biol 6: 4. 10.1186/1748-7188-6-4
- ↵Rahman Hera M, Pierce-Ward NT, Koslicki D. 2023. Deriving confidence intervals for mutation rates across a wide range of evolutionary distances using FracMinHash. Genome Res (this issue) 33: 1061–1068. 10.1101/gr.277651.123
- ↵Rautiainen M, Marschall T. 2020. GraphAligner: rapid and versatile sequence-to-graph alignment. Genome Biol 21: 253. 10.1186/s13059-020-02157-2
- ↵Reinert G, Schbath S, Waterman MS. 2000. Probabilistic and statistical properties of words: an overview. J Comput Biol 7: 1–46. 10.1089/10665270050081360
- ↵Ren J, Chaisson MJP. 2021. lra: a long read aligner for sequences and contigs. PLoS Comput Biol 17: e1009078. 10.1371/journal.pcbi.1009078
- ↵Roberts M, Hayes W, Hunt BR, Mount SM, Yorke JA. 2004. Reducing storage requirements for biological sequence comparison. Bioinformatics 20: 3363–3369. 10.1093/bioinformatics/bth408
- ↵Sahlin K. 2022. Strobealign: flexible seed size enables ultra-fast and accurate read alignment. Genome Biol 23: 260. 10.1186/s13059-022-02831-7
- ↵Sahlin K, Baudeau T, Cazaux B, Marchet C. 2023. A survey of mapping algorithms in the long-reads era. Genome Biol 24: 133. 10.1186/s13059-023-02972-3
- ↵Sarmashghi S, Bohmann K, P. Gilbert MT, Bafna V, Mirarab S. 2019. Skmer: assembly-free and alignment-free sample identification using genome skims. Genome Biol 20: 34. 10.1186/s13059-019-1632-4
- ↵Shaw J, Yu YW. 2022. Theory of local k-mer selection with applications to long-read alignment. Bioinformatics 38: 4659–4669. 10.1093/bioinformatics/btab790
- ↵Siegel AF. 1982. Robust regression using repeated medians. Biometrika 69: 242–244. 10.1093/biomet/69.1.242
- ↵Sirén J, Monlong J, Chang X, Novak AM, Eizenga JM, Markello C, Sibbesen JA, Hickey G, Chang P-C, Carroll A, 2021. Pangenomics enables genotyping of known structural variants in 5202 diverse genomes. Science 374: abg8871. 10.1126/science.abg8871
- ↵Smith TF, Waterman MS. 1981. Identification of common molecular subsequences. J Mol Biol 147: 195–197. 10.1016/0022-2836(81)90087-5
- ↵Sović I, Šikić M, Wilm A, Fenlon SN, Chen S, Nagarajan N. 2016. Fast and sensitive mapping of nanopore sequencing reads with GraphMap. Nat Commun 7: 11307. 10.1038/ncomms11307
- ↵Suzuki H, Kasahara M. 2018. Introducing difference recurrence relations for faster semi-global alignment of long sequences. BMC Bioinformatics 19: 45. 10.1186/s12859-018-2014-8
- ↵Szpankowski W. 2001. Average case analysis of algorithms on sequences: Szpankowski/average. John Wiley & Sons, Hoboken, NJ.
- ↵Thorne JL, Kishino H, Felsenstein J. 1991. An evolutionary model for maximum likelihood alignment of DNA sequences. J Mol Evol 33: 114–124. 10.1007/BF02193625
- ↵Ukkonen E. 1983. On approximate string matching. In Foundations of computation theory: lecture notes in computer science (ed. Karpinski M), pp. 487–495. Springer, Berlin.
- ↵Vingron M, Waterman MS. 1994. Sequence alignment and penalty choice: review of concepts, case studies and implications. J Mol Biol 235: 1–12. 10.1016/S0022-2836(05)80006-3
- ↵Zheng H, Kingsford C, Marçais G. 2020. Improved design and analysis of practical minimizers. Bioinformatics 36: i119–i127. 10.1093/bioinformatics/btaa472
- ↵Zheng H, Kingsford C, Marçais G. 2021. Sequence-specific minimizers via polar sets. Bioinformatics 37: i187–i195. 10.1093/bioinformatics/btab313