
Abstract
Mediator is a conserved coregulator playing a key role in RNA polymerase (Pol) II transcription. Mediator also links transcription and nucleotide excision repair (NER) via a direct contact with Rad2/ERCC5(XPG) endonuclease. In this work, we analyzed the genome-wide distribution of Rad26/ERCC6(CSB) and Rad1–Rad10/ERCC4(XPF)-ERCC1, addressing the question of a potential link of these proteins with Mediator and Pol II in yeast Saccharomyces cerevisiae. Our genomic analyses reveal that Rad1–Rad10 and Rad26 are present on the yeast genome in the absence of genotoxic stress, especially at highly transcribed regions, with Rad26 binding strongly correlating with that of Pol II. Moreover, we show that Rad1–Rad10 and Rad26 colocalize with Mediator at intergenic regions and physically interact with this complex. Using kin28 TFIIH mutant, we found that Mediator stabilization on core promoters leads to an increase in Rad1–Rad10 chromatin binding, whereas Rad26 occupancy follows mainly a decrease in Pol II transcription. Combined with multivariate analyses, our results show the relationships between Rad1–Rad10, Rad26, Mediator, and Pol II, modulated by the changes in binding dynamics of Mediator and Pol II transcription. In conclusion, we extend the Mediator link to Rad1–Rad10 and Rad26 NER proteins and reveal important differences in their dependence on Mediator and Pol II. Rad2 is the most dependent on Mediator, followed by Rad1–Rad10, whereas Rad26 is the most closely related to Pol II. Our work thus contributes to new concepts of the functional interplay between transcription and DNA repair machineries, which are relevant for human diseases including cancer and XP/CS syndromes.
Chromatin binding constitutes an essential step for the functions of nuclear proteins. Genome-wide location analysis is thus a powerful tool to understand in vivo mechanisms of the chromatin-associated proteins involved in transcription and DNA repair processes. These analyses revealed the chromatin binding of Rad2, a nucleotide excision DNA repair (NER) protein, in the absence of exogenous genotoxic stress (Eyboulet et al. 2013). A high correlation between Rad2 and Mediator occupancies on regulatory regions (upstream activating sequences, UASs) was one of the starting points to propose functional interplay between these two nuclear components. NER constitutes two mechanistically distinct subpathways: global genome repair (GGR) and transcription-coupled repair (TCR). GGR occurs on chromatin with different functional states and compaction levels. TCR corresponds to a specialized pathway, allowing efficient repair of Pol II–blocking DNA damages and resumption of transcription (Fousteri and Mullenders 2008; Hanawalt and Spivak 2008). The NER machinery consists of nearly 30 proteins, but the genome-wide distribution of most NER proteins remains unknown in the absence of exogenous genotoxic stress, as well as their relationship with Mediator and Pol II.
Rad26 in yeast Saccharomyces cerevisiae, homologous to ERCC6 (also known as Cockayne syndrome B protein [CSB]) in mammalian cells, plays an essential role in the TCR pathway by interacting with Pol II to initiate the TCR complex assembly (for review, see Mullenders 2015; Boetefuer et al. 2018). Several lines of evidence indicate that Rad26/ERCC6(CSB) activity is closely related to Pol II transcription. Cryo-EM structures of yeast Rad26–Pol II (Xu et al. 2017) and human Pol II complexes with CSB and other TCR factors (Kokic et al. 2021) were recently determined, providing mechanistic insights into the role of Rad26 in TCR and in the resolution of Pol II stalling in general (Wang et al. 2018). Transcription-dependent binding of Rad26 was observed at selected transcribed regions for two inducible genes and one constitutively expressed gene without exogenous genotoxic stress (Malik et al. 2010). In human cells, ChIP-seq analysis also showed CSB association with chromatin in the absence of UV irradiation (Lake et al. 2014; Wang et al. 2014). Fluorescence imaging experiments showed a dynamic association of CSB with chromatin before UV irradiation and a stabilization of this association upon UV stress (van den Boom et al. 2004). Several lines of evidence implicate CSB in transcription after UV irradiation (Rockx et al. 2000; Proietti-De-Santis et al. 2006; Epanchintsev et al. 2017) or during replicative cell growth (Lake et al. 2014; Wang et al. 2014). In vitro, CSB was shown to enhance Pol II–transcription elongation (Selby and Sancar 1997a). CSB interacts with the stalled Pol II complex and promotes transcription at natural pause sites (Sarker et al. 2005).
Rad1–Rad10 in yeast S. cerevisiae, homologous to the ERCC4(XPF)-ERCC1 mammalian complex, is a structure-specific endonuclease essential for the NER pathway (for review, see McNeil and Melton 2012; Faridounnia et al. 2018). Rad1–Rad10/ERCC4(XPF)-ERCC1 functions as an endonuclease only as a heterodimer in which Rad1/ERCC4(XPF) provides the 5′-endonuclease activity and Rad10/ERCC1 regulates DNA– and protein–protein interactions. In vitro, the two proteins are unstable in the absence of each other (Bailly et al. 1992; van Vuuren et al. 1993). Together with the Rad2/ERCC5(XPG) 3′-endonuclease, Rad1–Rad10/ERCC4-ERCC1 is essential for the dual incision of the damaged DNA in both NER pathways. Mutations in ERCC4(XPF)-ERCC1 human genes led to xeroderma pigmentosum (XP) or XP combined with Cockayne syndrome (XP/CS), the more severe XPF-ERCC1 progeroid syndrome (XF-E) or Fanconi anemia (FA) (Cleaver et al. 2009; Menck and Munford 2014; Bukowska and Karwowski 2018). It has been recently shown that impaired NER and the persistence of the repair machinery at DNA lesions characterize XPF XP/CS patients with additional developmental and neurodegenerative symptoms (Sabatella et al. 2018). A recent study reported that a dietary restriction in ERCC1-deficient mice with accelerated aging features delayed genomic stress and improved their lifespan, thereby proposing a model for age-related diseases in which DNA lesions from exogenous and endogenous sources reduce transcriptional output in a gene-size-dependent manner (Vermeij et al. 2016). Additional roles of XPF-ERCC1 were also proposed in chromatin looping and optimal transcription activation of nuclear-receptor (NR)-dependent genes together with XPG and other NER factors (Le May et al. 2010, 2012). In a mouse model, XPF-ERCC1 was dispensable for ongoing transcription but was proposed to be involved in fine-turning of optimal activation of hepatic genes (Kamileri et al. 2012).
Mediator is an essential multisubunit coregulator playing a key role in RNA polymerase (Pol) II transcription (for review, see Kornberg 2005; Soutourina 2018). This complex, conserved from yeast to human cells, is crucial to transmit regulatory information from specific transcription factors to the Pol II basal transcription machinery. The importance of the Mediator complex is highlighted by the fact that mutations or changes in the expression level of Mediator subunits were implicated in many human diseases, including cancers or neurodevelopmental diseases (Spaeth et al. 2011; Schiano et al. 2014). Our previous work suggests that Mediator function extends beyond the transcription process (Eyboulet et al. 2013). We showed that the Mediator complex links transcription and NER via Rad2/ERCC5 3′-endonuclease (Eyboulet et al. 2013). Mediator physically interacts with the Rad2/ERCC5 DNA repair protein (Eyboulet et al. 2013; Kikuchi et al. 2015). Genome-wide location analyses revealed Rad2 chromatin binding in the absence of exogenous genotoxic stress. Rad2 was associated with upstream activating sequences (UASs) and transcribed regions of Pol II–transcribed genes, as well as with Pol III–transcribed genes and telomeric regions (Eyboulet et al. 2013). No major transcriptional role was observed for Rad2 in yeast, but our findings suggested Mediator involvement in TCR. Genetic and genomic approaches further contributed to provide insights into the functional interplay between Rad2, Mediator, and Pol II, suggesting that dynamic interactions between these nuclear components are involved in Rad2 loading to the chromatin (Georges et al. 2019).
In this study, we analyzed the genome-wide location of TCR-specific Rad26 protein and Rad1–Rad10 endonuclease that works together with Rad2 in NER. We addressed the question of the potential interplay of these proteins with Mediator and Pol II in the absence of genotoxic stress.
Results
Genome-wide location analysis of Rad26
To date, no genomic data are available for many NER proteins including Rad26, the TCR-specific component. To determine how this protein is distributed on the yeast chromatin, we performed Rad26 ChIP-seq experiments and analysis. Two yeast strains carrying N-terminal or C-terminal HA-tagged version of Rad26 were constructed. The strain expressing the N-terminally tagged Rad26 was UV resistant in a GGR-deficient rad7Δ context, whereas the C-terminally tagged version was UV sensitive (Supplemental Fig. S1A), suggesting that this version was not fully functional. The UV sensitivity was tested in a GGR-deficient context, because the rad26 deletion alone does not lead to UV sensitivity in yeast (van Gool et al. 1994). The functional N-terminal tagged version was therefore used for further study.
ChIP followed by qPCR on selected regions showed that Rad26 was enriched inside Pol II–transcribed genes (Supplemental Fig. S2A). Specific examples of ChIP-seq profiles on Figure 1A illustrate Rad26 enrichment mostly on Pol II–transcribed genes and its binding on intergenic regions. Analyses of Rad26 enrichment peaks revealed that, indeed, this protein is mainly localized on class II genes but also on other genomic regions such as intergenic sequences, tRNA genes, and centromeres (Supplemental Fig. S3). Further study was focused on Pol II–transcribed and promoter regions, because tRNA genes and centromeres displayed an apparent enrichment in control data sets from a nontagged strain precluding their precise genomic analysis. We compared the average occupancy of Rad26 with that of Pol II on Pol II–transcribed regions and observed a linear relationship with a high R2 = 0.90 (Fig. 1B) and Spearman's correlation of 0.90, whereas lower relationship was determined with the nontagged control (Supplemental Fig. S4A,C). Heat maps of tag density were generated for Rad26, Mediator (Med17 subunit), and Pol II and compared on Pol II–transcribed regions, clearly illustrating Rad26 colocalization with Pol II (Fig. 1C). As previously described (Eyboulet et al. 2013, 2015; Jeronimo and Robert 2014), Mediator ChIP signal within transcribed regions is close to untagged control and originates from a nonuniform background distribution. Rad26 ChIP-seq signal on transcribed regions for each Pol II decile shows that Rad26 profile follows exactly that of Pol II, from highest to lowest deciles (Supplemental Fig. S4D).
Genome-wide analysis of Rad26 occupancy. (A) Examples of Rad26, Pol II, and Mediator (Med17) tag density profiles in the wild-type (WT) context on Pol II–transcribed genes. Nontagged (NT) control is also included. (B) Rad26 ChIP-seq density versus Pol II ChIP-seq density on Pol II–transcribed genes. Each point on the plot corresponds to one transcribed region. A linear regression (dotted line) and an R2 linear regression coefficient are indicated. The dashed line corresponds to y = x. (C) Heat maps of Pol II, Rad26, and Mediator (Med17) ChIP-seq occupancy on the 10% Pol II–most enriched regions (scaled windows for 500 bp before TSS, between TSS and TES, and 500 bp after TES), sorted by decreasing Pol II occupancy. Median tag density profiles in reads per million (RPM) are shown in upper panels. NT control is also displayed. (D) Heat maps of Mediator (Med17), Rad26, and Pol II ChIP-seq occupancy centered on Mediator enrichment peaks (−500 bp to +500 bp; UASs), sorted by decreasing Mediator occupancy. Median tag density profiles in RPM are shown in upper panels. NT control is also displayed.
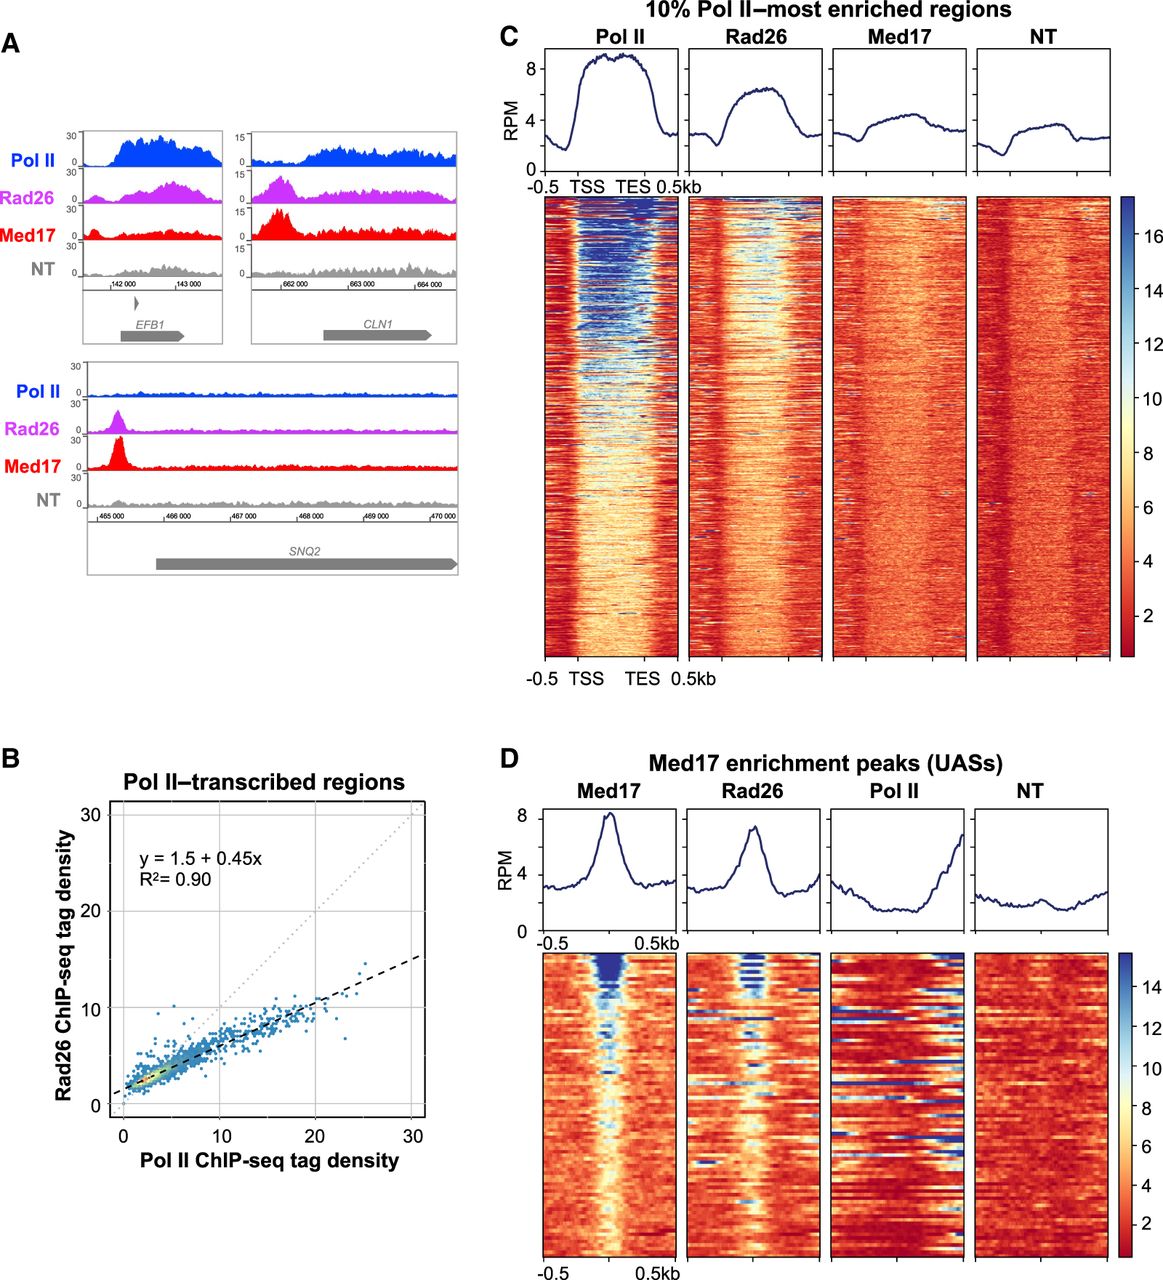
We further analyzed the presence of Rad26 on intergenic regions. Spearman's correlation showed an absence or lower relationship with input or nontagged controls, respectively (Supplemental Fig. S4B). We then focused our analysis on the Mediator enrichment peaks that correspond to UASs. The heat maps of tag density for Rad26, Mediator (Med17 subunit), and Pol II unveil a specific enrichment of Rad26 on UAS, illustrating a colocalization with Mediator (Fig. 1D). This is associated with a Spearman's correlation coefficient equal to 0.71.
Previously, Rad26 occupancy at selected Pol II–transcribed genes without exogenous genotoxic stress was shown to be transcription dependent (Malik et al. 2010). Rad26 was enriched on transcribed regions of GAL and INO1 genes under inducible conditions and RPS5 constitutively expressed genes (Malik et al. 2010). In addition, Rad26 association to the GAL1 gene upon galactose induction was reduced in the rpb1-1 Pol II mutant (Malik et al. 2010). Pol II occupancy was reduced in the rad26Δ mutant compared to the wild-type (WT) strain during GAL gene induction. However, no changes were observed for the steady-state level of Pol II occupancy upon full induction of GAL genes or on the RPS5 gene that is constitutively expressed (Malik et al. 2012). This suggests that Rad26 is required for an optimal induction of Pol II–transcribed genes. To further investigate Rad26 link to transcription, we examined whether any effect of the rad26 deletion on Mediator or Pol II occupancy could be identified under standard growth conditions. Our ChIP experiments did not show any difference between rad26Δ and WT strains in Mediator occupancy on selected UASs (Supplemental Fig. S5A). Pol II occupancy of selected class II genes in rad26Δ strain was similar to that of the WT (Supplemental Fig. S5B). No growth phenotypes of rad26Δ were observed in GGR-proficient and GGR-deficient (rad7Δ) contexts (Supplemental Fig. S5C), except UV sensitivity in the rad7Δ context, as expected for this TCR component (Supplemental Fig. S1A).
Taken together, our results show a strong correlation between Rad26 and Pol II on the yeast genome, which is consistent with a close relationship between Rad26 and Pol II transcription, without Rad26 having a major role in this process. Moreover, this analysis revealed an unexpected colocalization of Rad26 and Mediator on UASs within intergenic regions.
Genome-wide location analysis of Rad1–Rad10
Rad1–Rad10 endonuclease acts in NER as a dimer and together with Rad2 for the dual excision of damaged DNA. To determine whether these proteins are enriched on yeast chromatin in the absence of exogenous genotoxic stress and whether their occupancies are correlated, we performed Rad1 and Rad10 ChIP-seq experiments. No major difference in UV sensitivity was observed for the strains carrying N-terminal or C-terminal HA-tagged Rad1 or Rad10 (Supplemental Fig. S1B), suggesting that both HA-tagged versions were functional. Our ChIP experiments showed that N-terminally and C-terminally tagged Rad1 and Rad10 were enriched inside selected Pol II–transcribed genes, UASs, as well as Pol III–transcribed genes and telomeric regions (Supplemental Fig. S2B,C), spanning similar groups of genomic targets as Rad2 (Eyboulet et al. 2013). The C-terminal tagged versions were used for ChIP-seq experiments, because the ChIP signal-to-noise ratios were higher (1.3–twofold) compared to N-terminal tagged versions.
ChIP-seq analysis of Rad1 and Rad10 enrichment peaks revealed that they are distributed within Pol II–transcribed and intergenic regions, Pol III–transcribed genes, and telomeric and centromeric regions (Supplemental Fig. S3). A nonuniform background distribution was observed for tRNA genes and centromeric regions in the control data set from the nontagged strain. Our analysis on the genomic scale was therefore centered on Pol II–transcribed and promoter regions, after removal of the regions with the highest signals detected in the nontagged control, as described in Methods. Specific examples of ChIP-seq profiles illustrate Rad1 and Rad10 enrichment on Pol II–transcribed genes (Fig. 2A). We compared genome-wide occupancy of Rad1 with that of Rad10 on Pol II–transcribed genes and observed a linear relationship on transcribed and intergenic regions (R2 = 0.90 and 0.71, respectively) that is consistent with the action of these two proteins as a dimer (Fig. 2B,C). On transcribed regions, Rad10 occupancy showed a linear relationship with that of Pol II and Rad26 (R2 = 0.78 and 0.82, respectively) (Supplemental Fig. S4E–G). Analysis on Mediator enrichment peaks (UASs) also showed a strong correlation between Rad1 and Rad10 sets of data (Spearman's correlation coefficient equal to 0.78) and moderate correlation between Rad1/Rad10 and Mediator occupancies (Spearman's correlation coefficient equal to 0.57 and 0.60, respectively) (Fig. 2D). Heat maps of tag density for Rad1, Rad10, and Mediator (Med17 subunit) on Mediator enrichment peaks (UASs), as well as metagene analysis, showed Rad1 and Rad10 enrichment on these regions (Fig. 2E).
Genome-wide analysis of Rad1 and Rad10 occupancy. (A) Examples of Rad1, Rad10, and Mediator (Med17) tag density profiles in the WT context on Pol II–transcribed and intergenic regions. Nontagged (NT) control is also included. (B,C) Rad10 ChIP-seq density versus Rad1 ChIP-seq density on Pol II–transcribed regions (B) and intergenic regions (C). Each point on the plot corresponds to one transcribed or intergenic region. A linear regression (dotted line) and an R2 linear regression coefficient are indicated. The dashed line corresponds to y = x. (D) Pairwise Spearman's correlation coefficients (SCCs) of ChIP-seq data were calculated for Rad1, Rad10, and Mediator on Mediator (Med17) enrichment peaks (UASs). The colors correspond to the scale for SCCs indicated on the bottom. (E) Heat maps of Mediator (Med17), Rad1, and Rad10 ChIP-seq profiles centered on Mediator (Med17) enrichment peaks (−500 bp to +500 bp), sorted by decreasing Mediator occupancy. Median tag density profiles in RPM are shown in the upper panels. (F,G) Effect of the rpb1-1 Pol II mutation on Rad10 and Pol II occupancies at selected regions. Quantitative ChIP assays were performed using α-Rpb1 antibody (Pol II; F) and α-HA antibody against Rad10-HA (G). Cells were grown in selective SD medium complemented with amino acids at 25°C and then shifted for 90 min at 37°C. GAL1-O amplicon was used as a negative control. Quantities were normalized to qPCR performed on input DNA and are expressed as a percentage. The indicated value is the mean of three biological replicates, and error bars represent the standard deviation. (H,I) Effect of the rpc25-S100P Pol III mutation on Rad10 and Pol III occupancies at selected regions. Quantitative ChIP assays were performed using α-Myc antibody against Rpc160-13Myc Pol III subunit (H) and α-HA antibody against Rad10-HA (I). Cells were grown in selective SD medium complemented with amino acids at 25°C and then shifted for 10 h at 37°C. IGV amplicon (nontranscribed region on Chromosome V) was used as a negative control. Quantities were normalized to qPCR performed on input DNA and are expressed as a percentage. The indicated value is the mean of three biological replicates, and error bars represent the standard deviation.
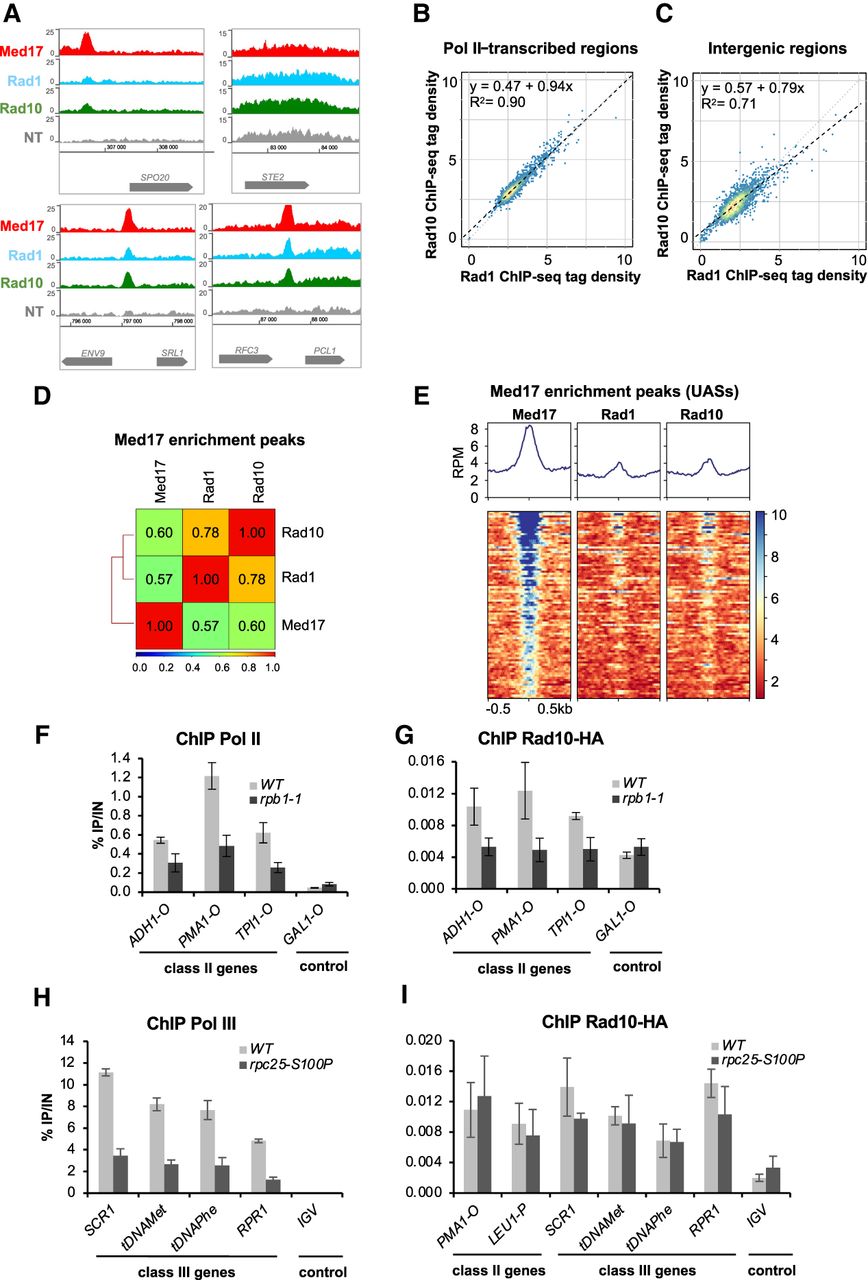
To address the question of transcriptional dependency of Rad1 and Rad10 chromatin occupancy on Pol II–transcribed genes, we used a Pol II mutant, rpb1-1, that stops Pol II transcription after a shift to nonpermissive temperature (Nonet et al. 1987). As expected, Pol II occupancy was reduced on Pol II–transcribed (class II) genes in the rpb1-1 mutant compared with the WT strain (Fig. 2F). Rad10 occupancy on Pol II–transcribed genes followed that of Pol II and was also reduced in this mutant (Fig. 2G), but no changes were detected for UAS and telomeric regions (Supplemental Fig. S6A). A decrease in Rad1 occupancy was also observed on selected Pol II–transcribed genes, even though the effect was less pronounced (Supplemental Fig. S6B,C). Thus, the presence of Rad1–Rad10 on Pol II–transcribed genes is dependent on Pol II transcription.
A Pol III–specific mutant, rpc25-S100P, was similarly used to impair Pol III transcription (Fig. 2H; Zaros and Thuriaux 2005). In contrast to Pol II–transcription dependency, no significant decrease was observed for Rad10 occupancy on Pol III–transcribed (class III) genes, suggesting that the presence of this protein on class III genes was independent of Pol III transcription (Fig. 2I).
We tested whether rad10 or rad1 deletion leads to any growth phenotypes that could suggest a potential transcriptional implication for Rad1–Rad10. No growth differences between rad10Δ or rad1Δ and WT strains were observed under different temperature conditions, on different carbon sources, or for NTP depletion conditions, except for a high UV sensitivity, as expected for key NER proteins (Supplemental Fig. S6D). We also examined whether, under standard growth conditions, rad10 or rad1 deletion can affect Pol II and Mediator occupancy. We did not observe any differences between Pol II occupancy of the rad1Δ or rad10Δ strains compared to the WT strain on selected genes (Supplemental Fig. S6E,G). Similarly, no effect of rad1 or rad10 deletion on Mediator occupancy on selected UASs was detected (Supplemental Fig. S6F,H). Our results suggest that Rad1–Rad10 do not play a major role in Pol II transcription.
Taken together, our results show a strong correlation between Rad1 and Rad10 on the yeast genome, consistent with their function as a dimer, and reveal their presence on the chromatin without exogenous genotoxic stress. Moreover, Rad1–Rad10 occupancy on Pol II–transcribed genes is transcription dependent, and they colocalize with Mediator on UASs within intergenic regions.
Mediator interacts with Rad1–Rad10 endonuclease and Rad26 TCR-specific protein
Previously, we identified a physical link between Rad2 NER protein and Mediator complex that contributes to their functional interplay (Eyboulet et al. 2013). Given the colocalization of Rad26 and Rad1–Rad10 proteins with Mediator on the yeast genome, we examined their potential physical interactions with Mediator by coimmunoprecipitation (Co-IP) experiments. Our results show that Mediator coimmunoprecipitates with Rad26, Rad1, and Rad10 in crude extracts of yeast strains expressing Med17-Myc and HA-Rad26, HA-Rad1, or Rad10-Flag (Fig. 3A–C). No Co-IP was seen between Mediator and two other NER proteins, the Rad4 protein specific to GGR and the Rad14 protein common for both NER pathways (Supplemental Fig. S7). We observed that Co-IP between Rad10 and Mediator remains unchanged in the rad2Δ context, suggesting that Rad2 does not mediate this physical interaction (Fig. 3D).
Rad1, Rad10, and Rad26 coimmunoprecipitate with Mediator, and the loss of Mediator head in the med17-138 mutant decreases Rad10 chromatin binding. (A–D) Co-IP between Rad1, Rad10, and Rad26 and Mediator. Inputs are shown in right panels. (A) Mediator was immunoprecipitated from crude yeast extracts via Med17-Myc subunit with α-Myc antibody (IP), and western blotting with α-HA antibody detected HA-Rad26 (Co-IP). (B–D) HA-Rad1 (B) or Rad10-Flag (C,D) was immunoprecipitated with α-HA or α-Flag antibody, respectively, and analyzed by western blotting with α-Myc antibody (B,C) against Med17-Myc subunit or rabbit polyclonal α-Med17 antibody (D) to detect the Med17 (Mediator) subunit (Co-IP) (left panels). WT (A–D) or rad2Δ (D) strains were used. IgG indicates a control immunoprecipitation with IgG magnetic beads only (A,B). A strain carrying nontagged Rad10 was used as a negative control in C and D. (E–H) Effect of the med17-138 mutation on Rad10, Rad26, and Pol II occupancies at selected regions. Quantitative ChIP assays were performed using α-Rpb1 antibody (Pol II) (F,H), and α-HA antibody against Rad10-HA (E) or HA-Rad26 (G). Cells were grown in selective SD medium complemented with amino acids at 25°C and then shifted for 45 min at 37°C. GAL1-O amplicon was used as a negative control. Quantities were normalized to qPCR performed on input DNA and are expressed as a percentage. The indicated value is the mean of three biological replicates, and error bars represent the standard deviation.
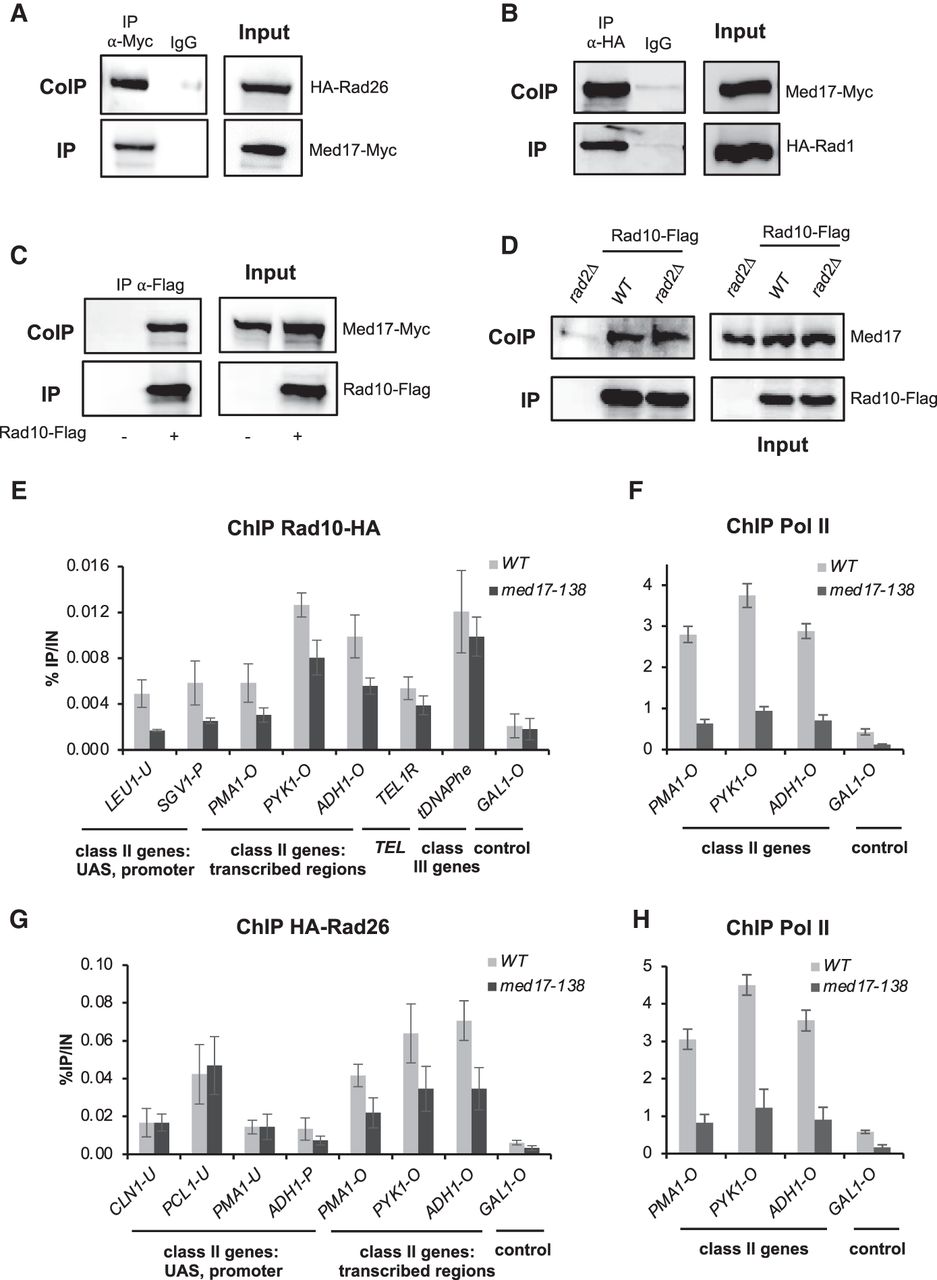
To investigate whether the Mediator function is required for Rad10 and Rad26 chromatin binding, we used the med17-138 mutant in which the Mediator head module dissociated from the rest of the complex at the nonpermissive temperature (Thompson and Young 1995; Holstege et al. 1998; Linder et al. 2006; Takagi and Kornberg 2006). Our ChIP experiments show that Rad10 occupancy was reduced on most of the tested promoters, UASs, and gene bodies of Pol II–transcribed genes in this Mediator mutant compared to the WT strain (Fig. 3E; Supplemental Fig. S8A). Conversely, Rad10 occupancy of telomeric and Pol III–transcribed regions did not change under the same conditions. As expected, Pol II occupancy was strongly reduced in med17-138 (Fig. 3F). We then examined how the med17-138 mutation influences Rad26 chromatin association (Fig. 3G; Supplemental Fig. S8B). Our results showed that, in this mutant, Rad26 occupancy on promoters and UASs of Pol II–transcribed genes remained similar to the WT strain. However, this Mediator mutation reduced Rad26 occupancy on Pol II–transcribed regions, together with a high decrease in Pol II occupancy, supporting a correlation between Rad26 and Pol II chromatin binding (Fig. 3G,H).
Taken together, our results showed that Rad1, Rad10, and Rad26 physically interact with the Mediator complex. Moreover, the loss of Mediator function led to a decrease in Rad10 occupancy on Pol II–associated promoter, regulatory, and transcribed regions, suggesting that Mediator influences the recruitment or stability of Rad10 on the chromatin. On the contrary, Rad26 occupancy on Pol II–associated promoter or regulatory regions was not affected by med17-138 mutation. The presence of Rad26 was decreased only within gene bodies of Pol II–transcribed genes, accompanying reduced transcription.
Mediator stabilization in kin28 mutant impacts Rad1, Rad10, and Rad26 chromatin binding
To investigate more precisely how changes in Mediator and Pol II chromatin binding influence Rad1–Rad10 and Rad26 distribution on the yeast genome, we used a mutant in the Kin28 TFIIH subunit, kin28-ts16 (Cismowski et al. 1995). In this mutant, shifting to nonpermissive temperature led to inhibition of Pol II CTD Ser5 phosphorylation. As a consequence of impaired Kin28 function, Mediator is stabilized on core promoters, and Pol II is decreased on transcribed regions (Jeronimo and Robert 2014; Wong et al. 2014; Jeronimo et al. 2016; Petrenko et al. 2016). Previously, we used kin28-ts mutants to show that Mediator stabilization on core promoters led to major changes in Rad2 occupancy with a shift from UASs to core promoters and a decrease on Pol II–transcribed regions (Georges et al. 2019). We showed the importance of dynamic interactions between Mediator, Rad2, and Pol II for Rad2 loading to the chromatin.
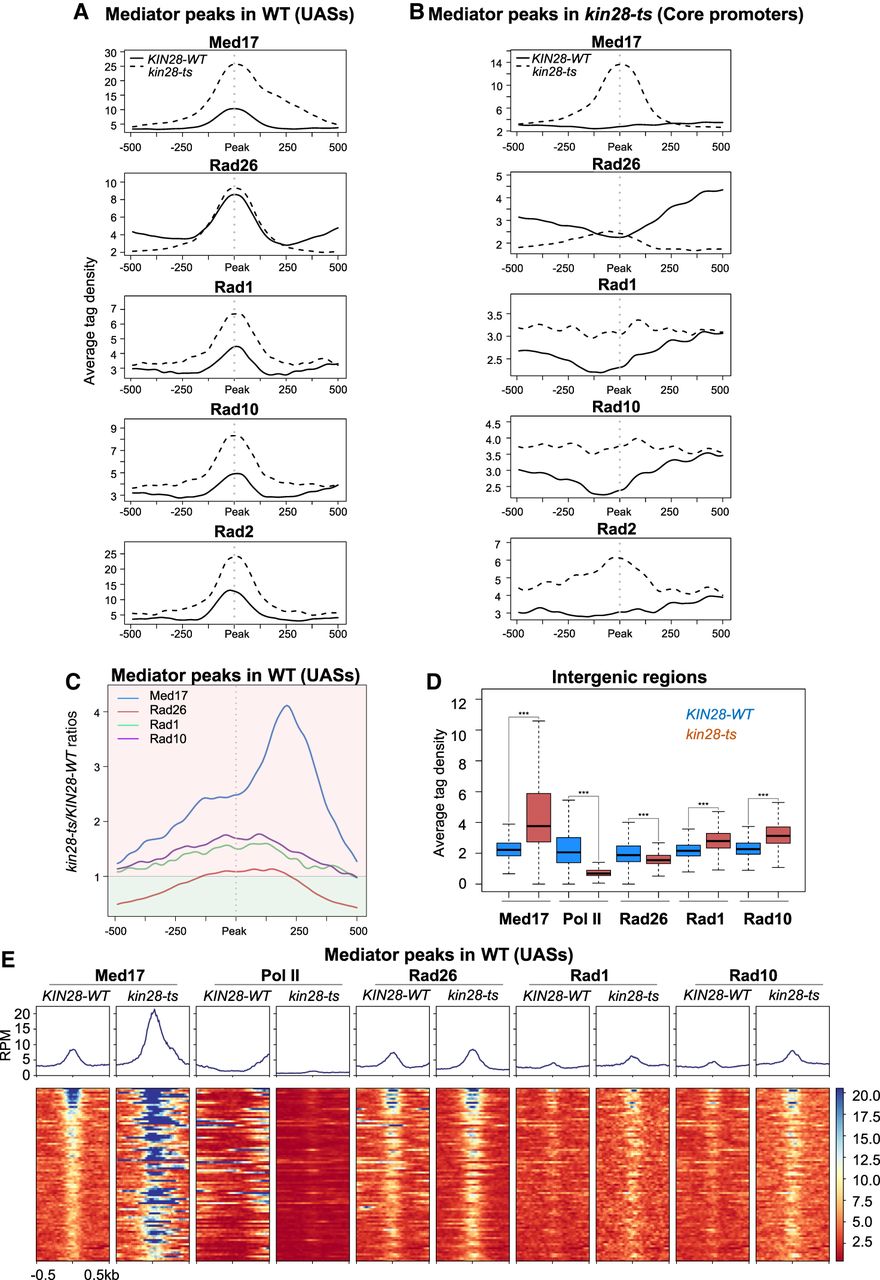
To determine the genome-wide distribution of Mediator, Pol II, Rad26, Rad1, and Rad10 in the kin28 mutant compared with the WT, we performed ChIP-seq experiments for the Med17 Myc-tagged Mediator subunit, Rpb1 Pol II subunit, HA-tagged Rad26, Rad1, and Rad10 after a shift for 75 min to 37°C. ChIP followed by qPCR was also performed on selected UASs, core promoters, and transcribed regions (Supplemental Fig. S9). In agreement with previous studies (Jeronimo and Robert 2014; Wong et al. 2014; Jeronimo et al. 2016; Petrenko et al. 2016; Georges et al. 2019), we observed Mediator stabilization on core promoters in the kin28 mutant. Metagene analysis and heat maps centered on Med17 peaks in the kin28-ts mutant (corresponding to core promoters) showed a large increase of Med17 occupancy in the kin28-ts mutant compared to the WT and, conversely, a strong decrease in Pol II occupancy (Supplemental Fig. S10). These changes were highly reproducible with those of our previous work (Supplemental Figs. S11, S12). We noted that Rad10 and Rad1 occupancies were increased at UASs in the kin28 mutant, following that of Mediator (Fig. 4A). Despite being also stabilized on core promoters, Rad1 and Rad10 occupancies did not present a sharp peak in the kin28 mutant, unlike that of Mediator (Fig. 4B; Supplemental Figs. S11, S12). The maximal Rad10 or Rad1 occupancy ratio between the mutant and the WT was equal to 1.8 or 1.6, respectively, on UASs (Fig. 4C) and 1.6 or 1.4 on core promoters (Supplemental Fig. S12B). Rad26 enrichment on Mediator peaks remained unchanged or slightly increased in the kin28 mutant compared to the WT. However, a large decrease of Rad26 occupancy was observed in the kin28 mutant on flanking regions correlated with a decrease in Pol II occupancy (Fig. 4A,B). For comparison, we also plotted the Rad2 occupancy data (Fig. 4A,B; Supplemental Fig. S11; Georges et al. 2019). An average tag density analysis at intergenic regions shows a significant increase for Mediator, Rad1, and Rad10 occupancy in the kin28 strain compared to the WT (Fig. 4D). Heat maps centered on Mediator peaks corresponding to UASs as defined in the WT context illustrate these changes in Rad26, Rad10, and Rad1 occupancies that accompany the Mediator stabilization in the kin28 mutant (Fig. 4E).
Effect of the kin28-ts mutation on genome-wide Mediator, Rad26, Rad1, and Rad10 occupancy at intergenic regions. (A) Average tag density in Med17 (Mediator), Rad26, Rad1, and Rad10 ChIP-seq (from upper to lower panels) around Med17 (Mediator) enrichment peaks (−500 bp to +500 bp) determined in WT (UASs). The Rad2 ChIP-seq data were from Georges et al. (2019). Average tag density in WT strains is indicated as a full line, whereas average tag density in the kin28-ts strains is indicated as a dashed line. (B) Average tag density in Med17 (Mediator), Rad26, Rad1, and Rad10 ChIP-seq (from upper to lower panels), around Med17 (Mediator) enrichment peaks (−500 bp to +500 bp) determined in kin28-ts (core promoters). Rad2 ChIP-seq data were used (Georges et al. 2019). Average tag density in WT strains is indicated as a full line, whereas average tag density in kin28-ts strains is indicated as a dashed line. (C) Mediator (in blue), Rad26 (in brown), Rad1 (in green), and Rad10 (in purple) occupancy ratios between the kin28-ts mutant and the WT around Med17 (Mediator) peaks (UAS, 1000-bp window). The maximum of the Rad1–Rad10 occupancy ratios is located at UAS, and the maximum for Mediator occupancy ratios is shifted to core promoters. Rad26 occupancy ratio is only slightly increased at UASs. For clarity, the background of the plot for ratios >1 is colored in clear red, and the background of the plot for ratios <1 is colored in clear green. (D) Boxplots showing changes in Med17 (Mediator), Pol II, Rad26, Rad1, and Rad10 ChIP-seq at intergenic regions (intergenic regions for Pol II–transcribed genes in tandem or in divergent orientation, excluding intergenic regions encompassing Pol III–transcribed genes, centromeres, telomeres) in the WT (in dark blue) and the kin28-ts strains (in brown). The asterisks represent a significant difference between the WT and the mutant at P-value < 2.2 × 10⁻¹⁶ in a Wilcoxon rank-sum test. (E) Heat maps of Mediator (Med17), Pol II, Rad26, Rad1, and Rad10 ChIP-seq profiles centered on Mediator (Med17) enrichment peaks determined in WT (UASs, −500 bp to +500 bp), sorted by decreasing Mediator occupancy. WT and kin28-ts strains were compared. Median tag density profiles in RPM are shown in upper panels.
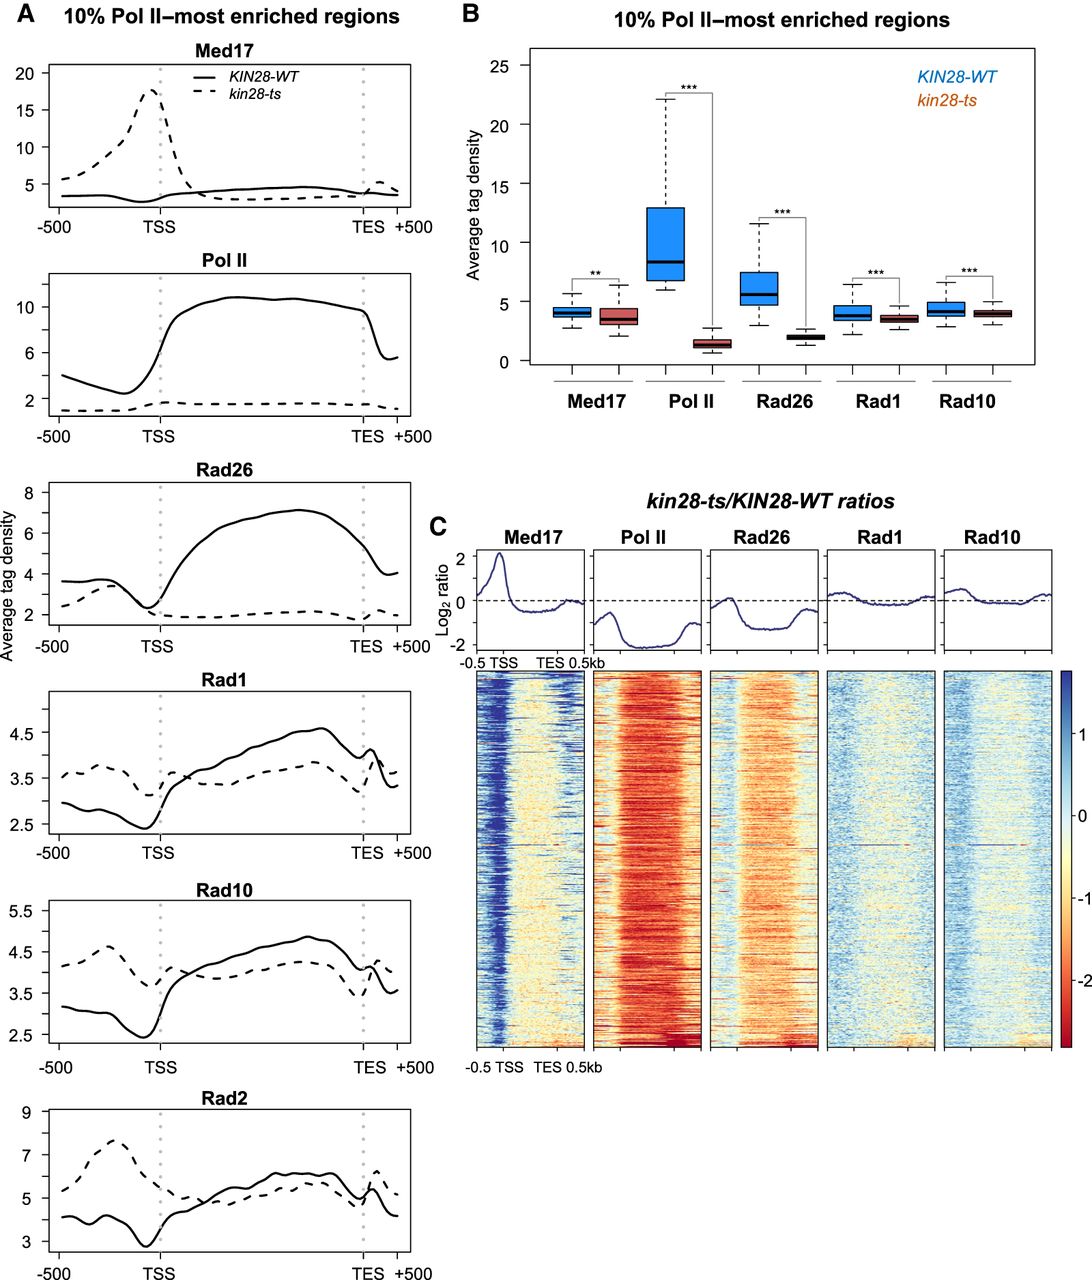
Rad26 occupancy was strongly reduced at transcribed regions, together with a strong decrease in Pol II occupancy in the kin28 mutant (Fig. 5A). Rad10 and Rad1 occupancies also followed the decrease in Pol II occupancy. Figure 5A illustrates how the kin28 mutation affects Rad26, Rad10, and Rad1 occupancies, at the top 10% of the most highly transcribed Pol II–associated regions. Average tag density analysis on the 10% Pol II–most enriched genes shows a large decrease in Pol II and Rad26 occupancies in the kin28 mutant, as well as a smaller but significant decrease in Rad1 and Rad10 (Fig. 5B). Metagene analysis and heat maps of ratios between the kin28 mutant and the WT illustrated these changes in occupancy of Rad26, Mediator, Pol II, Rad1, and Rad10 in comparison with Rad2 (Fig. 5C; Supplemental Fig. S13).
Effect of the kin28-ts mutation on genome-wide Mediator, Pol II, Rad26, Rad1, and Rad10 occupancy at transcribed regions. (A) Average tag density in Med17 (Mediator), Pol II, Rad26, Rad1, and Rad10 ChIP (from upper to lower panels) on the 10% Pol II–most enriched regions (scaled windows for 500 bp before TSS, between TSS and TES, and 500 bp after TES). For comparison, the Rad2 ChIP-seq data were from Georges et al. (2019). Average tag density in WT strains is indicated as a full line, whereas average tag density in the kin28-ts strains is indicated as a dashed line. (B) Boxplots showing changes in Med17 (Mediator), Pol II, Rad26, Rad1, and Rad10 ChIP-seq on the 10% Pol II–most enriched regions in WT (in dark blue) and the kin28-ts strains (in brown). The asterisks represent a significant difference between the WT and the mutant at P-value < 1 × 10⁻¹⁰ (**) or < 2.2 × 10⁻¹⁶ (***) in a Wilcoxon rank-sum test. (C) Heat maps of Mediator (Med17), Pol II, Rad26, Rad1, and Rad10 ChIP-seq occupancy ratios between the kin28-ts mutant and the WT on the 10% Pol II–most enriched regions (scaled windows for 500 bp before TSS, between TSS and TES, and 500 bp after TES), sorted by decreasing Mediator occupancy ratio. Average log2 ratios are shown in upper panels.
To investigate in detail the complex relationship between different NER proteins and transcriptional components that co-occupy intergenic regions, we took advantage of a multivariate method that allowed us to complete pairwise correlations and to analyze simultaneously the genome-wide data sets for Mediator, Pol II, Rad1, Rad10, and Rad26 in WT and kin28 mutant contexts (Supplemental Figs. S14–S16; Supplemental analysis). To reduce the number of parameters and to construct an orthonormal coordinate system for simultaneous comparison of several variables, we applied principal component analysis (PCA). We then calculated the covariance between variables by projecting one variable over the other in the orthonormal reference of the three PCs, and plotted the covariance between the variables for the WT and the kin28 mutant (Supplemental Fig. S16). Our analyses confirmed a high correlation between the Rad1 and Rad10 proteins, consistent with their function as a dimer. This analysis is in agreement with the stabilization of Mediator in the kin28 mutants that changes the relationships between Pol II, Rad1–Rad10, Rad26, and Mediator. Moreover, our multivariate approach shows that the stabilization of Mediator enhances the covariance between Rad26 and Mediator, as well as between Rad26 and Rad1–Rad10, suggesting coordinated changes in their genome-wide occupancy. When Mediator is stabilized on core promoter, Rad26 occupancy tends to evolve in the same way as Mediator and Rad1–Rad10.
Taken together, our results show that Rad1 and Rad10 chromatin binding in the kin28 mutant is increased at UASs when Mediator is stabilized on core promoters and is reduced on transcribed regions by a decrease in Pol II transcription. Rad26 occupancy in this mutant is mainly impacted by a large decrease in Pol II occupancy on gene bodies with no changes or a slight increase in Rad26 binding at UASs. By taking advantage of the orthonormal referential based on PCA, we underscored a strong covariance between Rad1 and Rad10, in accordance with their action as a dimer, and a strong correlation between their genome-wide occupancy. Moreover, this analysis improved our understanding of the Rad26 relationship with Mediator and Rad1–Rad10 by revealing the increase in the covariance between Rad26 and Mediator or Rad1–Rad10 that accompanies Mediator stabilization at core promoters.
Discussion
In this study, we performed genome-wide location analysis of Rad1/ERCC4, Rad10/ERCC1, and Rad26/CSB NER proteins in the yeast Saccharomyces cerevisiae, addressing the questions on their chromatin binding in the absence of exogenous genotoxins and their potential relationships with Mediator and Pol II. Our results showed that Rad26 and Rad1–Rad10 associate with chromatin in the absence of exogenous genotoxic stress, indicating that the chromatin binding of these proteins is not restricted to DNA damage-inducing conditions. However, despite similarities in genomic localization, we showed that their functional link with Pol II and Mediator differs substantially, suggesting different modes of recruitment and/or function.
With NER being coupled with transcription, we investigated the relationship between Rad1–Rad10 or Rad26 and Pol II. Consistent with previous studies, Rad26 is the most closely related to Pol II transcription. All the proteins show positive correlation with Pol II, with Rad26 being very highly correlated and their presence on Pol II–transcribed genes is transcription dependent. However, our results with rad1, rad10, or rad26 deletion mutants suggest that Pol II transcription does not absolutely require these proteins. Thus, the loading of Rad1, Rad10, and Rad26 proteins on chromatin could physically depend on Pol II and/or could be required to resolve potential genomic instability associated with Pol II transcriptional activity. It should also be noted that Rad26/CSB has a DNA-dependent ATPase activity that can be important for chromatin remodeling and regulation of chromatin structure (Selby and Sancar 1997b; Newman et al. 2006; Lake et al. 2014). This activity can help Pol II to pass through nucleosomes (Xu et al. 2020) and lead to a Rad26 requirement for TCR downstream from the +1 nucleosome (Duan et al. 2020).
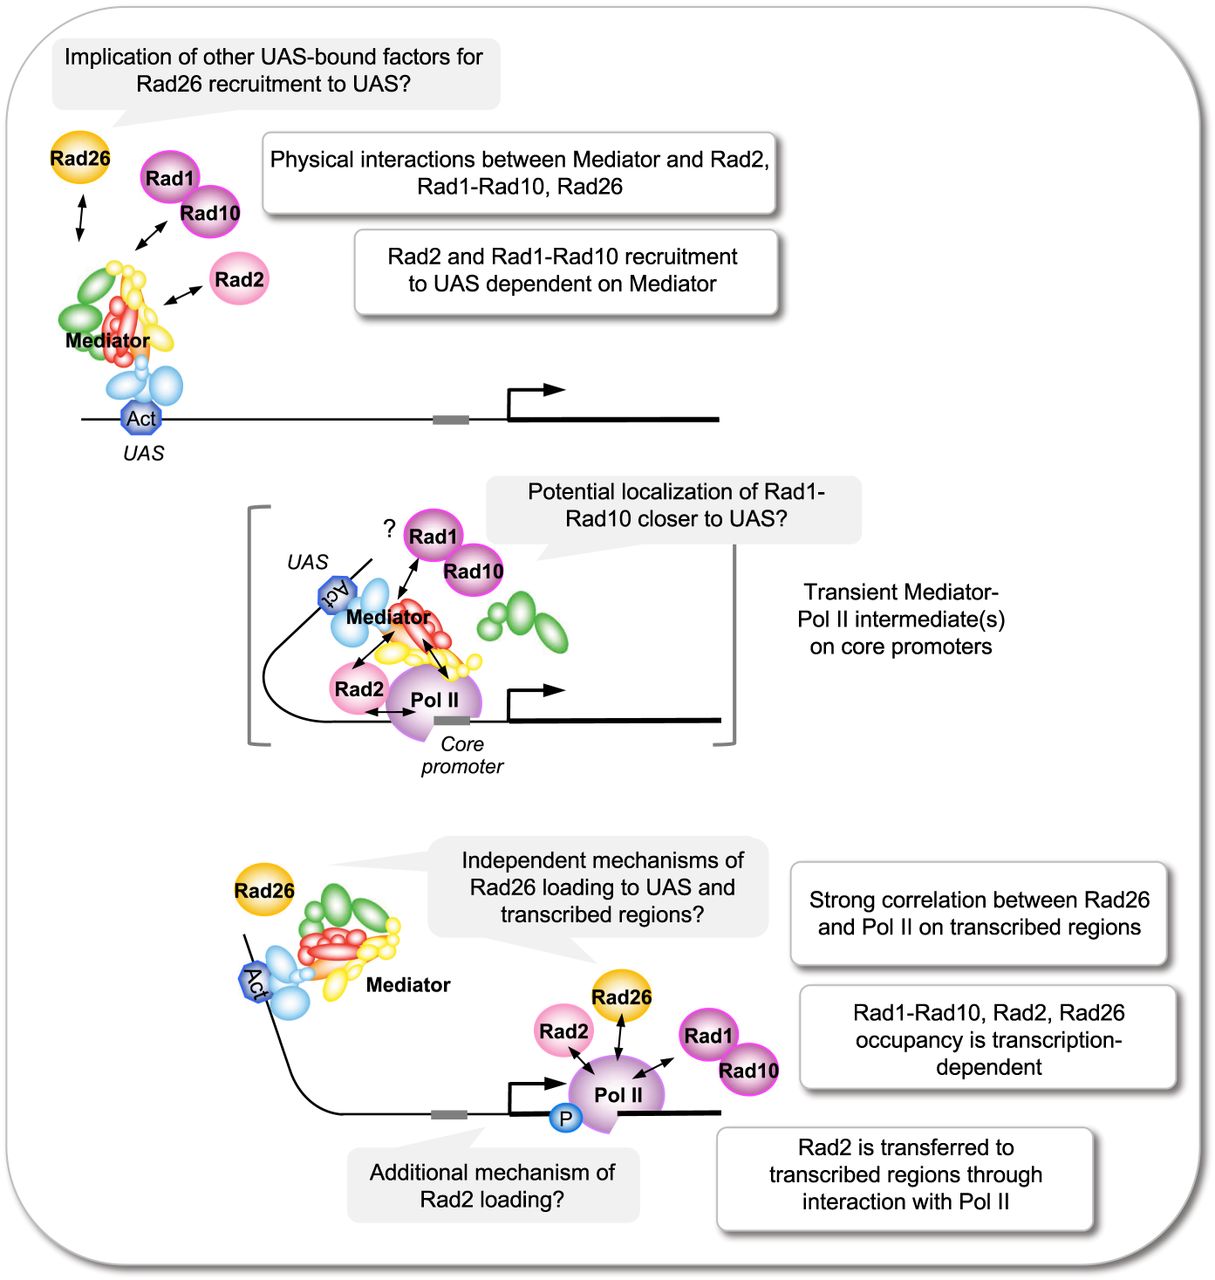
We previously discovered the link between Rad2 and Mediator, showing that Rad2 chromatin binding depends on Pol II transcription and involves dynamic interactions with Mediator and Pol II (Eyboulet et al. 2013; Georges et al. 2019). In this work, we showed that the Mediator link to NER proteins is not restricted to Rad2 but also includes Rad1–Rad10 and Rad26. Figure 6 proposes how our findings on Rad26 and Rad1–Rad10 can be integrated into a schematic representation of the link between Rad2, Mediator, and Pol II (André et al. 2021). Our data show that physical interactions between Rad1, Rad10, or Rad26 and Mediator, as well as their genome-wide co-occupancy of Mediator-enriched regulatory regions, were similar to previous results for Rad2 (Eyboulet et al. 2013). However, considerable differences were observed between Rad2, Rad1–Rad10, and Rad26 with respect to changes in Mediator function and chromatin binding. In particular, the loss of Mediator function induced by the dissociation of the Mediator head in the med17-138 mutant led to a significant decrease in Rad10 occupancy on regulatory and promoter regions, whereas no changes could be observed for Rad26 on these regions. This result suggests that Mediator, and in particular the Mediator head module, is required for recruitment or stability on the UAS of Rad10 but not Rad26. We could not exclude the possibility that other Mediator modules influence Rad26 recruitment.
Schematic summary for Rad1–Rad10 and Rad26 in the interplay between Mediator, Rad2, and Pol II. Schematic representation suggests how Rad1–Rad10 and Rad26 findings can be integrated into functional interplay between Mediator, Pol II, and Rad2 that we recently proposed (André et al. 2021). The figure allows us to compare Rad1–Rad10 and Rad26 with Rad2. Our data show similarities between Rad2 and other Rad proteins (Rad26, Rad1–Rad10) in their genomic distribution and physical interactions. They also reveal important differences in their dynamics with respect to Mediator. Activator (Act) is indicated in blue, Rad2 in pink, Pol II in purple, Rad26 in orange, and Rad1–Rad10 dimer in magenta. Mediator subunits are colored according to the modules: in light blue, red, yellow, and green for Mediator tail, head, middle, and Cdk8 kinase modules, respectively. Double-headed arrows indicate interactions between different proteins. (Top) Rad2, Rad1–Rad10, and Rad26 physically interact with Mediator. Moreover, Rad2 and Rad1–Rad10 recruitment to UAS is dependent on Mediator. (Middle) Rad2 was proposed to be transferred to transcribed regions through interactions with Pol II, and a transient Mediator–Pol II intermediate(s) (in brackets), formed at core promoters. A transfer of Rad1–Rad10 between UAS and transcribed regions can be also proposed. (Bottom) A strong correlation was observed between Rad26 and Pol II on transcribed regions. Rad1–Rad10 occupancy was also correlated with Pol II. Chromatin binding of all proteins (Rad1–Rad10, Rad2, and Rad26) was Pol II transcription dependent. Our results suggest that the recruitment mechanisms of Rad26 on UAS and transcribed regions could be independent.
Moreover, when Mediator was stabilized on core promoters in the kin28 TFIIH mutant, Rad1 and Rad10 occupancy increased on regulatory regions, whereas Rad26 occupancy of these regions remained similar to the WT or only slightly increased (Fig. 4B). In both Mediator and TFIIH mutants, Rad1–Rad10 were more impacted by changes in Mediator function or binding than Rad26. This can suggest independent mechanisms of Rad26 recruitment to regulatory and transcribed regions and potential implication of other proteins enriched at UASs (Fig. 6, top and bottom). Our data in the kin28 mutant suggest a possibility of Rad1–Rad10 transfer between UAS and transcribed regions, as previously proposed for Rad2 through transient Mediator–Pol II intermediates at core promoters (Fig. 6, middle; Georges et al. 2019; André et al. 2021). Rad1–Rad10 occupancy did not follow exactly that of Rad2 or Mediator in the kin28 context, because Rad1–Rad10 occupancy is increased mainly at UAS. This fact could be explained by the differences in the position of Rad proteins with respect to UAS or core promoters in transient intermediates formed at core promoters. Similar to the Pol II relationship, deletion of either of the rad1, rad10, or rad26 genes led to unchanged chromatin binding of Mediator. Among NER factors, the Rad2 genomic binding shows the highest correlation with Mediator on regulatory regions (Eyboulet et al. 2013), as well as the highest increase in occupancy accompanying Mediator stabilization on core promoters in the kin28 mutant (Georges et al. 2019). Our results show that Rad1 and Rad10 association with UASs is also increased by Mediator stabilization, although to a lesser extent, whereas Rad26 is the least impacted. As discussed above, Rad26 and Rad1–Rad10, similar to Rad2, are correlated with Pol II on transcribed regions, and their occupancy is Pol II transcription dependent (Fig. 6, bottom). Our analysis of ChIP-seq data improved our understanding of the relationship between Rad26, Rad1–Rad10, Pol II, and Mediator. Despite the fact that we observe no changes or a slight increase in Rad26 occupancy on core promoters using standard ChIP-seq analysis, the multivariate approach reveals an increase in covariance between Rad26 and Mediator or Rad1–Rad10 in kin28 mutant. Our work thus provides directions for further studies on the physical and functional interactions of these proteins.
We showed that in addition to Pol II–transcribed genes and intergenic regions, Rad1, Rad10, and Rad26 are also enriched at Pol III–transcribed genes, telomeres, and centromeres, suggesting interesting perspectives for possible functions of these proteins. Rad2 was also present on Pol III–transcribed genes, telomeres, and centromeres (Eyboulet et al. 2013). Unlike Pol II transcription dependency, the presence of Rad10 on Pol III–transcribed genes was unchanged in a Pol III mutant. This suggests a Pol III–independent Rad10 recruitment and a potential involvement of other Pol III transcription components such as TFIIIB or TFIIIC. A complex distribution of Rad1–Rad10, Rad2, and Rad26 proteins and their colocalization at a number of genomic features could be related to their different functions in DNA repair pathways, telomere maintenance, or R-loop-induced genome instability that remain to be fully uncovered. In particular, the enrichment of Rad2, Rad1–Rad10, and Rad26 on regions predisposed to form R-loops raises a possibility that the recruitment of these proteins is linked to RNA–DNA hybrid formation or resolution (Sollier et al. 2014). We noted that the Rad26 and Rad1–Rad10 enrichment profiles on Pol II–transcribed genes with a higher signal at the 3′-end (Fig. 5A) resemble those observed for R-loops, in comparison with a more equal distribution of Pol II along the genes (Wahba et al. 2016). For intron-containing genes, this R-loop profile was proposed to be related to a higher enrichment of second exons (El Hage et al. 2014).
In conclusion, our genome-wide location analysis reveals that Rad1–Rad10 and Rad26 NER proteins are present on the yeast chromatin in the absence of exogenous genotoxic stress, raising important questions and providing interesting perspectives for future research. Our results suggest that the Mediator link to NER is not restricted to the Rad2 protein and can be more complex, providing new information on functional dynamics between Rad1–Rad10, Rad26, Pol II, and Mediator at the genome-wide scale. Future experiments will help to understand how this interplay works in the presence of DNA damage.
Methods
Strains
All S. cerevisiae strains used in this study can be found in Supplemental Table S1.
Spotting assay
Yeast cells were grown on plates for 3 d at 30°C. Cells were then scraped and diluted in water at 1 OD600. The yeast suspension was serially diluted by 10-fold, and 3 μL was spotted on different media (YP medium supplemented with glucose, galactose, ethanol, or glycerol) or UV-irradiated at 5 or 20 J/m2 (UV Stratalinker 1800) and incubated for 3 d or 5 d with mycophenolic acid (25 or 50 μg/mL). Cells were grown at 30°C or at the indicated temperature.
Co-IP experiments
Co-IP experiments were conducted as previously described (Georges et al. 2019). Briefly, 100 mL of cells exponentially grown at 30°C was collected by centrifugation and used for protein extract preparation. Anti-HA (12CA5, Abcam Ab1424), anti-Myc (9E10, Abcam Ab32), or anti-Flag (M2, Sigma-Aldrich F3165) antibodies were used to immunoprecipitate tagged proteins from crude extracts.
ChIP experiments
ChIP experiments were performed in triplicate. One hundred milliliters of three independent cultures were grown as indicated below, depending on the strain used.
rad2, rad26, rad1, and rad10 deletion mutants and the corresponding WTs were grown at 30°C.
In RPB1 WT and rpb1-1 mutant contexts, cells were grown at 25°C to midexponential phase and then shifted for 90 min to 37°C.
In RPC25 WT and rpc25-S100P mutant contexts, cells were grown at 25°C to midexponential phase and then shifted for 10 h to 37°C.
In MED17 and med17-138 mutant contexts, cells were grown at 25°C to midexponential phase and then shifted for 45 min to 37°C.
In KIN28 WT and kin28 mutant contexts, cells were grown at 25°C to midexponential phase and then shifted for 75 min to 37°C.
ChIP experiments were performed as follows, except for kin28-ts and the corresponding WT samples, which were performed on an IP-Star compact automated system (Diagenode) as previously described (Georges et al. 2019). Cells exponentially growing (0.6 OD600) in 100 mL of YPD were treated with formaldehyde at a final concentration of 1% for 10 min for DNA–protein cross-linking. The reaction was stopped by adding glycine to a final concentration of 500 mM and incubating for 5 min. Cells were washed twice with cold 20 mM Tris-HCl (pH 8). Cells were then lysed by bead-beating for 30 min at 4°C in a FA/SDS buffer (50 mM HEPES KOH at pH 7.5, 150 mM NaCl, 1 mM EDTA, 1% Triton X-100, 0.1% sodium deoxycholate, 0.1% SDS) containing PMSF (FA/SDS + PMSF). Chromatin was sheared using a S220 focused-ultrasonicator (Covaris) for 10 min at 150 W and duty factor 10 to obtain DNA fragments of ∼200 bp.
Fifty microliters of Dynabeads pan mouse IgG was washed twice with cold PBS and then incubated with anti-HA (12CA5, 70 ng/μL), anti-Myc (9E10, 30 ng/μL), or anti-Rpb1-CTD (8WG16, 100 ng/μL; Covance cat # MMS-126R) in cold PBS-0.1% BSA for 1 h at 4°C. The antibody-coated beads were washed twice with cold PBS-0.1% BSA for 10 min and one quick wash with FA/SDS buffer. Sonicated chromatin (about one-fourth of the total) and antibody-coated beads were incubated for 2 h at 21°C under agitation. Beads were washed three times with FA/SDS + 500 mM NaCl. The beads were then washed with IP buffer (10 mM Tris-HCl at pH 8, 0.25 M LiCl, 1 mM EDTA, 0.5% NP-40, 0.5% sodium deoxycholate), followed by one wash in TE buffer (10 mM Tris-HCl at pH 8, 1 mM EDTA). Elution was performed for 20 min at 65°C, under agitation in a pronase buffer. Pronase, at a final concentration of 1 mg/mL, was added to the eluate and incubated for 30 min at 37°C. For the input, sample was also treated with pronase. Cross-links were reversed by overnight incubation at 65°C. RNase A at a final concentration of 0.025 mg/mL was added to immunoprecipitated DNA (IP) and input DNA (IN) and incubated for 1 h at 37°C. DNA was purified using a Qiagen kit for PCR purification, according to manufacturer's protocol.
Three independent biological replicates were used for quantitative analysis. qPCR experiments were performed using qPCR MasterMix SYBR Green (Takyon) and primers listed in Supplemental Table S2.
For ChIP-seq, KIN28 WT and kin28-ts mutant were grown at 25°C to midexponential phase and then shifted for 75 min to 37°C. Three independent biological replicates were combined, and library preparation for sequencing was made as previously described (Georges et al. 2019).
Data analysis
ChIP-seq data were analyzed using the following procedure. Reads were first trimmed with cutadapt (v1.12) (Martin 2011) then mapped on the S. cerevisiae genome (University of California at Santa Cruz [UCSC] version sacCer3) using Bowtie 2 (v2.3.4.3) (Langmead and Salzberg 2012). Files were converted using SAMtools (v0.1.18) (Li et al. 2009) and deepTools (v3.3.0) (Ramírez et al. 2016); only unique reads were kept. Read counts were first normalized in RPM and then by qPCR data on a set of selected regions, using the ratio between WT and mutant strains as previously described (Eyboulet et al. 2015). The number of mapped reads for each ChIP-seq experiment and normalization coefficients is indicated in Supplemental Table S3.
The transcribed (mRNA) regions were determined using the transcription start sites (TSSs) and transcription end sites (TESs) of mRNA genes taken from Pelechano et al. (2013) and Malabat et al. (2015) (n = 5337). ARS (n = 196), centromeres (n = 16), telomeres (n = 32), snRNAs (n = 6), snoRNAs (n = 77), tRNAs (n = 299), rDNA (n = 27), LTRs (n = 383), and retrotransposons (n = 50) coordinates were taken from the YeastMine database (Balakrishnan et al. 2012). Intergenic regions were defined as nontranscribed regions not overlapping any of the previously listed genome features or their direct flanking sequences, resulting in 3929 regions.
Peaks were detected with MACS2 (v2.1.3) (Zhang et al. 2008), using the input data set and ChIP-seq data set from the nontagged strain (Georges et al. 2019) as controls. The nontagged control data set is available at ArrayExpress (https://www.ebi.ac.uk/arrayexpress/) under accession number E-MTAB-7081. Only peaks passing the quality filter were kept (fold_change ≥ 1.5× and P-value < 1 × 10⁻¹⁰). Genome distribution of the peaks was determined based on their summit coordinates. For the heat maps, peaks were oriented according to the closest TSS (maximum 1 kb away), and only peaks located in the intergenic regions were used.
To correct for nonuniform background distribution and to take into account an apparent enrichment of some regions, in particular some highly expressed genes seen in ChIP-seq data set with nontagged strain, 2.5% of transcribed regions and 2.5% of intergenic regions showing the highest signals in nontagged control were excluded from the analysis. We also removed the 10% of detected Mediator peaks with the highest nontagged signal, leading to the final number of 85 in the WT and 1136 in the kin28-ts mutant.
Heat maps and correlation matrices were generated by deepTools. R (v3.5.1) (R Core Team 2018) was used to generate profiles, boxplots, and dotplots (ggplot2) (Wickham 2009). The asterisks in boxplots represent a significant difference between the WT and the mutant at P-value < 0.05 (*), <1 × 10⁻¹⁰ (**), or <2.2 × 10⁻¹⁶ (***) in a Wilcoxon rank-sum test (Bauer 1972).
PCA was performed as follows. The number of PCs used in PCA was determined by Pareto chart of a distribution of sample variance as a function of PCs that allows the visualization of the percentage of explained total variance by PCs (Wilkinson 2006). To evaluate how different variables participate in the construction of PCs, the norm of each variable in the orthonormal referential defined by {PC1, PC2, PC3} was calculated as . The larger the norm value, the more the variable contributes to the variability observed in a data set. The contribution of each variable to three PCs was expressed in the normal referential {Med17, Pol II, Rad1, Rad10, Rad26}. To verify how variables covariate in the data set, one variable was projected over the other in the orthonormal referential {PC1, PC2, PC3} as . The covariance of the variables was calculated by normalizing the obtained product by the vector norms. The covariance between variables was plotted using an ellipsoid representation with the width of the ellipsoid (small radius) corresponding to the dispersion between the two variables.
Data access
The ChIP-seq data generated in this study have been submitted to ArrayExpress (https://www.ebi.ac.uk/arrayexpress/) under accession number E-MTAB-10828.
Competing interest statement
The authors declare no competing interests.
Acknowledgments
We thank the high-throughput sequencing facility of I2BC for its sequencing and bioinformatics expertise, the SPI (CEA/Saclay) for monoclonal antibodies, M. Werner and S. Marcand for fruitful discussions, and C. Mann for critical reading of the manuscript. This work was supported by Agence Nationale de la Recherche (ANR-14-CE10–0012-01), Fondation ARC (PGA1 RF20170205342), and Comité Ile-de-France–La Ligue Nationale Contre le Cancer. D.G. was supported by a PhD training contract from the French Alternative Energies and Atomic Energy Commission (CEA) and La Ligue Nationale Contre le Cancer.
Author contributions: J.S. and D.G. designed the experiments. D.G., N.G.A., and M.-B.B. performed the experiments. C.D.W. performed data curation and reshaping. C.D.W., A.G., E.N., and D.G. performed data analysis. Supervision and project coordination were performed by J.S. J.S. wrote the original draft with the participation of D.G., C.D.W., and A.G. Review and editing were performed by J.S., C.D.W., A.G., and D.G.
Notes
[1] Supplementary material [Supplemental material is available for this article.]
[2] Article published online before print. Article, supplemental material, and publication date are at https://www.genome.org/cgi/doi/10.1101/gr.276371.121.
References
- ↵André KM, Sipos EH, Soutourina J. 2021. Mediator roles going beyond transcription. Trends Genet 37: 224–234. 10.1016/j.tig.2020.08.015
- ↵Bailly V, Sommers CH, Sung P, Prakash L, Prakash S. 1992. Specific complex formation between proteins encoded by the yeast DNA repair and recombination genes RAD1 and RAD10. Proc Natl Acad Sci 89: 8273–8277. 10.1073/pnas.89.17.8273
- ↵Balakrishnan R, Park J, Karra K, Hitz BC, Binkley G, Hong EL, Sullivan J, Micklem G, Cherry JM. 2012. YeastMine—an integrated data warehouse for Saccharomyces cerevisiae data as a multipurpose tool-kit. Database 2012: bar062. 10.1093/database/bar062
- ↵Bauer D. 1972. Constructing confidence sets using rank statistics. J Am Stat Assoc 67: 687–690. 10.1080/01621459.1972.10481279
- ↵Boetefuer EL, Lake RJ, Fan HY. 2018. Mechanistic insights into the regulation of transcription and transcription-coupled DNA repair by Cockayne syndrome protein B. Nucleic Acids Res 46: 7471–7479. 10.1093/nar/gky660
- ↵Bukowska B, Karwowski BT. 2018. Actual state of knowledge in the field of diseases related with defective nucleotide excision repair. Life Sci 195: 6–18. 10.1016/j.lfs.2017.12.035
- ↵Cismowski MJ, Laff GM, Solomon MJ, Reed SI. 1995. KIN28 encodes a C-terminal domain kinase that controls mRNA transcription in Saccharomyces cerevisiae but lacks cyclin-dependent kinase-activating kinase (CAK) activity. Mol Cell Biol 15: 2983–2992. 10.1128/MCB.15.6.2983
- ↵Cleaver JE, Lam ET, Revet I. 2009. Disorders of nucleotide excision repair: the genetic and molecular basis of heterogeneity. Nat Rev Genet 10: 756–768. 10.1038/nrg2663
- ↵Duan M, Selvam K, Wyrick JJ, Mao P. 2020. Genome-wide role of Rad26 in promoting transcription-coupled nucleotide excision repair in yeast chromatin. Proc Natl Acad Sci 117: 18608–18616. 10.1073/pnas.2003868117
- ↵El Hage A, Webb S, Kerr A, Tollervey D. 2014. Genome-wide distribution of RNA-DNA hybrids identifies RNase H targets in tRNA genes, retrotransposons and mitochondria. PLoS Genet 10: e1004716. 10.1371/journal.pgen.1004716
- ↵Epanchintsev A, Costanzo F, Rauschendorf MA, Caputo M, Ye T, Donnio LM, Proietti-de-Santis L, Coin F, Laugel V, Egly JM. 2017. Cockayne's Syndrome A and B proteins regulate transcription arrest after genotoxic stress by promoting ATF3 degradation. Mol Cell 68: 1054–1066.e6. 10.1016/j.molcel.2017.11.009
- ↵Eyboulet F, Cibot C, Eychenne T, Neil H, Alibert O, Werner M, Soutourina J. 2013. Mediator links transcription and DNA repair by facilitating Rad2/XPG recruitment. Genes Dev 27: 2549–2562. 10.1101/gad.225813.113
- ↵Eyboulet F, Wydau-Dematteis S, Eychenne T, Alibert O, Neil H, Boschiero C, Nevers MC, Volland H, Cornu D, Redeker V, 2015. Mediator independently orchestrates multiple steps of preinitiation complex assembly in vivo. Nucleic Acids Res 43: 9214–9231. 10.1093/nar/gkv782
- ↵Faridounnia M, Folkers GE, Boelens R. 2018. Function and interactions of ERCC1-XPF in DNA damage response. Molecules 23: 3205. 10.3390/molecules23123205
- ↵Fousteri M, Mullenders LH. 2008. Transcription-coupled nucleotide excision repair in mammalian cells: molecular mechanisms and biological effects. Cell Res 18: 73–84. 10.1038/cr.2008.6
- ↵Georges A, Gopaul D, Denby Wilkes C, Giordanengo Aiach N, Novikova E, Barrault MB, Alibert O, Soutourina J. 2019. Functional interplay between Mediator and RNA polymerase II in Rad2/XPG loading to the chromatin. Nucleic Acids Res 47: 8988–9004. 10.1093/nar/gkz598
- ↵Hanawalt PC, Spivak G. 2008. Transcription-coupled DNA repair: two decades of progress and surprises. Nat Rev Mol Cell Biol 9: 958–970. 10.1038/nrm2549
- ↵Holstege FC, Jennings EG, Wyrick JJ, Lee TI, Hengartner CJ, Green MR, Golub TR, Lander ES, Young RA. 1998. Dissecting the regulatory circuitry of a eukaryotic genome. Cell 95: 717–728. 10.1016/S0092-8674(00)81641-4
- ↵Jeronimo C, Robert F. 2014. Kin28 regulates the transient association of Mediator with core promoters. Nat Struct Mol Biol 21: 449–455. 10.1038/nsmb.2810
- ↵Jeronimo C, Langelier MF, Bataille AR, Pascal JM, Pugh BF, Robert F. 2016. Tail and kinase modules differently regulate core mediator recruitment and function in vivo. Mol Cell 64: 455–466. 10.1016/j.molcel.2016.09.002
- ↵Kamileri I, Karakasilioti I, Sideri A, Kosteas T, Tatarakis A, Talianidis I, Garinis GA. 2012. Defective transcription initiation causes postnatal growth failure in a mouse model of nucleotide excision repair (NER) progeria. Proc Natl Acad Sci 109: 2995–3000. 10.1073/pnas.1114941109
- ↵Kikuchi Y, Umemura H, Nishitani S, Iida S, Fukasawa R, Hayashi H, Hirose Y, Tanaka A, Sugasawa K, Ohkuma Y. 2015. Human mediator MED17 subunit plays essential roles in gene regulation by associating with the transcription and DNA repair machineries. Genes Cells 20: 191–202. 10.1111/gtc.12210
- ↵Kokic G, Wagner FR, Chernev A, Urlaub H, Cramer P. 2021. Structural basis of human transcription–DNA repair coupling. Nature 598: 368–372. 10.1038/s41586-021-03906-4
- ↵Kornberg RD. 2005. Mediator and the mechanism of transcriptional activation. Trends Biochem Sci 30: 235–239. 10.1016/j.tibs.2005.03.011
- ↵Lake RJ, Boetefuer EL, Tsai PF, Jeong J, Choi I, Won KJ, Fan HY. 2014. The sequence-specific transcription factor c-Jun targets Cockayne syndrome protein B to regulate transcription and chromatin structure. PLoS Genet 10: e1004284. 10.1371/journal.pgen.1004284
- ↵Langmead B, Salzberg SL. 2012. Fast gapped-read alignment with Bowtie 2. Nat Methods 9: 357–359. 10.1038/nmeth.1923
- ↵Le May N, Mota-Fernandes D, Vélez-Cruz R, Iltis I, Biard D, Egly JM. 2010. NER factors are recruited to active promoters and facilitate chromatin modification for transcription in the absence of exogenous genotoxic attack. Mol Cell 38: 54–66. 10.1016/j.molcel.2010.03.004
- ↵Le May N, Fradin D, Iltis I, Bougnères P, Egly JM. 2012. XPG and XPF endonucleases trigger chromatin looping and DNA demethylation for accurate expression of activated genes. Mol Cell 47: 622–632. 10.1016/j.molcel.2012.05.050
- ↵Li H, Handsaker B, Wysoker A, Fennell T, Ruan J, Homer N, Marth G, Abecasis G, Durbin R, 1000 Genome Project Data Processing Subgroup. 2009. The Sequence Alignment/Map format and SAMtools. Bioinformatics 25: 2078–2079. 10.1093/bioinformatics/btp352
- ↵Linder T, Zhu X, Baraznenok V, Gustafsson CM. 2006. The classical srb4-138 mutant allele causes dissociation of yeast Mediator. Biochem Biophys Res Commun 349: 948–953. 10.1016/j.bbrc.2006.08.099
- ↵Malabat C, Feuerbach F, Ma L, Saveanu C, Jacquier A. 2015. Quality control of transcription start site selection by nonsense-mediated-mRNA decay. eLife 4: e06722. 10.7554/eLife.06722
- ↵Malik S, Chaurasia P, Lahudkar S, Durairaj G, Shukla A, Bhaumik SR. 2010. Rad26p, a transcription-coupled repair factor, is recruited to the site of DNA lesion in an elongating RNA polymerase II-dependent manner in vivo. Nucleic Acids Res 38: 1461–1477. 10.1093/nar/gkp1147
- ↵Malik S, Chaurasia P, Lahudkar S, Uprety B, Bhaumik SR. 2012. Rad26p regulates the occupancy of histone H2A-H2B dimer at the active genes in vivo. Nucleic Acids Res 40: 3348–3363. 10.1093/nar/gkr1244
- ↵Martin M. 2011. Cutadapt removes adapter sequences from high-throughput sequencing reads. EMBnet J 17: 10–12. 10.14806/ej.17.1.200
- ↵McNeil EM, Melton DW. 2012. DNA repair endonuclease ERCC1–XPF as a novel therapeutic target to overcome chemoresistance in cancer therapy. Nucleic Acids Res 40: 9990–10004. 10.1093/nar/gks818
- ↵Menck CF, Munford V. 2014. DNA repair diseases: What do they tell us about cancer and aging? Genet Mol Biol 37: 220–233. 10.1590/S1415-47572014000200008
- ↵Mullenders L. 2015. DNA damage mediated transcription arrest: Step back to go forward. DNA Repair (Amst) 36: 28–35. 10.1016/j.dnarep.2015.09.005
- ↵Newman JC, Bailey AD, Weiner AM. 2006. Cockayne syndrome group B protein (CSB) plays a general role in chromatin maintenance and remodeling. Proc Natl Acad Sci 103: 9613–9618. 10.1073/pnas.0510909103
- ↵Nonet M, Scafe C, Sexton J, Young R. 1987. Eucaryotic RNA polymerase conditional mutant that rapidly ceases mRNA synthesis. Mol Cell Biol 7: 1602–1611. 10.1128/mcb.7.5.1602-1611.1987
- ↵Pelechano V, Wei W, Steinmetz LM. 2013. Extensive transcriptional heterogeneity revealed by isoform profiling. Nature 497: 127–131. 10.1038/nature12121
- ↵Petrenko N, Jin Y, Wong KH, Struhl K. 2016. Mediator undergoes a compositional change during transcriptional activation. Mol Cell 64: 443–454. 10.1016/j.molcel.2016.09.015
- ↵Proietti-De-Santis L, Drané P, Egly JM. 2006. Cockayne syndrome B protein regulates the transcriptional program after UV irradiation. EMBO J 25: 1915–1923. 10.1038/sj.emboj.7601071
- ↵Ramírez F, Ryan DP, Grüning B, Bhardwaj V, Kilpert F, Richter AS, Heyne S, Dündar F, Manke T. 2016. deepTools2: a next generation web server for deep-sequencing data analysis. Nucleic Acids Res 44: W160–W165. 10.1093/nar/gkw257
- ↵R Core Team. 2018. R: a language and environment for statistical computing. R Foundation for Statistical Computing, Vienna. https://www.R-project.org/.
- ↵Rockx DA, Mason R, van Hoffen A, Barton MC, Citterio E, Bregman DB, van Zeeland AA, Vrieling H, Mullenders LH. 2000. UV-induced inhibition of transcription involves repression of transcription initiation and phosphorylation of RNA polymerase II. Proc Natl Acad Sci 97: 10503–10508. 10.1073/pnas.180169797
- ↵Sabatella M, Theil AF, Ribeiro-Silva C, Slyskova J, Thijssen K, Voskamp C, Lans H, Vermeulen W. 2018. Repair protein persistence at DNA lesions characterizes XPF defect with Cockayne syndrome features. Nucleic Acids Res 46: 9563–9577. 10.1093/nar/gky774
- ↵Sarker AH, Tsutakawa SE, Kostek S, Ng C, Shin DS, Peris M, Campeau E, Tainer JA, Nogales E, Cooper PK. 2005. Recognition of RNA polymerase II and transcription bubbles by XPG, CSB, and TFIIH: insights for transcription-coupled repair and Cockayne syndrome. Mol Cell 20: 187–198. 10.1016/j.molcel.2005.09.022
- ↵Schiano C, Casamassimi A, Rienzo M, de Nigris F, Sommese L, Napoli C. 2014. Involvement of Mediator complex in malignancy. Biochim Biophys Acta 1845: 66–83. 10.1016/j.bbcan.2013.12.001
- ↵Selby CP, Sancar A. 1997a. Cockayne syndrome group B protein enhances elongation by RNA polymerase II. Proc Natl Acad Sci 94: 11205–11209. 10.1073/pnas.94.21.11205
- ↵Selby CP, Sancar A. 1997b. Human transcription-repair coupling factor CSB/ERCC6 is a DNA-stimulated ATPase but is not a helicase and does not disrupt the ternary transcription complex of stalled RNA polymerase II. J Biol Chem 272: 1885–1890. 10.1074/jbc.272.3.1885
- ↵Sollier J, Stork CT, García-Rubio ML, Paulsen RD, Aguilera A, Cimprich KA. 2014. Transcription-coupled nucleotide excision repair factors promote R-loop-induced genome instability. Mol Cell 56: 777–785. 10.1016/j.molcel.2014.10.020
- ↵Soutourina J. 2018. Transcription regulation by the Mediator complex. Nat Rev Mol Cell Biol 19: 262–274. 10.1038/nrm.2017.115
- ↵Spaeth JM, Kim NH, Boyer TG. 2011. Mediator and human disease. Semin Cell Dev Biol 22: 776–787. 10.1016/j.semcdb.2011.07.024
- ↵Takagi Y, Kornberg RD. 2006. Mediator as a general transcription factor. J Biol Chem 281: 80–89. 10.1074/jbc.M508253200
- ↵Thompson CM, Young RA. 1995. General requirement for RNA polymerase II holoenzymes in vivo. Proc Natl Acad Sci 92: 4587–4590. 10.1073/pnas.92.10.4587
- ↵van den Boom V, Citterio E, Hoogstraten D, Zotter A, Egly JM, van Cappellen WA, Hoeijmakers JH, Houtsmuller AB, Vermeulen W. 2004. DNA damage stabilizes interaction of CSB with the transcription elongation machinery. J Cell Biol 166: 27–36. 10.1083/jcb.200401056
- ↵van Gool AJ, Verhage R, Swagemakers SM, van de Putte P, Brouwer J, Troelstra C, Bootsma D, Hoeijmakers JH. 1994. RAD26, the functional S. cerevisiae homolog of the Cockayne syndrome B gene ERCC6. EMBO J 13: 5361–5369. 10.1002/j.1460-2075.1994.tb06871.x
- ↵van Vuuren AJ, Appeldoorn E, Odijk H, Yasui A, Jaspers NG, Bootsma D, Hoeijmakers JH. 1993. Evidence for a repair enzyme complex involving ERCC1 and complementing activities of ERCC4, ERCC11 and xeroderma pigmentosum group F. EMBO J 12: 3693–3701. 10.1002/j.1460-2075.1993.tb06044.x
- ↵Vermeij WP, Dollé ME, Reiling E, Jaarsma D, Payan-Gomez C, Bombardieri CR, Wu H, Roks AJ, Botter SM, van der Eerden BC, 2016. Restricted diet delays accelerated ageing and genomic stress in DNA-repair-deficient mice. Nature 537: 427–431. 10.1038/nature19329
- ↵Wahba L, Costantino L, Tan FJ, Zimmer A, Koshland D. 2016. S1-DRIP-seq identifies high expression and polyA tracts as major contributors to R-loop formation. Genes Dev 30: 1327–1338. 10.1101/gad.280834.116
- ↵Wang Y, Chakravarty P, Ranes M, Kelly G, Brooks PJ, Neilan E, Stewart A, Schiavo G, Svejstrup JQ. 2014. Dysregulation of gene expression as a cause of Cockayne syndrome neurological disease. Proc Natl Acad Sci 111: 14454–14459. 10.1073/pnas.1412569111
- ↵Wang W, Xu J, Chong J, Wang D. 2018. Structural basis of DNA lesion recognition for eukaryotic transcription-coupled nucleotide excision repair. DNA Repair (Amst) 71: 43–55. 10.1016/j.dnarep.2018.08.006
- ↵Wickham H. 2009. ggplot2: elegant graphics for data analysis. Springer-Verlag, New York.
- ↵Wilkinson L. 2006. Revising the Pareto chart. Am Stat 60: 332–334. 10.1198/000313006X152243
- ↵Wong KH, Jin Y, Struhl K. 2014. TFIIH phosphorylation of the Pol II CTD stimulates mediator dissociation from the preinitiation complex and promoter escape. Mol Cell 54: 601–612. 10.1016/j.molcel.2014.03.024
- ↵Xu J, Lahiri I, Wang W, Wier A, Cianfrocco MA, Chong J, Hare AA, Dervan PB, DiMaio F, Leschziner AE, 2017. Structural basis for the initiation of eukaryotic transcription-coupled DNA repair. Nature 551: 653–657. 10.1038/nature24658
- ↵Xu J, Wang W, Xu L, Chen JY, Chong J, Oh J, Leschziner AE, Fu XD, Wang D. 2020. Cockayne syndrome B protein acts as an ATP-dependent processivity factor that helps RNA polymerase II overcome nucleosome barriers. Proc Natl Acad Sci 117: 25486–25493. 10.1073/pnas.2013379117
- ↵Zaros C, Thuriaux P. 2005. Rpc25, a conserved RNA polymerase III subunit, is critical for transcription initiation. Mol Microbiol 55: 104–114. 10.1111/j.1365-2958.2004.04375.x
- ↵Zhang Y, Liu T, Meyer CA, Eeckhoute J, Johnson DS, Bernstein BE, Nusbaum C, Myers RM, Brown M, Li W, 2008. Model-based Analysis of ChIP-seq (MACS). Genome Biol 9: R137. 10.1186/gb-2008-9-9-r137