
Thousands of human mutation clusters are explained by short-range template switching
Abstract
Variation within human genomes is unevenly distributed, and variants show spatial clustering. DNA replication–related template switching is a poorly known mutational mechanism capable of causing major chromosomal rearrangements as well as creating short inverted sequence copies that appear as local mutation clusters in sequence comparisons. In this study, haplotype-resolved genome assemblies representing 25 human populations and multinucleotide variants aggregated from 140,000 human sequencing experiments were reanalyzed. Local template switching could explain thousands of complex mutation clusters across the human genome, the loci segregating within and between populations. During the study, computational tools were developed for identification of template switch events using both short-read sequencing data and genotype data, and for genotyping candidate loci using short-read data. The characteristics of template-switch mutations complicate their detection, and widely used analysis pipelines for short-read sequencing data, normally capable of identifying single nucleotide changes, were found to miss template-switch mutations of tens of base pairs, potentially invalidating medical genetic studies searching for a causative allele behind genetic diseases. Combined with the massive sequencing data now available for humans, the novel tools described here enable building catalogs of affected loci and studying the cellular mechanisms behind template switching in both healthy organisms and disease.
Twenty years after the publication of the draft genomes (International Human Genome Sequencing Consortium 2001; Venter et al. 2001), the Telomere-to-Telomere Consortium reported the first truly complete sequence of a human genome (Aganezov et al. 2022; Nurk et al. 2022). However, every genome is unique, and the challenge now is to understand the global genomic diversity in the human population (Karczewski et al. 2020; Taliun et al. 2021) and to build a comprehensive pangenome to represent this variation (Miga and Wang 2021). Whereas single nucleotide variation (SNV) and short insertion-deletions (indels) have been resolved relatively accurately with classical short-read sequencing (Bentley et al. 2008), the characterization of structural variants (SVs) and low-complexity sequences has been lacking. The Human Genome Structural Variation Consortium developed a method (Porubsky et al. 2021) for phased diploid genome assembly with a combination of long-read Pacific Biosciences (PacBio) whole-genome sequencing (WGS) (Eid et al. 2009) and Strand-seq phasing (Falconer and Lansdorp 2013) data. Ebert et al. (2021) applied this method to 32 diverse human individuals and produced 64 assembled haplotypes, that is, maternal and paternal copies of the genome. With the help of phased diploid genomes, they massively expanded the catalog of known SVs and, having the information of coinherited nearby sequence differences, could study in detail the different subclasses of complex variants. Such accurate characterization of multiple genomes will lay the foundation for understanding the role of complex mutations in human phenotypes and disease (Zhang et al. 2009; Weischenfeldt et al. 2013; Sakamoto et al. 2020) and in evolution (Perry et al. 2007; Zhang et al. 2009; Yan et al. 2021). More generally, the unprecedented resolution of the new genome data will open novel possibilities for understanding the mutational mechanisms of the complex eukaryotic genomes (Conrad et al. 2011; Veltman and Brunner 2012; Ségurel et al. 2014).
Although many subclasses of variants studied by Ebert et al. (2021) are clearly independent, mutations are known to be clustered (Ségurel et al. 2014), and their separation at the analysis stage may dismiss crucial information. We compared earlier two independent assemblies of the human genome (International Human Genome Sequencing Consortium 2004; Levy et al. 2007) and found mutation clusters consistent with DNA-replication related template switching (Löytynoja and Goldman 2017). The mechanism, originally described and studied in bacteria (Ripley 1982; Dutra and Lovett 2006), resembles FoSTeS (Fork Stalling and Template Switching) (Lee et al. 2007) and MMBIR (Microhomology-Mediated Break-Induced Replication) (Hastings et al. 2009) but is local, and reciprocal switches typically occur within a region of a few tens or hundreds of base pairs (bp). Unlike the chromosomal rearrangements created by FoSTeS and MMBIR, the footprint of local template switch mutations (TSMs) are short inversions, either happening in place or creating a reverse complement copy of a nearby sequence region; these are believed to be produced by the replication briefly switching either to the complementary DNA strand or going backwards along the nascent DNA strand (Supplemental Fig. S1; Ripley 1982; Dutra and Lovett 2006). In sequence comparisons, mutations compatible with the TSM mechanism appear as multiple nearby sequence changes and may be represented as combinations of SNPs, MNPs (single- and multinucleotide polymorphisms) and short indels in variant data. We showed earlier (Löytynoja and Goldman 2017) that the TSM candidates identified between the two assemblies segregate in the 1000 Genomes population data; that TSM-like mutation patterns can be identified in genotype data; and that parent-offspring trios (Besenbacher et al. 2016) contain consistent de novo mutations (DNMs). Here, I revisit the topic using the haplotype-resolved data of Ebert et al. (2021) and the variation information compiled by massive sequencing studies (e.g., Karczewski et al. 2020; Taliun et al. 2021) and study the TSM mechanism's role in generation of genomic variation. As haplotype-resolved genome data are still rare, I assess how reliably the TSM patterns found with de novo–assembled genomes can be identified using traditional short-read DNA sequencing.
Results
TSMs explain thousands of haplotypic mutation clusters
The SNVs, indels, and SVs of the variant data of Ebert et al. (2021) (called here “HaplotypeSV data”) (Table 1) were combined, and for each maternal and paternal genome copy, the clusters of sequence differences were identified (see Methods). For each mutation cluster locus within a haplotype, the identified variants were placed in their genomic background, creating two alleles with 150 bp of sequence context (Fig. 1A,B). Finally, having the two alleles—the region from the GRCh38 reference (called “REF”) and the alternative allele formed by the mutation cluster (called “ALT”)—the four-point alignment (FPA) algorithm (Löytynoja and Goldman 2017) was applied to find the best solution involving a template switch, testing both alleles as the ancestral state (Fig. 1C,D; see Methods). Despite attempts to evaluate TSMs under a probabilistic model (Walker et al. 2021), it is unclear when a potential TSM solution should be considered more plausible than a combination of SNVs and indels. Here, the TSM candidates were required to (1) be supported by at least two sequence changes, of which at least one is a base change, and as a result show a higher sequence identity across the whole region than the original forward-aligned solution; and (2) have a ➁→➂ region, inferred to be copied from the other template, of at least 8 bases long (Supplemental Fig. S1). Despite strong evidence of many VNTRs (variable number of tandem repeats) evolving through template switching (Supplemental Fig. S2), the candidate ➁→➂ regions were required to contain all four bases, thus removing hits within low-complexity sequences.
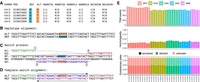
TSMs in HaplotypeSV data. (A) HaplotypeSV data contain a cluster of five SNVs that segregate as a unit among individuals (the first six are shown). (B) Within their genomic context, REF (cyan) and ALT (orange) alleles create two haplotypes. (C) The FPA algorithm attempts to explain the observed differences with two reciprocal template-switch events. In this case, the ALT sequence (A1, A2, A3; shown in green, blue, and red) can be created from the REF sequence by copying the A2 fragment in reverse-complement (RR; shown in magenta). (D) The template-switch solution fully explains the cluster of five base differences. (E) Total numbers of inferred TSM events in different HaplotypeSV samples after removal of low-complexity sequences (top); proportion of homozygous loci (middle); and proportion of ancestral (dark), derived (intermediate), and unpolarized (light) alleles (bottom).
Description of the data sets analyzed
Per individual, 3049–3934 mutation patterns consistent with the TSM mechanism were identified, the longest of them 318 bp in length (Table 2, “all”). Many of these were in proximity to repeat elements and, due to mismapping of sequencing reads, could potentially be nonindependent events counted multiple times. After removing the loci masked as repetitive sequence in the reference genome, there were 872–1121 high-quality TSM events per individual (Fig. 1E), the maximum length varying from 97–180 bp and the mean length being 11.56 bp (Table 2, “unmasked”; Supplemental Fig. S3). Homozygosity of inferred TSM loci varied from 26.7%–42.3% (Fig. 1E), and the proportion of singletons from 2.1%–9.0% (Supplemental Table S1). Although comparisons at the superpopulation level are affected by the different sample sizes, African (AFR) individuals expectedly had the lowest level of homozygosity and fixed loci, 29.2% and 0.7%, and the highest proportion of singleton loci, 7.8% (The 1000 Genomes Project Consortium 2015), whereas those for Europeans (EUR, including Azkenazi NA24385) and Asians (AAS, including South and East Asians) were higher and lower, respectively (Table 2). The greater variation of African populations and the old age of the TSM patterns were reflected in the sharing of loci across the superpopulations: AFR shared 45.6% and 49.9% of its TSM loci with EUR and AAS, respectively, whereas the latter two shared 75.3%–80.7% of their TSM loci with other superpopulations (Table 2). A unique feature of TSMs is that often alternative alleles can be polarized, that is, have the ancestral and derived state determined, without an outgroup (Supplemental Fig. S4). The ancestral allele could be defined in 87.7%–90.3% of the cases and the proportion of loci with the ALT variant being the ancestral allele was found ranging from 49.7–55.3 across the individuals (Fig. 1E; Supplemental Table S1). At the superpopulation level, Europeans had the highest average proportion of ancestral variants (Table 2), probably reflecting the European origin of the GRCh38 reference genome and thus capturing a greater amount of derived European TSM variation.
TSM statistics for HaplotypeSV data
Considering the candidate TSMs in the unmasked part of the reference genome, there were in total 2200 unique loci. Whereas the annotation revealed 96.2% of the mutation loci to be intergenic or intronic (Supplemental Table S2), 24 loci were inferred as coding. On closer look at three cases that had the ➁→➂ region of at least 12 bp long, segregation of the ALT variants revealed one of these as a false positive, but the two others seemed real. The inferred TSM events created a cluster of linked base substitutions and indels in the variant data and appeared at the lowest possible frequency, heterozygous in a single individual; the mutations resulted in an early stop codon in an alternatively spliced exon of gene ANP32E (Fig. 2) and changes in a nonsense-mediated decay destined transcript of gene PHF21A.
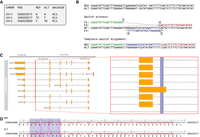
TSM causing an early stop codon. (A) The three variants included in the HaplotypeSV data appear together in one individual, NA19239. (B) All changes are explained by a template-switch event. (C) The affected sites are within an alternatively spliced exon of gene ANP32E, highlighted in blue. (D) The changes, shown in magenta, alter the reading frame and cause an early stop codon (bottom). Coding sites are shown in red.
Known TSM loci can be genotyped with short-read data
One individual in the HaplotypeSV data, NA12878, is the mother of a three-generation 17-member pedigree (CEPH 1463) sequenced to high coverage (Eberle et al. 2017) as well as one of the reference samples of the Genome in a Bottle (GIAB) initiative (Zook et al. 2016). The TSM loci identified in NA12878 were genotyped in different GIAB data sets and in the pedigree 1463 to assess their de novo versus standing, in vitro versus in vivo, and somatic versus germline origin. Using HaplotypeSV genotype data for NA12878, the genome contexts for the alternative alleles were reconstructed and, for each individual in the family, the reads extracted from that particular locus were mapped against the two alternative alleles. Outside the mutation locus, short reads should map evenly between the two alleles, but reads that overlap the positions differing between the alleles are expected to map to one allele only (Fig. 3A,B). By comparing the read coverage across the two alternative alleles, the test individual could be identified as homozygote for REF allele (R|R), heterozygote (R/A), or homozygote for ALT allele (A|A). A strategy similar to base calling was adopted and a 99% posterior probability was required for credible genotype calls (see Methods; Supplemental Fig. S5).
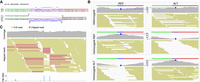
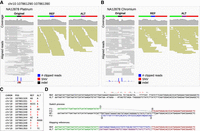
Genotyping of a TSM locus. (A) TSM solution for a complex mutation on Chromosome 10. The REF and ALT alleles share the left (green) and right (red) flanking region but have a different central part (blue and magenta). The differences in the central part are explained by a TSM event (below). (B) The two haplotypes with alternative central parts (blue and magenta bars) are used as the reference for remapping of reads extracted from the locus. In a heterozygous individual (top), reads are mapped evenly to the two alleles, giving uniform coverages (gray). In individuals homozygous for the REF allele (middle) and ALT allele (bottom), reads covering the central part are mapped predominantly to one allele only. Genotype is inferred of the mapping coverage in the middle of the locus (blue and magenta dots and dotted lines) using a function similar to that for genotype calling on nucleotides. (C) NA12878 Platinum data show fairly normal mapping coverage (gray, top), but a closer look at the reads (full and clipped reads in yellow and red, respectively) reveals an anomaly. The cluster of clip sites (blue; bottom) allows computational identification of the locus.
Starting with the Illumina Platinum (Eberle et al. 2017) and 10x Genomics Chromium (Weisenfeld et al. 2017; Marks et al. 2019) data sets for NA12878 (Table 1), and the TSM-like loci found in the HaplotypeSV data were genotyped. Focusing on the 864 loci that were not masked as repeats
or low-complexity sequences and that had enough read coverage in both data sets, the two short-read data sets were found to
provide the genotype and agree on it in 831 cases (Fig. 4A; Supplemental Table S3). Whereas 14 loci could not be genotyped with the short-read data using the 99% posterior probability cutoff, the variant
pattern in the HaplotypeSV data was inconsistent in 84 cases, and the genotype of the loci could not be determined. Of the
780 loci inferred to be either heterozygous or homozygous for the ALT allele in the HaplotypeSV data, the three data sets
agreed in 735 cases (Supplemental Table S3). Eight loci recorded variable in the HaplotypeSV data were inferred to be homozygous for the REF allele in both short-read
data sets. Many of these were in a repetitive sequence context and all loci were found to segregate among other samples in
the HaplotypeSV data, ruling out the possibility of DNMs. Although the reasons for inconsistent HaplotypeSV genotypes could
not be resolved, 74 of 84 cases showed intermediate depth ratios in short-read data, that is, r was not  , ≪1, or ≫1 (Fig. 4A; orange symbols around −0.5, −0.5). If these were de novo mutations, one would expect the ratios to be reverse, and a more
likely explanation is cross-mapping from duplicated sequence blocks. A small number of candidate TSM loci showed inconsistency
between different data sets, possibly due to similarly incorrectly mapped reads (Supplemental Fig. S6).
, ≪1, or ≫1 (Fig. 4A; orange symbols around −0.5, −0.5). If these were de novo mutations, one would expect the ratios to be reverse, and a more
likely explanation is cross-mapping from duplicated sequence blocks. A small number of candidate TSM loci showed inconsistency
between different data sets, possibly due to similarly incorrectly mapped reads (Supplemental Fig. S6).
Confirmation of HaplotypeSV TSM loci with short-read data. (A) Ratio of REF and ALT allele mapping coverage (r = depthREF/depthALT) reflects the genotype: r ≈ 1 (and thus log10 (r) ≈ 0) for a heterozygote; r ≪ 1 and r ≫ 1 for the two types of homozygotes. The log10 ratios agree for the NA12878 Platinum and Chromium data sets, and 95.5% of the 883 loci identified in HaplotypeSV data are called to contain at least one ALT allele with 99% posterior probability in both data sets; 17 and 10 loci are called homozygous REF with at least one data set and by both (top-right corner). (B) Of the 783 variable loci in NA12878 Chromium data, all but one locus are called to contain at least one ALT allele in the parents. In the 290 loci homozygous for ALT in NA12878 (orange), both parents contain at least one ALT allele. “Unknown” indicates inconsistent variant data or posterior probability below 0.99. One pseudocount was added to all values to avoid divisions by zero. In the legend, the inferred genotypes for the two data sets are separated by a colon, and X1/X2 represents the alternative arrangements of the two alleles, X1|X2 and X2|X1.
To further verify the genotyping approach, a similar analysis was performed on the parents and children of NA12878. On the parents, the 783 loci found in the HaplotypeSV data were genotyped and called to contain at least one ALT allele in the NA12878 Chromium data. The inferred genotypes showed strong agreement, and, of the 307 loci called homozygous for the ALT allele in NA12878, 290 could be genotyped with Chromium data of both parents and each of them contained at least one ALT allele (Fig. 4B; Supplemental Table S4). The only locus that appeared as a novel mutation according to parental data (R|R:R|R in Fig. 4B) was a false positive, and in manual verification, one parent was found to contain two supporting reads. Genotyping of the loci in the 11 children (CEPH pedigree 1463) required their transfer from GRCh38 to GRCh37. The lift-over worked and the parents’ (NA12877 and NA12878) alignment data (Platinum/GRCh37) contained enough reads to genotype 843 of the TSM-like loci found variable in NA12878 in the HaplotypeSV data. Except for loci that were inferred to be heterozygous in both parents (R/A,R/A), the observed genotypes matched nearly perfectly the expectation under the Mendelian segregation ratio (Table 3). An excess of heterozygotes in genotype data is a classic mark of artifact caused by sequencing reads originating from different loci, for example, due to duplication of genome regions. Seeing those among the CEPH 1463 children suggests that a proportion of inferred variants for NA12878 in the HaplotypeSV data are erroneous: The TSM events causing those variants may be real, but they have happened in duplicated copies, not within the loci where the calls were made.
Genotypes (%) of TSM loci in CEPH 1463 children
Novel TSM loci can be discovered with short-read data
Many of the TSM loci detected in the HaplotypeSV data had not originally been called with the short-read data, despite the two alleles differing over several tens of bases. A closer look at these revealed that alternative TSM haplotypes can show nearly uniform sequencing coverage across the region if the ➁→➂ region of the inferred TSM process (Fig. 3A) is long enough: The mapping algorithm then produces a decent mapping for the read core by clipping the mismatching overhangs (Fig. 3C). Although this is clearly undesirable behavior, the observation suggested a strategy to identify potential TSM loci in short-read data by searching for clusters of clip sites, extracting the reads mapped to the region, and then producing a local reassembly of the reads; in positive cases, the dissimilarities between the assembled sequences could be explained by a TSM event.
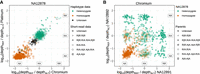
To test that, using SvABA, a tool developed for the detection of structural variants by local reassembly of short sequencing reads (Wala et al. 2018), the FPA algorithm was integrated (Löytynoja and Goldman 2017) to search for TSM patterns in the resulting contigs. Clusters of clip sites were identified in short-read data and clusters of variants in the corresponding variant data, performing the analysis independently on the Illumina Platinum (Eberle et al. 2017) and 10x Genomics Chromium (Weisenfeld et al. 2017) resources for NA12878. SvABA-FPA was then applied on each candidate locus (see Methods), and 1054 and 26,222 candidate TSM loci were found in the Platinum and Chromium data, respectively. Of these, 211 and 755 loci, respectively, passed the sequence-based filtering and 203 and 299 loci the subsequent mapping depth-based genotyping (being either heterozygous or homozygous for the ALT allele) (see Supplemental Fig. S7; Methods). The fact that 456 of the 755 Chromium hits passing the first stage of filtering could not be confirmed with read mapping indicates that the alternative haplotypes were created by a small number of reads. Whether these reads had originally been misaligned or represent low-frequency TSM mutations, possibly originating in vitro, could not be confirmed with the current data; similar hits not found in the Platinum data may be explained by different read lengths (Table 1) or technological differences between the standard and linked-reads Illumina sequencing and downstream bioinformatic methods used (Li 2013; Marks et al. 2019). A majority of the loci passing all filtering, 89.7% and 70.6% for Platinum and Chromium, respectively, were shared either with the other short-read approach or with the HaplotypeSV set (Fig. 5). On the other hand, the large number of candidate loci, 690 of the total 843, identified uniquely with the HaplotypeSV data suggests that a great majority of the loci do not contain misaligned and soft-clipped reads: if no variants were called at those loci in the Platinum and Chromium sets, no signal was present to include the loci for the short-read-based TSM search.
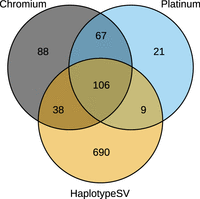
The number of TSM candidate loci identified in different data. The diagram shows the overlap of TSM candidate loci identified using the Platinum and Chromium short-read data and the HaplotypeSV genotype data for the reference individual NA12878. The Platinum and Chromium loci have passed sequence-based filtering and all sets have passed the mapping depth–based genotyping.
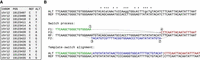
Fifty-nine cases that had the ➁→➂ fragment of at least 25 bases long were studied in more detail (Supplemental Data S1). Most of the cases showed the expected signal in the original alignment data that was removed when the same reads were mapped against the two alternative haplotypes (Fig. 6A,B), whereas in a few rare cases the variant calling had correctly captured the differences between the two TSM haplotypes (Fig. 6C,D). Some of the heterozygous loci were not called in any variant call set despite significant differences between the two haplotypes (Supplemental Fig. S8; Supplemental Data S1), and several loci homozygous for the ALT allele were uncalled in different variant call sets, including the HaplotypeSV data (Supplemental Fig. S9). As an example of the latter, 67 TSM candidates (Supplemental Fig. S7D) found in and confirmed by both Platinum and Chromium data were not present in the HaplotypeSV set. A closer look was taken at the 16 loci with the ➁→➂ fragment of at least 25 bases long, examining the loci in PacBio long-read sequencing data and 1000 Genomes variation data (Table 1; Supplemental Data S2; The 1000 Genomes Project Consortium 2015). All the studied cases were confirmed to be genuine mutation clusters by the PacBio data, and two types of errors in HaplotypeSV calls were observed: (1) The representation of the mutation cluster was incomplete, thus not allowing correct reconstruction of the alternative allele and discovery of the TSM event (Supplemental Fig. S10A); and (2) complete lack of variant calls (Supplemental Fig. S10B). In an extreme, the variants were missing from HaplotypeSV data despite being called in full for NA12878 in the 1000 Genomes data and clearly supported by all sequencing data (Supplemental Fig. S10C).
TSM candidates identified with short-read data. (A) In the Platinum data (left), a region in Chromosome 10 has an excess of soft clips (bottom, blue bars) and called variants (SNVs in red, indels in black); the mapping coverage (top, in gray) also shows atypical patterns. (B) Similar signals are seen in Chromium data. (C) The Platinum variant data contain six SNVs and six indels within 28 bp. (D) De novo assembly of the reads creates two locally highly dissimilar haplotypes compatible with the called variants (top). All differences can be explained with a TSM event, an inversion in place (middle). Using two haplotypes with alternative central parts (blue and magenta; bottom) as the reference, extracted reads map in full length (A,B; middle, right) with roughly even coverages. No variants for NA12878 were called in this region in HaplotypeSV data.
TSMs explain thousands of clusters in variation databases
A significant fraction of the TSM candidate loci were missing from the original variant call sets (Fig. 6C)—16 of the 59 closely studied loci were missing from both sets (Supplemental Data S1)—but none of the manually confirmed cases supported by both short-read data sets was completely absent from the dbSNP database (Sherry et al. 2001). Although dbSNP correctly lists many studied loci as multinucleotide variants (MNVs), all loci were also present as multiple SNVs and indels and some only as multiple independent MNVs or indels (Supplemental Fig. S11; Supplemental Data S1). The latter is slightly surprising as variants originating from a complex mutation are expected to be present in their entirety or not at all, and similar allele frequencies should allow phasing and grouping independent variants into MNVs (Choi et al. 2018).
The Genome Aggregation Database (gnomAD, v2.1.1) (Karczewski et al. 2020) contains variation found among 125,000 exomes and 15,700 genomes of unrelated individuals sequenced as part of various disease-specific and population genetic studies. Wang et al. (2020) identified gnomAD SNVs appearing within a proximity of 1–10 bp and provides them as phased variant pairs (Table 1). Using these data, variant pairs with similar allele counts (ACs; ΔAC ≤10%) were selected, the data of different variant-pair distances were merged, and for all clusters of at least three variants, the alternative alleles were created, and a search was made for a TSM solution to explain the differences (see Methods). Among the 91,300 clusters of three or more SNVs, a TSM solution was found for 4425 loci. Among these, a closer look was taken at the 192 cases where the ➁→➂ region was at least 25 bp long and the REF and ALT alleles differed at least by four SNVs (Supplemental Data S3).
Among the studied cases, the TSM mechanism perfectly explained MNVs consisting of up to 15 base changes (Fig. 7A,B) whereas the longest inferred TSM events had the ➁→➂ region of over a hundred bases (Supplemental Fig. S12). Consistent with previous findings, 36% of the TSM loci studied contained low complexity sequence or VNTRs, but base changes, including those in the two longest events of 119 and 125 bp (Supplemental Fig. S12B,C), were not necessarily explainable by a simple slippage mechanism; within a complex sequence, the longest TSM event was 90 bp long (Supplemental Fig. S12A). A locus in Chromosome 19, present in a single individual, was of particular interest as 16 of the 19 base changes of gnomAD MNVs could be explained with two adjacent 62- and 32-bp TSM events separated by a 16-bp forward fragment (Supplemental Fig. S13). This indicates that, similarly to larger arrangements (Lee et al. 2007; Zhang et al. 2009), local TSMs can also be chained into complex combinations. One should note that the gnomAD MNV data lack indels and no TSM patterns involving sequence length changes were included, meaning that the real number of mutation clusters explainable by the TSM mechanism is likely much higher.
Complex gnomAD MNV explained by a single TSM. (A) Wang et al. (2020) identified 15 SNVs within a 29-bp interval in Chromosome 12. (B) All the differences (top, marked with asterisks) can be explained with a TSM inverting a 39-bp-long fragment in place (middle, bottom).
In replicating the analysis with the DNM data from 33 large, three-generation CEPH families by Sasani et al. (2019) (Table 1), although no TSM-like patterns were found among the germline DNMs of the 70 second-generation individuals, four consistent patterns (Supplemental Fig. S14) were observed among the 24,975 de novo SNVs and small indels of the 350 third-generation individuals. As most variants were isolated and there were only 218 DNM clusters, this gives a frequency of 1.8% for TSMs among the clustered DNMs. Sasani et al. (2019) estimated that, on average, there are 70.1 de novo SNVs and 5.9 de novo indels per genome, but the germline status of third-generation variants cannot be verified. In general, the vast majority of mutations are somatic, with Conrad et al. (2011) estimating a ratio of 20:1 for non-germline to germline DNMs, and the observed TSM-like patterns are also likely to be somatic.
Discussion
My analyses extend the previous works (Löytynoja and Goldman 2017; Walker et al. 2021) and show that human genomes have thousands of mutation patterns consistent with DNA replication-related template switching and that these loci segregate within and between populations. I studied the haplotype-resolved genotype data by Ebert et al. (2021), two independent WGS experiments on the reference individual NA12878 and her extended family (Eberle et al. 2017; Weisenfeld et al. 2017; Marks et al. 2019), and variant information in the gnomAD database (Karczewski et al. 2020; Wang et al. 2020) and from a DNM study (Sasani et al. 2019). Whereas I found the HaplotypeSV data of Ebert et al. (2021) to have captured large numbers of TSM patterns and mostly to reflect the haplotypic differences between the chromosomes, the call set was far from perfect and I could identify many additional TSM-like loci using the independent short-read data sets. The characteristics of the loci missing from the HaplotypeSV data raise serious questions about the completeness of the Ebert et al. (2021) variant set, and some of the omitted TSM-like mutation patterns were perfectly visible in the sequencing data and called in full for exactly the same individual in the 1000G variant data. In addition to short-read data, de novo TSMs were identified in the data of Sasani et al. (2019), although their germline status could not be confirmed, and consistent singleton TSM patterns were seen in gnomAD variant data (Karczewski et al. 2020; Wang et al. 2020). Overall, the results demonstrate that, despite their relatively low rate, the TSM mechanism explains a significant fraction of MNVs seen in human variation data and thus contributes to correlation in local mutation frequencies (Harris and Nielsen 2014; Ségurel et al. 2014).
Whereas the ability of TSMs to create reverse-complement copies of short sequence fragments is highly interesting, the mechanistic origin of sequence differences is irrelevant to many applications of genome analysis. My analyses revealed that TSM-like mutations are found within genes and other potentially functional elements, and there are anecdotal reports of TSM-like mutations causing genetic diseases in humans (Menardi et al. 1997). Given this, a worrying finding of the study was that the DNA sequencing pipelines capable of identifying SNVs may miss inverted fragments of a few tens of bases. The difficulty of detecting certain TSM patterns comes from the ability of mapping tools to align the affected reads in their expected context after excessive clipping of the read ends. If this mapping error goes unnoticed in variant calling, it can invalidate, for example, medical genetic studies searching for causative alleles behind genetic diseases. On the other hand, Seplyarskiy et al. (2021) recently proposed an approach to separate the signals of different mutation processes, and among others, described signals from “asymmetric resolution of bulky DNA damage” and from “asymmetric replication errors.” Such asymmetric signal could be created by template switching if the 10× higher frequency of TSMs in leading strand seen in bacteria (Rosche et al. 1997; Seier et al. 2011) applies to other organisms, or if the mechanism is related, for example, to coordination or clashes of transcription and replication systems (Hamperl et al. 2017; Chen et al. 2019). Local TSMs have many similarities with the FoSTeS (Lee et al. 2007) and MMBIR (Hastings et al. 2009) mechanisms—and possibly with chromoanasynthesis in cancer (Liu et al. 2011; Holland and Cleveland 2012)—but due to their short length, they are expected to be more benign (Zhang et al. 2009). With novel tools shown here, TSM patterns can be identified in different types of genome data, enabling analyses of their genome-wide distribution and possible correlation with different cellular processes (Seplyarskiy et al. 2021). Such analyses should bring us closer to understanding the mechanisms underlying template switching.
Methods
Data
Ebert et al. (2021) genotype data (VCF; freeze3) were downloaded from http://ftp.1000genomes.ebi.ac.uk/vol1/ftp/data_collections/HGSVC2/release/v1.0/integrated_callset/, combining SNV, indel, and SV calls. Chromium data (BAM;VCF) were downloaded from https://ftp-trace.ncbi.nlm.nih.gov/ReferenceSamples/giab/data/NA12878/10Xgenomics_ChromiumGenome_LongRanger2.0_06202016/ and https://ftp-trace.ncbi.nlm.nih.gov/ReferenceSamples/giab/technical/10Xgenomics_ChromiumGenome_LongRanger2.0_06202016. Platinum data (BAM;VCF) were downloaded from http://ftp.1000genomes.ebi.ac.uk/vol1/ftp/data_collections/illumina_platinum_pedigree/data/CEU, via GitHub (https://github.com/Illumina/PlatinumGenomes) and from the NCBI dbGaP database (https://www.ncbi.nlm.nih.gov/gap/) under study ID phs001224.v1.p1. Pacific Biosciences’ contribution to the NIST GIAB initiative was downloaded from https://ftp-trace.ncbi.nlm.nih.gov/ReferenceSamples/giab/data/NA12878/PacBio_SequelII_CCS_11kb. 1000 Genomes variant data were downloaded from http://ftp.1000genomes.ebi.ac.uk/vol1/ftp/data_collections/1000G_2504_high_coverage/working/phase3_liftover_nygc_dir/. gnomAD data were downloaded via https://gnomad.broadinstitute.org/downloads#v2-multi-nucleotide-variants and Sasani et al. (2019) data through GitHub (https://github.com/elifesciences-publications/ceph-dnm-manuscript/tree/master/data). Reference genomes were downloaded from http://ftp.1000genomes.ebi.ac.uk/vol1/ftp/data_collections/HGSVC2/technical/reference (GRCh38) and from http://ftp.1000genomes.ebi.ac.uk/vol1/ftp/technical/reference (GRCh37 and 38). Description of the data sets is given in Table 1. With the exception of the CEPH 1463 children, all data used in this study are publicly available and the instructions for their download and analysis are provided in the Supplemental Code. The authorized access to the CEPH 1463 offspring data was under the project name “Properties of de novo template switch mutations.” The data were analyzed in a secure computer environment accessible only by the author, and only summary statistics of genotype inheritance are reported.
Analysis of haplotype data
The genotype data of Ebert et al. (2021) (i.e., HaplotypeSV data) were processed with a custom Python script (tsm_scan_SV2.py) internally utilizing BWA (Li 2013), SAMtools, and BCFtools (Danecek et al. 2021). The script detects clusters of variants and creates alternative haplotypes by replacing parts of the reference genome sequence with the variant bases. The reconstructed haplotypes (with 150 bp of flanking sequence) are then compared to the reference allele, and a TSM solution is searched reciprocally to create one of the alleles from the other. Each individual and chromosome was processed independently.
The candidate loci in NA12878 were processed with another Python script (tsm_alleles2.py) that (1) creates the two alleles for each locus using the reference sequence and the HaplotypeSV variant information, (2) extracts the reads mapped to the locus in a BAM alignment file and maps these reads to the two alternative alleles, and (3) computes the mapping coverage statistics for the two alleles, recording the mapping depth at the region differing between the alleles as well as immediately upstream and downstream of the differing region. The REF allele was taken from the reference genome, and the ALT allele was created by placing the NA12878 variants (each haplotype separately) into a copy of that; the differing regions were then placed in identical context with 500 bp of flanking sequence from the reference genome.
The genotype of the locus was inferred from the mapping coverage of the two alternative alleles using a strategy similar to
base calling. A minimum coverage of 10 reads for upstream, downstream, and within the differing region for either of the alleles
was required. Then, the probabilities for the three possible genotypes were obtained as
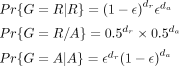 where ɛ is the error rate of 0.01 for the read being mapped to a wrong allele, and dr and da are the mapping coverages for the REF and the ALT alleles. The inferred genotype X, where X ∈ {R|R, R/A, A|A} (standing for homozygote REF, heterozygote, and homozygote ALT, respectively), was then the genotype with the highest probability
if that was at least 99% of the total probability
where ɛ is the error rate of 0.01 for the read being mapped to a wrong allele, and dr and da are the mapping coverages for the REF and the ALT alleles. The inferred genotype X, where X ∈ {R|R, R/A, A|A} (standing for homozygote REF, heterozygote, and homozygote ALT, respectively), was then the genotype with the highest probability
if that was at least 99% of the total probability
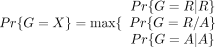 if for Y = {R|R, R/A, A|A}
 The variant annotation was performed using R (R Core Team 2020) and the package VariantAnnotation (Obenchain et al. 2014) and the software BEDTools (Quinlan and Hall 2010) based on Ensembl v. 106 gene models (Homo_sapiens. GRCh38.106.chr.gff3). Only one count of each annotation class was considered
for each locus.
The variant annotation was performed using R (R Core Team 2020) and the package VariantAnnotation (Obenchain et al. 2014) and the software BEDTools (Quinlan and Hall 2010) based on Ensembl v. 106 gene models (Homo_sapiens. GRCh38.106.chr.gff3). Only one count of each annotation class was considered
for each locus.
Analysis of short-read data
The FPA algorithm (Löytynoja and Goldman 2017), written in C++ and available through GitHub (https://github.com/ariloytynoja/fpa), was integrated into the SvABA tool (Wala et al. 2018). Clusters of more than one base mismatch were identified in VCF data using BCFtools and an awk script counting variants within 20-bp intervals. Similarly, clusters of more than 10 clipped reads were identified in BAM data using SAMtools and an awk script calculating the positions of soft clips based on the CIGAR string and another script identifying clusters of positions within 20-bp intervals. Candidate loci were targeted with SvABA-FPA and, for contigs showing two or more base differences in comparison to the reference sequence, TSM solutions were computed using both the REF and the ALT allele (i.e., SvABA-created contig) as the ancestral type. The resulting TSM candidates were filtered and those overlapping with repeat elements or low-complexity sequence, or having short length or low identity at flanking sequences were removed. More precisely, loci intersecting with masked sequence or assembled contigs having low sequence complexity (Trifonov's complexity with order 5 > 0.25; computed with program SeqComplex [Caballero et al. 2014]) were removed; TSMs were compared to forward alignments and required to be better, containing at least two edit events (of which at least one base mismatch) less than the nontemplate-switching alignment; of those, ones with ➀–➃ distance longer than 250 bp or shorter than 5 bp and upstream/downtream flanking regions or the ➁→➂ fragment showing sequence identity below 95% or being <10 bp long were discarded.
For the loci passing the sequence-based filtering, the REF and ALT alleles were placed in identical context with 500 bp of flanking sequence. Alignment data (in BAM format) were genotyped by extracting the reads and mapping them to the two alleles using the custom Python script. The genotype was inferred from the read coverage as explained above, and loci inferred as heterozygous or homozygous for the ALT allele were retained. Overlapping loci were counted using the R package GenomicRanges (Lawrence et al. 2013). The custom scripts for all steps and instructions for their use are provided in the Supplemental Code.
Analysis of CEPH 1463 data
The coordinates of candidate loci were transferred from GRCh38 to GRCh37 with CrossMap v0.2.9 (Zhao et al. 2014) using the Ensembl chain file. The same methods were used to genotype the loci.
Analysis of MNV data
The MNV data from gnomAD (Wang et al. 2020) and by Sasani et al. (2019) were processed similarly to the HaplotypeSV data with a Python script (tsm_scan_dnm.py). The script detects clusters of variants and creates alternative haplotypes by replacing parts of the reference genome sequence with the variant bases. It then compares the reconstructed haplotypes (with 150 bp of flanking sequence) with the reference allele and, reciprocally, searches for a TSM solution to create one of the alleles from the other. Tandem repeats were searched with trf (Benson 1999) and hits containing them in the ➁→➂ region were discarded.
Software availability
The Python/awk scripts used, the source code for the SvABA-FPA tool, and the instructions for their use are provided as Supplemental Code and deposited on GitHub (https://github.com/ariloytynoja/short-range-template-switching).
Competing interest statement
The author declares no competing interests.
Acknowledgments
I thank CSC – IT Center for Science and the University of Helsinki IT Center for the computing resources and the secure analysis environment, and the UH Biodata Analytics Unit for helpful discussions. This work was enabled by the Academy of Finland grant number 322681.
Footnotes
-
[Supplemental material is available for this article.]
-
Article published online before print. Article, supplemental material, and publication date are at https://www.genome.org/cgi/doi/10.1101/gr.276478.121.
- Received December 9, 2021.
- Accepted June 21, 2022.
This article is distributed exclusively by Cold Spring Harbor Laboratory Press for the first six months after the full-issue publication date (see https://genome.cshlp.org/site/misc/terms.xhtml). After six months, it is available under a Creative Commons License (Attribution-NonCommercial 4.0 International), as described at http://creativecommons.org/licenses/by-nc/4.0/.


