
TransMeta simultaneously assembles multisample RNA-seq reads
- 1Research Center for Mathematics and Interdisciplinary Sciences, Shandong University, Qingdao 266237, China;
- 2School of Mathematics, Shandong University, Jinan, Shandong 250100, China;
- 3School of Mathematical Science, Liaocheng University, Liaocheng 252000, China
-
↵4 These authors contributed equally to this work.
Abstract
Assembling RNA-seq reads into full-length transcripts is crucial in transcriptomic studies and poses computational challenges. Here we present TransMeta, a simple and robust algorithm that simultaneously assembles RNA-seq reads from multiple samples. TransMeta is designed based on the newly introduced vector-weighted splicing graph model, which enables accurate reconstruction of the consensus transcriptome via incorporating a cosine similarity–based combing strategy and a newly designed label-setting path-searching strategy. Tests on both simulated and real data sets show that TransMeta consistently outperforms PsiCLASS, StringTie2 plus its merge mode, and Scallop plus TACO, the most popular tools, in terms of precision and recall under a wide range of coverage thresholds at the meta-assembly level. Additionally, TransMeta consistently shows superior performance at the individual sample level.
RNA-seq is a powerful technology for transcriptome analysis. During the past five years, this technology has transitioned from research to clinical use (Phillips et al. 2020), which provides an opportunity to view the complexity of eukaryotic transcriptomes and identify the expressed transcripts and quantify their abundance precisely at a whole-transcriptome level (Wang et al. 2009; Wilhelm and Landry 2009; Marguerat and Bähler 2010; Ozsolak and Milos 2011). Assembling RNA-seq reads into full-length transcripts has become a crucial step and a challenging task.
For a single RNA-seq sample, there exist two main approaches to reconstruct transcripts: genome-guided and de novo. Genome-guided approaches take advantage of an existing genome to which the RNA-seq reads are first aligned by using mapping tools including HISAT (Kim et al. 2015), HISAT2 (Kim et al. 2019), STAR (Dobin et al. 2013), TopHat (Trapnell et al. 2009), or TopHat2 (Kim et al. 2013). Based on alignments, genome-guided assemblers such as StringTie2 (Kovaka et al. 2019), Scallop (Shao and Kingsford 2017), TransComb (Liu et al. 2016b), iPAC (Yu et al. 2020), StringTie (Pertea et al. 2015), Cufflinks (Trapnell et al. 2010), Class2 (Song et al. 2016), Scripture (Guttman et al. 2010), IsoInfer (Feng et al. 2011), IsoLasso (Li et al. 2011), iReckon (Mezlini et al. 2013), CEM (Li and Jiang 2012), Traph (Tomescu et al. 2013), and MITIE (Behr et al. 2013) can be used to reconstruct transcripts. Generally, these assemblers recover the transcripts by constructing a graph model (splicing graph) based on the read alignments and followed by an individual-designed path-searching algorithm. When the genome is unknown or partially known, de novo assemblers such as TransLiG (Liu et al. 2019), BinPacker (Liu et al. 2016a), Bridger (Chang et al. 2015), Trinity (MacManes and Eisen 2013), ABySS (Simpson et al. 2009), SOAPdenovo-Trans (Xie et al. 2014), and IDBA-tran (Peng et al. 2013) have been available for reconstruction of full-length transcripts directly from RNA-seq reads. Generally speaking, genome-guided methods are more commonly used because they are usually more accurate (Shao and Kingsford 2017).
Transcriptomic studies involve multiple samples. Constructing a consensus transcriptome from multiple samples is critical in an RNA-seq experiment for the subsequent quantification and differential expression and splicing analyses (Niknafs et al. 2017; Song et al. 2019). Thus, many meta-assembly computational methods have been developed, which can be summarized by two paradigms. The first one uses existing single-sample assemblers to reconstruct transcripts for each individual sample and then merges the transcripts of each sample by merging tools such as StringTie-Merge (Pertea et al. 2015) or TACO (Niknafs et al. 2017); however, the precision of this paradigm is usually low (Song et al. 2019). The second paradigm, such as the state-of-the-art meta-assembly tool PsiCLASS (Song et al. 2019), simultaneously analyzes multiple RNA-seq samples and outputs a set of meta-annotations, as well as a set of transcripts for each sample. PsiCLASS uses statistical methods to build the global subexon graphs and generates the assembly by dynamic programming optimization and voting algorithms. Although it achieves higher precision, its recall is relatively low (Song et al. 2019).
Here, we present TransMeta, a multisample transcriptome assembly algorithm that enables simultaneous and accurate assembly of RNA-seq reads from multiple samples. TransMeta can generate the consensus meta-assembly for multiple samples, as well as a certain set of transcripts for each individual sample.
Results
Overview of the TransMeta model
TransMeta first builds the traditional splicing graphs for each sample in parallel and then constructs a vector-weighted splicing graph (VWSG) with the edges and nodes being both weighted by vectors rather than scalar numbers by integrating the individual splicing graphs. After that, TransMeta reconstructs the initial consensus meta-assembly by using a cosine similarity-based combing strategy and a label-setting path-searching strategy, and produces a set of transcripts for each sample based on both the VWSGs and the initial meta-assembly followed by an estimation of their expression levels. Finally, TransMeta generates the mature meta-assembly by an extra filtering procedure (Fig. 1A–E).
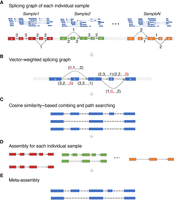
Flowchart of TransMeta. (A) Building individual splicing graphs for each sample in parallel. The nodes (exons) are named with lowercase letters; the values on each edge are the weights of the edge. (B) Merging individual splicing graphs into the vector-weighted splicing graph (VWSG). The nodes and edges in the VWSG are all the nodes and edges appearing in all the samples. Each edge in the VWSG is weighted by a vector, with the kth component of the vector being the corresponding weight of the edge in the splicing graph of sample k. (C) Using the cosine similarity-based combing strategy and the label-setting technique to generate the initial meta-assembly. (D) Extracting assembly for each sample from the VWSG. (E) Producing the mature meta-assembly.
Benchmarking TransMeta
We evaluated the performance of TransMeta at both the meta-assembly level and the individual sample level by comparing it with the state-of-the-art multisample assembler PsiCLASS, which can produce a meta-assembly for multiple samples and a certain set of transcripts for each individual sample as well. Additionally, we compared TransMeta with two of the current best single-sample assemblers, StringTie2 and Scallop, at the individual sample level and with the combinations of StringTie2 with StringTie2-merge and Scallop with TACO at the meta-assembly level. As did Song et al. (2019) for their evaluation of PsiCLASS, we benchmarked the TransMeta under two widely used aligners, HISAT2 and STAR, in terms of the standard criteria that have been widely used in evaluation of transcriptome assemblers. To this end, we rephrase that an assembled transcript is defined as correctly assembled if and only if its intron chain is exactly matched with a reference transcript in the ground truth. This reference transcript is considered to be accurately recovered. Then, the accuracy of an assembler was measured by recall (the fraction of accurately recovered reference transcripts in the ground truth) and precision (the percentage of correctly assembled transcripts out of all the output transcripts). These metrics were calculated by using Cuffcompare (v.2.2.1). The reference genome used in this research was GRCh38. The running commands and versions of all these tools are described in the Supplemental Notes.
Evaluation on the simulated data set
We used the RNA-seq read simulator RSEM (Li and Dewey 2011) to generate three simulated data sets, which are S1 (20 samples, 100-bp length, 35–36 million paired-end reads), S2 (25 samples, 76-bp length, 41–54 million paired-end reads), and S3 (15 samples, 76-bp length, 69–81 million paired-end reads). The parameters (e.g., abundances, fragment and read length distributions, and sequencing error model parameters) of the RSEM were taken from real RNA-seq samples. The detailed parameters and running commands for generating the simulated data sets are described in the Supplemental Notes. We then used the mapping tools HISAT2 and STAR to generate the alignments for each sample and ran the assemblers, followed by evaluating their performance at both the meta-assembly level and individual sample level.
Evaluation at the meta-assembly level
Typically, assemblers filter out their assembled transcripts with lower estimated expression levels via introducing a tradeoff parameter to balance the precision and recall. With increased filtering parameter, the precision might generally increase, whereas the recall decreases. Hence, to evaluate the assemblers’ capability to balance precision and recall, we drew a precision-recall curve for each assembler based on a wide range of its filtering thresholds (for details of the parameter settings for each assembler, see the Supplemental Notes). On the three simulated data sets under the HISAT2 and STAR alignments, we ran TransMeta and PsiCLASS with different filtering thresholds to get the sets of meta-assemblies, then ran StringTie2 and Scallop with their default settings for each individual sample, and finally merged them by using StringTie2-Merge and TACO, respectively, with different filtering thresholds. Given the precision-recall curves generated for all compared assemblers over a wide range of filtering thresholds, we found that TransMeta consistently had its precision-recall curves much higher than those of the compared assemblers on the three simulated data sets under both aligners HISAT2 and STAR. Specifically, on the simulated data set S1 under the HISAT2 alignments, when we adjusted the coverage thresholds of all the assemblers to set their assemblies all to the precision of 0.7 (or any other value), the recall of TransMeta reached about 0.38, which is ∼20% higher than that of PsiCLASS, ∼41% higher than StringTie2 system, and ∼90% higher than Scallop + TACO (Fig. 2A). Evaluated based on the areas under the precision-recall curve (AUC) scores, we found that the AUC score of TransMeta was ∼13.7% higher than that of PsiCLASS, 22.3% higher than that of StringTie2 system, and 49.8% higher than that of Scallop + TACO. Under the STAR alignments, all the assemblers performed similarly well as they did under the HISAT2 alignments. The performance comparisons are summarized in Supplemental Figure S1A. Further tests on the simulated data sets S2 and S3 under aligners HISAT2 and STAR showed that TransMeta consistently performed better as it did on data set S1 (Supplemental Fig. S2A,B,E,F).
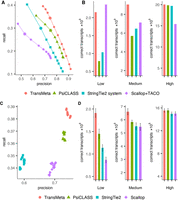
Performance evaluations on the simulated data set S1 under the HISAT2 alignments. (A) Precision-recall curves of the assemblers. The points on the curve of an assembler correspond to the filtering thresholds of the assembler; the circled one, to the default value. (B) Distributions of numbers of correctly recovered transcripts against the tools that were separately counted according to whether their expression is low, medium, or high at the meta-assembly level. (C) The precision and recall of the assemblers on different samples at the individual sample level under their default settings. Different colors correspond to different assemblers, and each point corresponds to a specific sample. (D) Distributions of averaged numbers of correctly recovered transcripts against the tools that were separately counted according to whether their expression is low, medium, or high at the individual sample level. The error bars show the standard deviation across the samples.
In general, it is more challenging to reconstruct transcripts with relatively low expression than those with higher expression (Canzar et al. 2016; Shao and Kingsford 2017). Therefore, we further evaluated TransMeta's performance in reconstructing transcripts of different expression levels. We divided the expressed transcripts into three parts equally according to whether their expression levels were low, medium, or high (for the detailed description of the expression levels, see the Supplemental Notes). On data set S1, the comparison results showed that TransMeta correctly recovered much more medium-expressed transcripts than the others, whereas its ability to correctly reconstruct low- and high-expressed transcripts is comparable to the best performers (Fig. 2B). In addition, the comparison results under the STAR alignments revealed that TransMeta consistently outperformed all the others in recovering transcripts of different expression levels. We further evaluated the assemblers on data sets S2 and S3 under both the HISAT2 and STAR alignments. As we expected, TransMeta demonstrated superior performance, similarly as it did on data set S1 (Supplemental Figs. S1B, S3A,B,E,F).
Evaluation at the individual sample level
TransMeta and PsiCLASS are the so-called meta-assemblers, but they may also produce a certain set of transcripts for each sample. Thus, we compared their performance with the single-sample assemblers StringTie2 and Scallop using their default settings at the individual sample level. On all the 60 samples from the three simulated data sets under both HISAT2 and STAR alignments, TransMeta consistently showed superior performance. Specifically, averaged on the 20 samples of data set S1 under the HISAT2 alignments, the recall of TransMeta reached about 0.38, which was ∼5.6% higher than that of PsiCLASS and >11.4% higher than those of StringTie2 and Scallop. Meanwhile, TransMeta had the highest precision (Fig. 2C). And, under the STAR alignments, a similar trend was observed (Supplemental Fig. S1C). We further tested them on the simulated data sets S2 and S3 under both the HISAT2 and STAR alignments and observed that TransMeta performed better as it did on data set S1 (Supplemental Fig. S2C,D,G,H). We also tested them on all three simulated data sets S1, S2, and S3 under both aligners HISAT2 and STAR in correctly identifying transcripts of different expression levels as we did in the last section. We observed again that TransMeta consistently performed better. It can be seen from Figure 2D (resp. Supplemental Fig. S1D) that TransMeta consistently performed the best for all the expression levels on the simulated data set S1 under the aligner HISAT2 (resp. STAR) and from Supplemental Figure S3, C, D, G, and H that TransMeta retained superiority on both S2 and S3 under both aligners HISAT2 and STAR.
Additional evaluation on the simulated data set S1
According to the above tests, TransMeta showed good and robust performance on all the simulated data sets S1–S3. The assemblers possessed highly similar performance trends across the three simulated data sets. Thus, the following additional tests were made based on data set S1. First, as is known, for the simulated data set, the ground truth was known with certainty. Therefore, we further ran HISAT2 via using the options ‐‐ss and ‐‐exon, which, respectively, provided the splice sites and exons in the ground truth to HISAT2 during building the index, toward producing more accurate alignments. Subsequently, based on the newly generated alignments, we ran all the assemblers and evaluated their performance and found that TransMeta maintained the best performance (Supplemental Fig. S4). Second, in the TransMeta package, we provided an option -g for the annotation-guided assembly, where -g provided a set of reference transcripts to guide the assembly procedure. Under the annotation-guided mode, we compared TransMeta with StringTie2 (other tools did not have such an option) under the HISAT2 alignments, and the results showed that TransMeta significantly outperformed StringTie2 (Supplemental Fig. S5A). Third, at the individual sample level under the HISAT2 alignments, we additionally drew the precision-recall curves based on the filtering threshold for all the assemblers, and TransMeta also achieved the highest precision-recall curve (Supplemental Fig. S5B). Fourth, we further compared all the assemblers with gtfmerge, a simple tool that took the union of the assembled transcripts from each individual sample. Because gtfmerge simply took the union, the number of transcripts generated by it was quite large. As a result, its precision was quite low, although its recall was relatively higher. Therefore, we computed the F-score, a harmonic mean of recall and precision (calculated as 2 × precision × recall / (precision + recall)) to evaluate the overall performance of each assembler. Based on the results, TransMeta performed the best (Supplemental Table S1).
Evaluation on the real data sets
We can explicitly know the ground truth for the simulated data, but simulated data sets that are generated by using mathematical models cannot capture the entire features of real biological data. For this reason, the performance evaluation based on real RNA-seq data sets is of great necessity. Although the ground truth of the real data sets cannot be known precisely, it is generally safe to assume that an assembler is more accurate if it recovers more known annotated transcripts. In this research, all the reference transcripts from the NCBI-RefSeq annotations were primarily set as the ground truth, as in previous studies (Kovaka et al. 2019), to benchmark TransMeta. However, as we know, there are different versions of reference annotation libraries; thus, we additionally set the GENCODE annotations as the ground truth to make the analysis.
In this research, five human RNA-seq data sets were used for evaluating the performance of the assemblers, which are R1, the liver cells data set with 73 samples; R2, the fetal retinal pigment epithelium cells data set with 48 samples; R3, the urinary bladder epithelial cells data set with 35 samples; R4, the NHDF primary human fibroblasts cells data set with 21 samples; and R5, OCT embedded kidney tumor tissue cells data set with 12 samples. The accession number of each data set can be found in the Supplemental Notes. It is worth mentioning that data set R1 was previously used by Song et al. (2019) in their evaluation of PsiCLASS. We aligned all the RNA-seq data to the reference genome using HISAT2 and STAR and ran the assemblers. Then we assessed the performance of TransMeta at both the meta-assembly level and the individual sample level.
Evaluation at the meta-assembly level
We ran the assemblers with different filtering thresholds as we did for the simulated data sets. On the whole, TransMeta maintained its superiority over other tools. Specifically, we can see from Figure 3A, which shows the comparison results under the HISAT2 alignments, that TransMeta has improved precision-recall compared to other tools across all the five data sets at the meta-assembly level. As an illustration, we considered precision 0.5 (or any other value), which means that we adjusted the filtering parameters of each assembler to make their precision reach about 0.5. Then on the five tested data sets R1–R5 under the HISAT2 alignments, the recalls of TransMeta reached about 0.11, 0.15, 0.16, 0.14, and 0.17, respectively; those of the second-best assembler PsiCLASS were about 0.07, 0.11, 0.12, 0.11, and 0.14, respectively; those of StringTie2 were about 0.05, 0.09, 0.11, 0.09, and 0.12, respectively; and those of Scallop + TACO were relatively worse. It means that under the same precision level, TransMeta correctly identified ∼21%–57% more transcripts than PsiCLASS and 42%–120% more than the StringTie2 system. The precision of Scallop + TACO cannot reach 0.5 no matter how we adjusted their filtering parameters (Fig. 3A). Furthermore, in terms of the AUC, TransMeta showed an improvement of ∼17%–35% over PsiCLASS, as well as 19%–62% over the StringTie2 system on the five data sets, whereas Scallop + TACO showed relatively poor performance. After repeating the evaluation by using the aligner STAR instead of HISAT2, we observed results comparable to those obtained by using the aligner HISAT2 (Supplemental Fig. S6A).
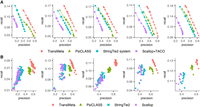
Performance evaluations on the five real data sets R1–R5 under the HISAT2 alignments. (A) Precision-recall curves of the assemblers. The points on each curve correspond to the filtering thresholds of each assembler; the circled one, to the default value. (B) The precisions and recalls of the assemblers on different samples at the individual sample level under their default settings. Different colors correspond to different assemblers, and each point corresponds to a specific sample.
Evaluation at the individual sample level
As in the simulated data set, we investigated the performance of the assemblers at the individual sample level. Again, TransMeta achieved the best performance under its default settings. Specifically, on 187 out of the 189 individual samples from the five different RNA-seq experiments, both the recall and precision of TransMeta consistently were the highest. For instance, averaged on the 73 samples from R1, TransMeta correctly reconstructed ∼19.6% more transcripts than PsiCLASS, as well as 62.1% and 75.2% more than the single-sample assemblers StringTie2 and Scallop, respectively. Meanwhile, its precision was the highest on all 73 samples, which were on average ∼15% higher than those of PsiCLASS and over twofold higher than those of StringTie2 and Scallop (Fig. 3B). Again, we obtained comparable test results by replacing HISAT2 with STAR (Supplemental Fig. S6B).
Additional evaluation on the real data sets R1–R5
According to the above tests and analyses, TransMeta showed satisfactory performance. However, we additionally performed the following test. First, as mentioned above, there are different versions of reference annotation libraries. Therefore, we further set the GENCODE annotations as the ground truth for performance evaluation under both the HISAT2 and STAR alignments, and as expected, TransMeta outperformed the alternatives (Supplemental Fig. S7). Second, we further drew the precision-recall curves at the individual sample level, where TransMeta achieved the highest curves on all the tested samples (Supplemental Fig. S8). Third, for the real data sets, setting all the annotations as the ground truth can possibly cause biases in the accuracy evaluation because, for a certain sample, some annotated transcripts may not be expressed. Therefore, we further used the well-known RNA-seq quantification tool kallisto to quantify each sample in the five real data sets R1–R5 (the running command of kallisto is detailed in the Supplemental Notes), and we selected the expressed transcripts (the ones with estimated TPM > 0) as the ground truth for each sample, and the union of each sample's expressed transcripts as the ground truth for the meta-assembly. Then we evaluated the performance of the assemblers under such ground truth in terms of precision and the number of correctly recovered transcripts. As expected, TransMeta performed the best (Supplemental Figs. S9, S10). Fourth, as in the simulated data set, we evaluated the annotation-guided mode for TransMeta and StringTie2 (Supplemental Fig. S11). Fifth, we also compared all the assemblers with the gtfmerge tool (Supplemental Tables S2–S6).
Evaluation on small-scale data sets
We next investigated TransMeta's multisample strategy on small data sets, which are R6, the CD20+ cell data set with six samples, and R7, the MCF-7 breast cancer cells data set with three samples. R6 was obtained from NCBI Sequence Read Archive (SRA; https://www.ncbi.nlm.nih.gov/sra), and R7 was obtained from the ENCODE project. The accession number of both data sets can be found in Supplemental Notes. We then evaluated the performance at both meta-assembly and individual sample levels under the HISAT2 alignments. The comparison results showed that, at the meta-assembly level on both small-scale data sets, TransMeta achieved the highest precision-recall (Fig. 4A). At the individual sample level, TransMeta maintained the best performance as well (Fig. 4B).
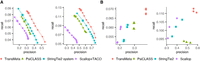
Performance evaluations on the two small-scale data sets R6 and R7 under the HISAT2 alignments. (A) Precision-recall curves of the assemblers. The points on each curve correspond to the filtering thresholds of each assembler; the circled one, to the default value. (B) The precisions and recalls of the assemblers on different samples at the individual sample level under their default settings. Different colors correspond to different assemblers, and each point corresponds to a specific sample.
Evaluation on large-scale data sets for the meta-assemblers TransMeta and PsiCLASS
TransMeta and PsiCLASS are the so-called meta-assemblers that simultaneously analyze multiple samples. To evaluate their performance in producing meta-assemblies on large-scale data sets, we randomly selected 100, 200, 300, 400, and 500 subsets from the poly(A)-selected lymphoblastoid samples from the GEUVADIS population variation project and mapped them to the reference genome using HISAT2. Based on the alignments, we ran TransMeta and PsiCLASS with different filtering thresholds. As Figure 5, A through E, shows, TransMeta consistently achieved higher precision-recall on the five subsets with different numbers of samples.
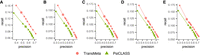
Comparisons of TransMeta and PsiCLASS on the large-scale data sets under the HISAT2 alignments at the meta-assembly level. (A–E) Precision-recall curves of TransMeta and PsiCLASS on 100, 200, 300, 400, and 500 subsets of GEUVADIS samples. The points on each curve correspond to the filtering thresholds of each assembler; the circled one, to the default value.
Comparison of running time and memory usage
To evaluate the computational efficiency of the assemblers, we compared the CPU time and memory usage of all the assemblers on the five real data sets R1–R5 based on both the HISAT2 and STAR alignments. The meta-assemblers TransMeta and PsiCLASS were run with 25 threads, and the single-sample assemblers StringTie2 and Scallop were run sequentially to assemble individual samples. The comparisons are detailed in Supplemental Table S7. For instance, on data set R1 with 73 samples under the HISAT2 alignments, TransMeta took ∼133 min with a peak memory of 11 GB, whereas PsiCLASS took ∼228 min with a peak memory of 11.7 GB, StringTie2 took 188 min with <1 GB memory, and Scallop took 251 min with a peak memory of ∼4.9 GB. These statistics implied that TransMeta might not be the most efficient, but it could be quite acceptable for practical use.
Discussion
This research introduced a new method, TransMeta, that can simultaneously assemble RNA-seq reads of multiple samples. It can output a consensus assembly for an RNA-seq experiment with multiple samples, as well as a certain set of transcripts for each individual sample. It consistently performs the best on both real and simulated data sets at both the meta-assembly and individual sample levels.
It is critical for an RNA-seq experiment to determine the set of expressed genes and transcripts for the subsequent quantification and differential expression and splicing analyses. However, transcriptome reconstruction for the single sample has limited utility for downstream analyses of transcriptional dynamics across many samples (Niknafs et al. 2017). Following the declaration by Song et al. (2019), we developed the TransMeta to construct the consensus transcriptome from multiple input RNA-seq data sets. At the meta-assembly level, the assemblers are capable of recovering more correct transcripts than those at the single-sample level. As stated in a previous study (Tasnim et al. 2015), such superiority could be attributed to the fact that with more alignments of RNA-seq reads from multiple samples being taken into account, more splicing patterns can be detected; as a result, more transcripts can be discovered (thus improving the recall). However, at the same time, the detectable splicing patterns become more complicated, which increases the difficulty of recovering full-length transcripts. To tackle this problem, we built the VWSG model, upon which we designed the cosine similarity–based combing strategy and a label-setting path-searching strategy, making TransMeta a robust meta-assembler.
In the VWSG, the edges and nodes are weighted by vectors rather than scalar numbers with the element in kth position of the vectors being the corresponding weight in the sample k. Based on the VWSG, TransMeta generalizes the transcriptome assembly from one dimension (single-sample level) to higher dimensions (multiple-sample level). We treat the vector weights of the edges (or nodes) in VWSG as points in S-dimensional space (where S is the number of samples). Thus, when S is equal to one, that is the case for the single sample. Therefore, the VWSG inspired us to generalize the core ideas of the traditional single-sample-based assembler into the multiple-sample-based approaches. Inspired by the TransComb (Liu et al. 2016b) paper, we thus introduced a constrained program to hunt for the potential right connections between the incoming and outgoing junctions of an exon (i.e., “combing strategy” mentioned in TransComb), which took both the vector weights (i.e., the sequence depth information of each sample) and the paired-end information into account, and considered the cosine similarity between the vector weights of the junctions to design the constraints and the object function. Then, based on the generalized combing strategy of the junctions, a dynamic label-setting path-searching strategy was modified toward accurately recovering the full-length transcripts.
Although we have shown the significant advantages of TransMeta, there remains room for improvement in the future. For instance, the current version of TransMeta is not compatible with long-read RNA-seq data sets (e.g., PacBio or Nanopore). We plan to integrate long reads into TransMeta in our future research.
The software was developed to be user-friendly and is expected to play a crucial role in new discoveries of transcriptome studies in RNA-seq experiments with multiple samples, especially in complicated human diseases related to abnormal splicing events and expression levels, such as cancer, and most genetic diseases.
Methods
To comprehensively use the information from different RNA-seq samples, TransMeta builds a novel graph model, namely, the VWSG, in which each edge (node) is weighted by a vector rather than a scalar number. The VWSG integrates the sequence depth information of multiple samples and plays a critical role in the assembly procedure. Depending on the VWSG, TransMeta extracts reliable consensus paired paths and uses a cosine similarity–based combing strategy and a label-setting path-searching strategy to reconstruct the transcripts (for the flowchart of the TransMeta algorithm, see Fig. 1A–E).
Building the VWSG
The VWSG is a consensus graph that reflects the sequence depth information of all the RNA-seq samples. To generate the VWSG, we first build the traditional splicing graphs for the individual samples and then integrate them into the so-called VWSG.
Building the traditional splicing graphs for each sample in parallel
For each RNA-seq sample, given the alignments of the RNA-seq reads to a reference genome, we first cluster all the aligned reads into different gene loci according to the overlap of the aligned coordinates of reads. For each gene locus, an exon (a region that is continuously covered by aligned reads) is denoted as e = [el, er], where el and er are the starting and ending sites of the exon in the genome, and each splice junction is denoted as j = jl → jr, where jl and jr are the two coordinates of the splice junction; consequently, a traditional splicing graph that corresponds to the gene locus could be built.
Then, the sequence depth information will be projected onto the exons (nodes) and splice junctions (edges) of the splicing graph as their weights. Specifically, the weight of each exon is defined as the average coverage of the aligned reads to this exon, and the weight of every single splice junction is defined as the number of spliced reads that span it. Note that if a read is aligned to multiple sites, suppose N, the contribution of this read is recorded as 1/N.
Furthermore, taking the paired-end sequence information into account, we generate a set of paired paths on each splicing graph, denoted as P. Specifically, for each pair of the mated reads r1 and r2, suppose that r1 spans a path sp1 = ni1 → ni2 → … → nip, and r2 spans sp2 = nj1 → nj2 → … → njq in the splicing graph, and sp1 and sp2 share a same subpath spoverlap = nm1 → nm2 → … → nmk, satisfying p + q−k ≥ 3, where spoverlap is the prefix subpath of one and suffix subpath of the other, then the mated reads r1 and r2 determine the paired path sp by connecting sp1 and sp2 via the overlapped subpath spoverlap, which is added to P. For the case of single-end reads, if a read spans subpath sp = ni1 → ni2 → … → nip in the splicing graph and P ≥ 3, then we add sp to P. Noting that different paired-end (or single-end) reads may produce the same paired path, for each paired path p in P, we set the number of paired-end (or single-end) reads that generate it as its coverage, denoted by cov(p).
Integrating traditional splicing graphs of individual samples into VWSG
To make full use of the sequence depth and paired-end sequence information from all the samples of an RNA-seq experiment, we then build the VWSG for each gene locus by integrating the traditional splicing graphs from all samples together. For each gene locus, we denote Gk = (Ek, Jk) (k ∈ [1, S]) as the splicing graph in sample k (suppose there are S samples in an RNA-seq experiment), where Ek is the set of exons (nodes), Jk is the set of splice junctions(edges), and, for each exon e in Ek and j in Jk, we denote cov(e) and cov(j) as the weight of the exon and the splice junction, respectively.
We first generate an unweighted consensus graph, GU =(EU, JU) in which the nodes in EU and edges in JU, respectively, represent all the exons and splice junctions appearing at least once in  (k ∈ [1, S]), which is achieved in the following way. Initialize GU = G1; then for k from two to S, for each node (exon),
  in Ek, if there exists node (exon)
  in EU such that they overlap, we then set
  and
and  otherwise, and further set
  . After that, for those coordinates of splice junctions appearing in an exon, we split the exon into several partial exons
accordingly. That is, if for any splice junction
. After that, for those coordinates of splice junctions appearing in an exon, we split the exon into several partial exons
accordingly. That is, if for any splice junction  in JU and any exon
  in EU, such that el < jl < er, we will split e into e′ = [el, jl] and
  , and in addition, we add a new splice junction (i.e., derived splice junction)
  to JU. For the case el < jr < er, e is split into
  and
and  , and the derived splice junction is
  . Therefore, in the unweighted consensus graph, we divide the splice junctions into two categories: the nonderived (the ones
that are captured by the mapping tools) and the derived (the ones that are produced by the aforementioned separating exons).
. Therefore, in the unweighted consensus graph, we divide the splice junctions into two categories: the nonderived (the ones
that are captured by the mapping tools) and the derived (the ones that are produced by the aforementioned separating exons).
Next, we weight the exons and junctions in GU with vectors in the following way. For each splice junction j (exon e) in GU, initialize a vector vwj (vwe) of size S with all its components being zero. Then, for each nonderived splice junction j in JU, for k from one to S, if j ∈ JK, then vwj = vwj + cov(j)Ik, where Ik is a vector with its kth component being one and all other components being zero. For the cases of derived splice junction j = jl → jr, for k from one to S, if there exists an exon  in Ek, such that
  , then vwj = vwj + cov(e′)Ik, where Ik is a vector with its kth component being one and all other components being zero. And then, for each node (exon) e = (el, er) in EU, for k from one to S, if there exists an exon
  in Ek such that there is an overlap between them, then vwe = vwe + cov(e′)Ik, where Ik is a vector with its kth component being one and all other components being zero.
After the above procedure, we generate the VWSG, in which the exons and splice junctions are all weighted by vectors of dimension
S with the kth component being the corresponding weight in the kth sample. And, for each splice junction j (exon e), we also define a consensus weight cwj (cwe) as the norm of its vector weight vwj (vwe), that is, 
 , where vwjk (vwek) is the kth component of vwj (vwe).
Because of the sequencing or mapping errors, there are quite a few spurious splice junctions in the VWSGs. Usually, the weight of the spurious splice junction is relatively low; hence, we use the following heuristic criteria to remove the potential false positives: (1) We remove a splice junction j in JU with all the components in vwj less than one; (2) if there is an exon with multiple out- (or in-) splice junctions, we remove the splice junction j with its consensus weights cwj <10% the total out- (or in-) consensus weights; and (3) for an exon e, if there exists a derived splice junction from e′ to e and a derived splice junction from e to e′′, while a nonderived splice junction j from e′ to e′′, then if cwe is less than cwj, we remove e and all splice junctions associated with it.
Moreover, we map the paired paths of each sample to the VWSG and generate a consensus paired path set CP, where each paired path p in CP is weighted by a vector, vwp, of dimension S with its kth component being cov(p) in kth sample, and p is also weighted by a consensus weight, cwp, as in the aforementioned definition. To minimize the false positives, for each paired path p in CP, if more than one-third of the components in vwp is zero, we will remove p from CP.
Generating transcript-representing paths
Ideally, each expressed transcript corresponds to a path in the VWSG = (E, J), where E is the set of exons (nodes), and J is the set of splice junctions (edges). Therefore, establishing precise connections between the incoming and outgoing junctions for each exon in VWSG is of great importance for accurately recovering the transcript-representing paths. Specifically, suppose that the number of incoming (outgoing) junctions of exon e is m (n). There are up to m× n possible connections between the incoming and outgoing junctions of e. However, not all the connections are correct. Our goal is to determine the potential correct connections such that they would explain the to-be-predicted transcripts, which can be achieved by the following combing strategy.
Combing the incoming and outgoing splice junctions of each exon based on the cosine similarity
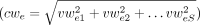
Note that each junction j in J is weighted by a vector vwj, which could be regarded as a point (or vector) in an S-dimensional space (where S is the number of samples). For the two splice junctions j and j′, where j is an incoming junction of exon e and j′ is an outgoing junction of e, if j and j′ are appearing in the same transcript across multiple samples, then there will be a high possibility that vwj and vwj′ possess some similarity. Subsequently, we take into account the cosine similarity, a metric that pays more attention to directions,
which measures similarity as the cosine of the angle of two vectors, and two similar vectors are expected to have a small
angle. Mathematically, the cosine similarity between two vectors vwj and vwj′, respectively, on junctions j and j′, which are incident with a node (exon), is defined as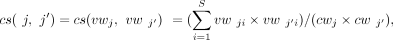 where vwji and
  are the ith components of vwj and vwj′, respectively, and cwj and cwj′ are the aforementioned consensus weights of vwj and vwj′, respectively. Note that the similarity between vwji and
  increases as
  increases. We also define the cosine similarity between two sets of splice junctions J1 and J2, as
 that is, the cosine similarity between the sums of the weight vectors for the splice junctions in J1 and J2.
Afterward, we heuristically designed the following constrained optimization program to hunt for the potential right connections
between the incoming and outgoing splice junctions of an exon e in the VWSG. Denote by Jin and Jout, the sets of incoming and outgoing splice junctions of e, respectively, the underlying thought of the program is to partition Jin and Jout into M parts, respectively, denoted by P1, P2, .., PM and P′1, P′2, .., P′M, where there is a one-to-one correspondence between Pi and P′i (1 ≤ i ≤ M) and the cosine similarity between Pi and P′i is relatively higher, which implies that a splice junction, j, in Pi and j′ in P′i has the higher possibility of being from the same transcript. Hence, the program is designed as follows: where
where  is the minimum element in the set
  ; Jin = {j1, j2, …, jm} is the set of the incoming splice junctions of exon e, and
  is the set of the outgoing splice junctions; Pi and P′i are the subsets of Jin and Jout, respectively; ρ is a parameter between zero and one indicating that the similarity between the corresponding parts should be at least ρ;
and CP is the set of the consensus paired paths (for details, see the Supplemental Methods). Note that there could be no feasible solution for this program, as such a case indicates that we cannot split the splice
junctions associated with exon e into different parts, and we will set in this case that M = 1, P1 = Jin, and P′1 = Jout. And it is worth mentioning that in the case of S =1 (i.e., only one sample), this program does not work, because in a one-dimensional space, the cosine similarity of any two
nonzero one-dimensional vectors is always equal to one.
is the set of the outgoing splice junctions; Pi and P′i are the subsets of Jin and Jout, respectively; ρ is a parameter between zero and one indicating that the similarity between the corresponding parts should be at least ρ;
and CP is the set of the consensus paired paths (for details, see the Supplemental Methods). Note that there could be no feasible solution for this program, as such a case indicates that we cannot split the splice
junctions associated with exon e into different parts, and we will set in this case that M = 1, P1 = Jin, and P′1 = Jout. And it is worth mentioning that in the case of S =1 (i.e., only one sample), this program does not work, because in a one-dimensional space, the cosine similarity of any two
nonzero one-dimensional vectors is always equal to one.
When the above program is solved (the case in which it has an optimal solution), we split the node (exon) e into M new nodes, denoted by by e1, e2, …, eM, and the splice junctions in Pi and P′i are all incident to ei for i from one to M. We call this procedure combing exon.
Recovering transcripts by a label-setting algorithm
After combing all the exons in VWSG, we use a label-setting algorithm that is similar to the study of Niknafs et al. (2017) to recover the transcripts via taking into account the consensus weights of splice junctions and the cosine similarity between associated junctions and the consensus paired paths. The basic idea of the label-setting algorithm is to iteratively find the most highly expressed transcript from the VWSG, which is implemented as follows.
Step 1. Labeling. Suppose that the edges (junctions) in the VWSG are ordered by topological sort. Without loss of generality, we number them as 1, 2 … N. For each edge j = e → e′ (where e and e′ are two nodes (exons) in the VWSG), we denote by predecessors(j) the set of the incoming splice junctions of exon e, and by successors(j) the set of the outgoing splice junctions of node e′. Then starting from a nonderived splice junction (or a derived splice junction with its consensus weight larger than 10) j0 (j0 ∈ [1, N], and j0 has not been covered by a predicted transcript) with the largest consensus weight, the label-setting algorithm maintains two labels, MinExpj and Prej (Sucj), for the junction j ≥ j0 (≤j0); hence, we label j0 with MinExpj0 = cwj0, and Prej0 = null (Sucj0 = null). Then for each junction j from j0 + 1 to N, if predecessors(j) is not empty, choose a labeled junction j′ from predecessors(j) in the following priority order: j′ with largest MinExpj′ and j′ → j being covered by a consensus paired path; j′ with largest MinExpj′ and cs(j′, j) >ρ; or j′ with largest MinExpj′, and set MinExpj= min{MinExpj′, cwj} and Prej = j′. If none of predecessors(j) is labeled or predecessors(j) is empty, set MinExpi = null and Prej = null. For splice junction j from j0–1 to one, we use the same method to set MinExpj′ and Sucj.
Step 2. Tracing back. After all the splice junctions have been labeled, we will first extract the highest expressed transcripts based on the labels MinExp and Pre(Suc) of the junctions as follows: starting at the junction of the largest MinExp linked with the destination (origin) and extending backward (forward) based on the label Pre (Suc) until reaching j0. Then the highest expressed transcript ph in the VWSG is recovered.
Step 3. Updating VWSG. Defining cwmin as the vector weight of the splice junction with minimum consensus weight in the extended path ph, we update the weight vwj to be vwj−cwminE, where E is a vector with all its components being one. For each junction j in ph, and if a component of vwj is less than zero, we simply set it to be zero.
Repeat Step 1 to Step 3, until all the nonderived splice junctions in VWSG have been covered by the predicted transcripts. Finally, a transcript-representing path cover is obtained, which is defined as the initial meta-assembly.
Predicting a set of transcripts for each sample
After producing the initial meta-assembly, we attempt to produce a set of transcripts for each individual sample, which can be easily achieved in the VWSG based on the vector weight of each splice junction. To do so, for each path (transcript) in the initial meta-assembly, if more than half of its junctions are covered by the kth sample (i.e., the kth component in corresponding vwj is not zero), we will temporarily output it as a transcript of the kth sample. Meanwhile, we estimate the expression levels of the transcripts for the kth sample, followed by filtering the false positives that are actually the transcripts with relatively low estimated expression levels.
Generating the mature meta-assembly
Based on the estimated expression abundance of transcripts in each individual sample, we generate the final set of meta-assemblies. We assign a score that is the transcript's average estimated abundance across the samples to each transcript in the initial meta-assembly. Then we filter out the transcripts with a relatively low score. We set the filtering score as a user-friendly parameter in the TransMeta as different parameters may have different effects for data with specific characteristics. Furthermore, TransMeta automatically outputs a set of meta-assemblies with different filtering parameters.
Finally, we output both consensus meta-assembly for all the samples and a certain set of transcripts for each individual sample.
Data access
The reference genome and transcripts used for evaluating the performance of the assemblers are described in the Supplemental Notes. The description of the simulated data sets and the accession numbers for all the real data sets used in this study are in the Supplemental Notes as well. The source code for the latest version of the TransMeta package is available at GitHub (https://github.com/yutingsdu/TransMeta) and as Supplemental Code.
Competing interest statement
The authors declare no competing interests.
Acknowledgments
This work was supported by the National Key R&D Program of China with code 2020YFA0712400; the National Natural Science Foundation of China with codes 11931008, 12101368, and 61771009; the China Postdoctoral Science Foundation with code 2021M701998; and the Natural Science Foundation of Shandong Province with code ZR2021QA013. The funders had no role in study design, data collection and analysis, decision to publish, or preparation of the manuscript.
Author contributions: T.Y., X.Z., and G.L. conceived and designed the experiments. T.Y. performed the experiments. T.Y. and X.Z. analyzed the data. X.Z., T.Y., and G.L. contributed reagents, materials, and analysis tools. T.Y., X.Z., and G.L. wrote the paper. T.Y. designed the software used in the analysis. G.L. oversaw the project.
Footnotes
-
[Supplemental material is available for this article.]
-
Article published online before print. Article, supplemental material, and publication date are at https://www.genome.org/cgi/doi/10.1101/gr.276434.121.
-
Freely available online through the Genome Research Open Access option.
- Received November 24, 2021.
- Accepted June 3, 2022.
This article, published in Genome Research, is available under a Creative Commons License (Attribution-NonCommercial 4.0 International), as described at http://creativecommons.org/licenses/by-nc/4.0/.


