
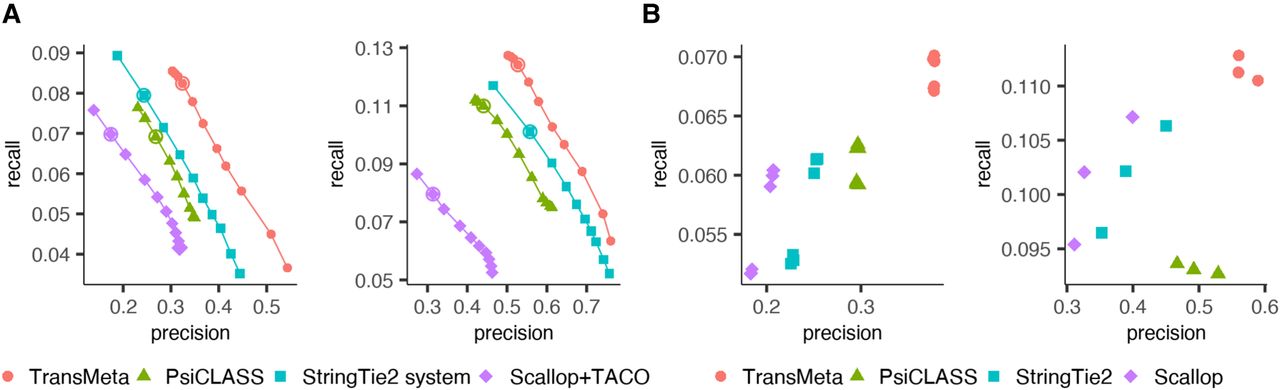
Figure 4.
Performance evaluations on the two small-scale data sets R6 and R7 under the HISAT2 alignments. (A) Precision-recall curves of the assemblers. The points on each curve correspond to the filtering thresholds of each assembler; the circled one, to the default value. (B) The precisions and recalls of the assemblers on different samples at the individual sample level under their default settings. Different colors correspond to different assemblers, and each point corresponds to a specific sample.


