
Abstract
Changes in transcriptional regulatory networks can significantly alter cell fate. To gain insight into transcriptional dynamics, several studies have profiled bulk multi-omic data sets with parallel transcriptomic and epigenomic measurements at different stages of a developmental process. However, integrating these data to infer cell type–specific regulatory networks is a major challenge. We present dynamic regulatory module networks (DRMNs), a novel approach to infer cell type–specific cis-regulatory networks and their dynamics. DRMN integrates expression, chromatin state, and accessibility to predict cis-regulators of context-specific expression, where context can be cell type, developmental stage, or time point, and uses multitask learning to capture network dynamics across linearly and hierarchically related contexts. We applied DRMNs to study regulatory network dynamics in three developmental processes, each showing different temporal relationships and measuring a different combination of regulatory genomic data sets: cellular reprogramming, liver dedifferentiation, and forward differentiation. DRMN identified known and novel regulators driving cell type–specific expression patterns, showing its broad applicability to examine dynamics of gene regulatory networks from linearly and hierarchically related multi-omic data sets.
Transcriptional regulatory networks connect regulators such as transcription factors to target genes and specify the context-specific patterns of gene expression, where context can be different cell types, cell states, developmental stages, or time points. In developmental systems, changes in regulatory networks can significantly alter the type or state of a cell, which can affect both normal and disease processes. The regulatory interaction between a transcription factor (TF) and a target gene's promoter is dependent upon TF binding activity, histone modifications, and open chromatin, which have all been associated with cell type–specific expression (Young 2011; Lee and Young 2013; González et al. 2015; Osmanbeyoglu et al. 2019). To probe the dynamic and cell type–specific nature of mammalian regulatory networks, several research groups have generated matched transcriptomic and epigenomic data from short time courses or for cell types related by a branching lineage (Wamstad et al. 2012; Lara-Astiaso et al. 2014; Chronis et al. 2017). However, integrating these data sets to infer cell type–specific regulatory networks is an open challenge.
Existing computational methods to infer cell type–specific networks while integrating different types of measurements can be grouped into two main categories: (1) regression-based methods and (2) statistical models for networks. Regression-based methods use linear and nonlinear regression to predict mRNA levels as a function of chromatin marks (do Rego et al. 2012; Dong et al. 2012) and/or TF occupancies (do Rego et al. 2012) and can infer a predictive model of mRNA for a single condition (time point or cell type). These regression approaches are applied to each context, such as a cell type, individually and have not been extended to model multiple related time points or cell types, which is important to study network transitions between different time points and cell states. Statistical models of networks constitute a large family of methods, including probabilistic graphical models (Ernst et al. 2007; Parikh et al. 2011; Roy et al. 2011; Jojic et al. 2013; Gong et al. 2015; Pierson et al. 2015; Koch et al. 2017), correlation-based methods (Langfelder and Horvath 2008), and Boolean networks (Schwab et al. 2020), used to represent molecular networks. The vast majority of these methods (Parikh et al. 2011; Roy et al. 2011; Jojic et al. 2013; Gong et al. 2015; Pierson et al. 2015; Koch et al. 2017) are based on mRNA levels and require a sufficiently large number of mRNA samples for each time point or cell type to reliably estimate the statistical dependency structure. A few methods based on dynamic Bayesian networks (DBNs), including input-output hidden Markov models (Ernst et al. 2007) and time-varying DBNs (Gong et al. 2015), have been developed to examine gene expression dynamics with static ChIP-seq data sets. However, both of these approaches are suited for time courses only and do not accommodate branching structure of cell lineages.
To systematically integrate parallel transcriptomic and epigenomic data sets to predict cell type–specific regulatory networks, we have developed a novel dynamic network reconstruction method, dynamic regulatory module networks (DRMNs). DRMNs model regulatory networks in a cell type–specific manner by leveraging their relatedness, for example, by time or a lineage. DRMNs represent the cell type–specific regulatory network by a concise set of gene expression modules, defined by groups of genes with similar expression levels, and their associated regulatory programs (regulators predicted for that module and parameters capturing the strength and type of regulation). We applied DRMNs to four data sets measuring transcriptomic and epigenomic profiles from different cellular reprogramming and differentiation studies (Xie et al. 2013; Chronis et al. 2017; Roy and Sridharan 2017; Seirup et al. 2022) to link upstream regulatory programs to gene expression states associated with changes in cell state.
Results
DRMN for integrating diverse regulatory genomic measurements to infer regulatory networks on cell lineages
We developed DRMN to represent and learn context-specific regulatory networks, where contexts can be cell types, time points, or cell states. We describe DRMNs with cell types as contexts; however, our description applies to other types of contexts as well. We assume that each context has a small number of samples (e.g., one or two) but has several types of measurements, such as RNA-seq, ChIP-seq, and ATAC-seq. DRMN is based on a module-based representation of a regulatory network, in which genes are grouped into modules and regulators are learned for each gene module. Each module, in turn, represents a discrete state of expression of the genes in the module, for example, high or low expression (Fig. 1). The module-based representation of the regulatory network of a cell type is implemented with a mixture model, each mixture component defining a gene module and a set of expression-predictive features. The predictive features define the “regulatory program” for that expression state, specifying the probability of a gene to belong to that expression state based on regulatory signals on a gene's promoter, such as sequence motifs, TF binding, and epigenomic signals. The module-based representation (Segal et al. 2003; Kundaje et al. 2007; Lee et al. 2009) enables DRMN to pool information from multiple genes to learn a predictive regulatory program and is appropriate when the number of samples per condition are too few to perform a conventional gene regulatory network inference of estimating the regulators of individual genes. DRMN uses a multitask learning framework of mixture models, one mixture model per task, which in turn corresponds to one cell type. The multitask learning framework of DRMN leverages the relationship between cell types, for example, on a lineage, to encourage similarity between the models learned for related contexts. DRMN produces two outputs: (1) a set of modules and regulators (e.g., TFs and histone marks) for each cell type, where the regulators are predictive of the expression levels of genes in a module, and (2) “transitioning gene sets” comprising genes that change their module assignment across cell types and their regulators that predict their expression levels across the cell types (Fig. 1). Using either output, we can infer a coarse regulatory network by adding edges between a regulator and genes in a module or transitioning gene set to which the regulator is connected (Methods).
Overview of dynamic regulatory module networks (DRMNs). Inputs are a lineage tree over the cell types, cell type–specific expression levels, a motif-based network, and optionally, cell type–specific features such as histone modification marks or chromatin accessibility signal. The output is a learned DRMN, which consists of cell type–specific expression state modules, their regulatory programs, and transition matrices (white–black matrices) describing the dynamics between the cell types. Expression states of individual genes can be traced on the tree to identify “dynamic” or “transitioning” genes.
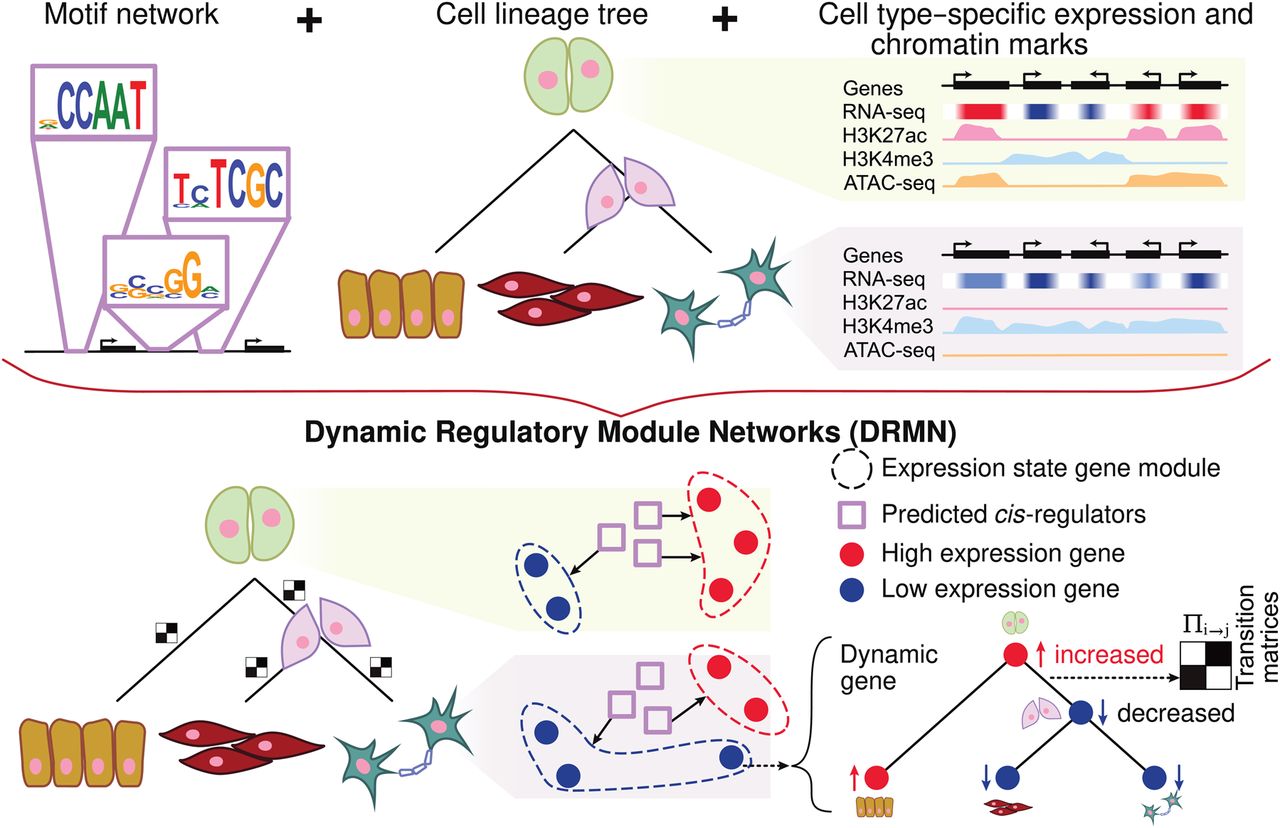
DRMN offers a flexible framework to integrate diverse regulatory genomic measurements as predictive features, such as sequence-based motif strength, accessibility, and histone marks to examine their relative contribution for explaining variation in expression. In its simplest form, DRMN uses sequence motifs and expression only. Addition of accessibility and histone marks can help capture more variation in the expression levels (Supplemental Methods; Supplemental Fig. S1). We found accessibility to be most informative when it was used together with sequence motifs (Supplemental Fig. S2).
Multitask learning is beneficial for learning cell type–specific expression patterns
We assessed the utility of DRMN's multitask learning framework by comparing against a baseline model, regulatory module network (RMN), which learned a mixture model for each context independently. We implemented two ways of multitask learning: regularized regression (DRMN-Fused) and graph structure prior (DRMN-ST) (see Methods). DRMN-ST is based on greedy structure learning of networks, whereas DRMN-Fused is nongreedy and uses regularized regression. We compared DRMN-ST to RMN-ST and DRMN-Fused to RMN-Fused. We used an array (Roy and Sridharan 2017) and a sequencing data set (Chronis et al. 2017), both studying mouse cellular reprogramming, each measuring multiple histone marks, in addition to expression and accessibility (sequencing data set only).
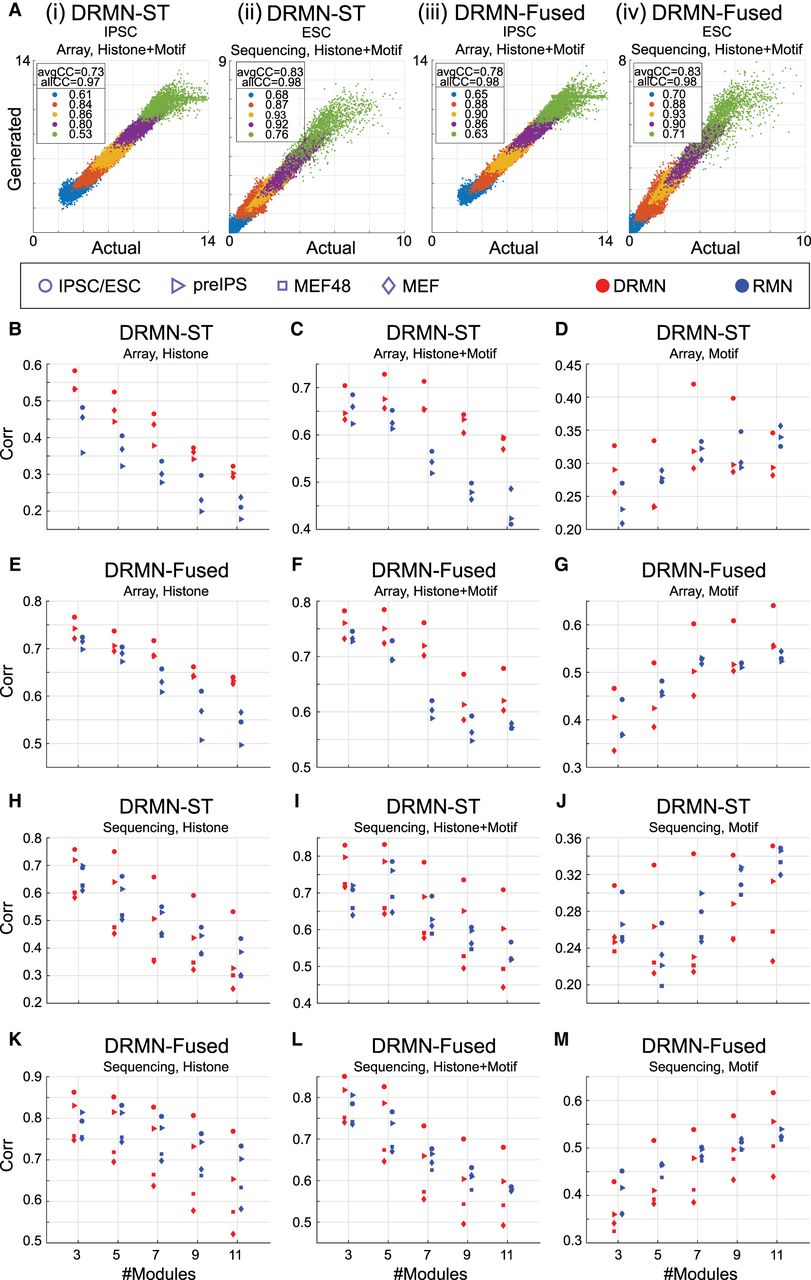
We learned DRMN and RMN models using different regulatory feature sets (Fig. 2; Supplemental Fig. S1): Motif alone (Motif), Histone marks alone (Histone), and combining Motif and Histone marks (Histone + Motif). We assessed their ability to model expression using the average Pearson's correlation of true and the generated expression of test genes based on their module, using threefold cross validation (CV) (Methods; Fig. 2A). Note that the generated expression from the model requires the actual data to determine the mixture component and therefore should be interpreted as a model fit of the observed expression (see Methods). When comparing DRMNs to RMNs on array data, both versions of DRMN outperform corresponding RMN versions on Histone and Histone + Motif features (Fig. 2B,C,E,F; blue for RMN and red for DRMN). On motifs, the difference between the models was dependent upon the cell line and the number of modules, k (Fig. 2D,G). In particular, both DRMN-Fused and DRMN-ST outperformed RMN on the induced pluripotent stem cell (iPSC)/embryonic stem cell (ESC) state and was similar for partially reprogrammed induced pluripotent stem cells (pre-iPSCs) and mouse embryonic fibroblasts (MEFs) when comparing across different k. On sequencing data (Fig. 2H–M), both DRMN-Fused and DRMN-ST were better than RMNs for most k in ESCs and pre-IPSCs when considering Histone and Histone + Motifs. When using motifs, the performance depended upon the DRMN implementation and k (Fig. 2J,M). In particular, DRMN-Fused was better than RMN for ESCs, on par for pre-iPSCs and MEF-48, and worse for MEF. DRMN-ST was on par or better than RMN-ST for k = 3, 5; however, we observed a decrease in performance in the MEF and 48 h after start of the reprogramming process (MEF48) cell lines for higher k (k = 7, 9, 11). Across all cell states, DRMN-ST and DRMN-Fused are better than or comparable to the RMN versions, with greater benefits for the array data (Supplemental Table S1), suggesting that multitask learning helps to improve the predictive power of these models. Between DRMN-Fused and DRMN-ST, DRMN-Fused was able to generally outperform DRMN-ST on different feature types and data sets (Supplemental Fig. S3) likely because it learns a sparser model (Supplemental Fig. S4). Hence, we report results of DRMN-Fused application on different data sets.
Comparing DRMN versus RMN models. (A) Predicted (generated) expression from a module versus measured (actual) expression, for iPSC/ESC, for (i) DRMN-ST on array data set, (ii) DRMN-ST on sequencing data set, (iii) DRMN-Fused on array data set, and (iv) DRMN-Fused on sequencing data set. Colors correspond to different modules. The values reported in the legend correspond to per-module correlation. (B–M) Average per-module correlation for individual cell lines as a function of different number of modules for single-task and multitask versions of the method, for DRMN-ST on array data set (B–D), DRMN-Fused on array data set (E–G), DRMN-ST on sequencing data set (H–J), and DRMN-Fused on sequencing data set (K–M). Each shape corresponds to a cell state, and each color corresponds to a different method. Note that for expression prediction, the generative models need the information about the observed expression.
We next compared DRMNs and RMNs to three baseline expression-based clustering methods: (1) GMM-Merged, which applies a single Gaussian mixture model (GMM) to a merged matrix of expression values; (2) GMM-Indep, which applies Gaussian mixture modeling per time point; and (3) ESCAROLE (Chasman et al. 2019), a nonstationary probabilistic model for expression clustering suitable for time series, which was shown to better capture expression dynamics compared to standard clustering methods (Chasman et al. 2019). We used two metrics for comparison: (1) overall correlation computed using the predicted and true expression of all genes and (2) per module average correlation computed from the correlation of true and predicted expression per module. When using overall correlation, DRMNs, RMNs, GMM-Indep, and ESCAROLE vastly outperform GMM-Merged (Supplemental Fig. S5A–F). This suggests that the gene partitions are likely different between the different cell types and that imposing a single structure for all genes, as done in GMM-Merged, misses out on the cell type–specific aspects of the data. DRMN models performed on par with RMN and GMM-Indep for most cases when using overall correlation (Supplemental Fig. S5A–F). Based on per-module correlation, DRMN and RMN models outperform the expression-based clustering methods, which is expected as these methods do not model variation in expression within each module. These results show the advantage of modeling expression as a function of upstream features in DRMN/RMN over an expression-alone approach as the learned models capture a more fine-tuned model of expression variation as a function of cis-regulatory features (Supplemental Fig. S5G–L).
DRMN accurately ranks regulators and regulatory network components across diverse developmental processes
We next compared DRMN's ability to predict regulators and coarse regulatory connections against multiple methods. For regulator prediction, we compared DRMN to DREM (Schulz et al. 2012) and regulators predicted based on motif enrichment of DRMN modules, as well as ESCAROLE modules (Fig. 3A). DREM (Schulz et al. 2012) is an input/output HMM model that also models temporal expression profile as a function of regulatory signals such as histone marks and TF binding site. We considered three dynamic processes for regulator prediction: cellular reprogramming (Chronis et al. 2017), hepatocyte dedifferentiation (Seirup et al. 2022), and early lineage specification from the ESC state (Xie et al. 2013) (Fig. 3; Methods). As gold standards, we used a literature-curated set of regulators of ESC states for the Chronis and Xie data sets and a literature-curated set of hepatocyte regulators for the Seirup data set (Methods). Note that for DREM, we did not have the cell stage–specific regulators from the command line interface, although this functionality may be available in the graphical user interface. For each method, we computed the F-score comparing the predicted regulators to the gold standards. DRMN had the highest F-score (Fig. 3A) compared to other methods. We also used area under the precision recall (AUPR) curve on the ranking of the regulators from each method. DRMN is better than enrichment across all data sets. DRMN and DREM are comparable with DRMN outperforming DREM on the Chronis data set and DREM outperforming DRMN on the Seirup data set (Supplemental Fig. S6A).
Performance of regulator ranking and inferred networks of DRMN. (A) The F-score of regulator ranking with different strategies for cellular reprogramming, mouse hepatocyte dedifferentiation, and H1ESC differentiation. Each plot shows regulator enrichment of expression-based modules (Exp + Enr), regulator enrichment of DRMN modules (DRMN + Enr), regulator ranking based on inferred DRMN networks (DRMN), and regulator ranking from DREM (when applicable). (B) F-score-based performance of inferred networks and baseline networks for cellular reprogramming, when compared to ChIP-based, perturbation-based, and intersection of the ChIP and perturbation-based gold standards in mESCs. (C) F-score-based performance of inferred networks and baseline networks for H1ESC differentiation, when compared to ChIP-based, perturbation-based, and intersection of the ChIP- and perturbation-based gold standards in hESCs. (D) F-score-based performance of inferred networks and baseline networks for mouse hepatocyte dedifferentiation, when compared to ChIP-based, perturbation-based, and intersection of the ChIP- and perturbation-based gold standards for mESCs, as well as the ChIP-based gold standard from the HepG2 cell line. In each panel, we show the baseline networks from regulator enrichment of expression-based modules (Exp + Enr), regulator enrichment of DRMN modules (DRMN + Enr), and inferred networks with edges scored by input feature multiplied by estimated regression coefficients (DRMN).
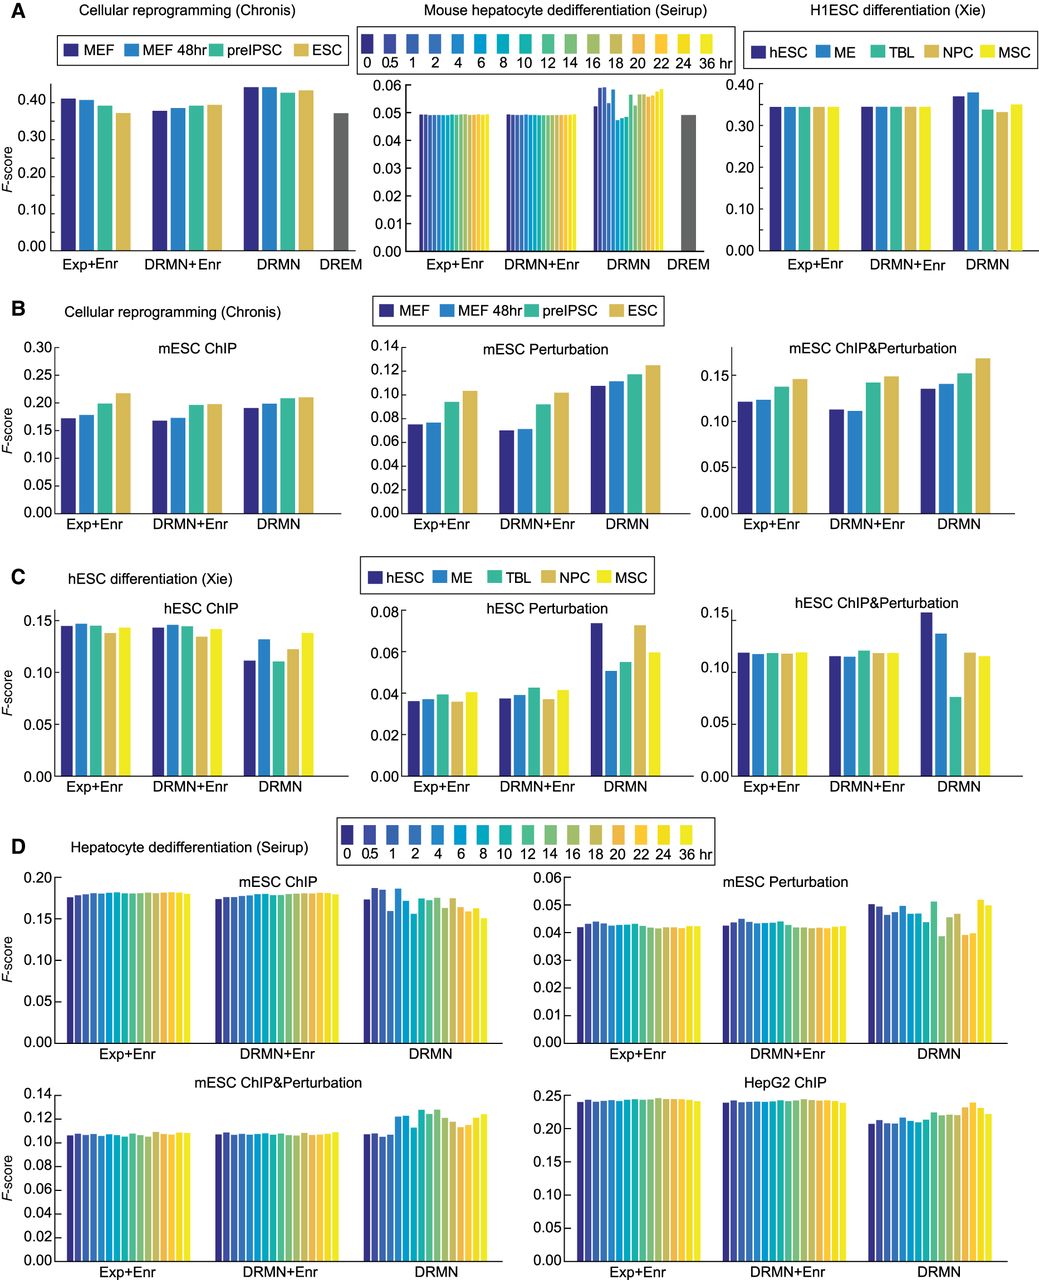
We next compared the regulatory relationships between TFs and target genes from DRMN and several base line methods that inferred regulator–target relationships based on the enriched regulators in each module (Exp + Enr, DRMN + Enr; Methods). DREM's output was not amenable for this comparison. For DRMN, regulator–target relationships were weighted by the product of the regression weight of a regulator and the feature value (Methods). For Chronis and Xie, we used the ESC regulatory network downloaded from the ESCAPE database (Xu et al. 2013), which has both perturbation (regulator knockouts or knockdowns) and ChIP-based regulator–target relationships. For Seirup, we additionally used ChIP-seq data sets in the HepG2 cell line from The ENCODE Project Consortium to derive regulatory interactions more relevant to hepatocytes (Fig. 3B–D; Supplemental Fig. S6B–D). Based on the F-score, computed on the top 50K edges, enrichment-based networks were generally worse for the perturbation and perturbation + ChIP gold standards for Chronis (Fig. 3B). The enrichment-based networks were better on the ChIP-based gold standards. A similar trend held for the Xie data set, although the difference on the perturbation networks was greater (Fig. 3C). We observed similar trends on AUPR as well (Supplemental Fig. S6B,C). For the Seirup data set, DRMN again performed better than other methods when examining the F-score on perturbation alone or perturbation + ChIP networks. Additionally, DRMN networks showed greater variation across time, which is indicative of context specificity. On HepG2, the results were similar to the ESC ChIP-based network (Fig. 3D). When using AUPR, we observed similar trends; however, the difference across methods was smaller (Supplemental Fig. S6D). These results suggest DRMN generates meaningful TF–target relationships that more accurately recapitulate perturbation-based regulatory relationships and often capture greater context-specificity than simpler enrichment-based analyses.
DRMN predicts key regulatory network components indicative of efficiency in cellular reprogramming
Cellular reprogramming is the process of converting a somatic cell type into a pluripotent cell type (Sridharan and Plath 2008). However, this process is inefficient, as a small proportion of cells reprogram into the final pluripotency state. One hypothesis for low efficiency is the incomplete suppression of the somatic regulatory program (Chronis et al. 2017). To gain mechanistic insight into the regulatory program dynamics, a number of histone marks, select transcription factor (TF) binding, accessibility, and RNA-seq measurements were profiled at four stages of reprogramming from MEFs to iPSCs. We applied DRMN to examine how TFs interact with chromatin state to drive different expression states during this process.
We first described the global transcriptome state using seven DRMN modules (1–7), each corresponding to a distinct level of expression in each of the four reprogramming stages (Fig. 4A). The modules were on average 30%–90% similar in gene content, showing the lowest similarity between MEF48 and pre-iPSC and the highest between MEF and MEF48 (Supplemental Fig. S7). This agrees with the pre-iPSC state showing a major change in transcriptional status during reprogramming. The repressed modules 1, 2, and 3 were less conserved across all cell types compared to the more highly expressed modules. Modules with high expression also showed more conserved enrichment of Gene Ontology (GO) processes compared to the repressed modules (Supplemental Table S2) and included housekeeping functions such as ribosome biogenesis and general metabolic processes. Processes that were specifically up-regulated in the iPSC and pre-iPSC stages included cell cycle, whereas muscle development and cell adhesion processes were associated with MEF and MEF48. The enrichment of up-regulated cell cycle processes in the ESC/pre-iPSC and muscle-related processes in MEF/MEF48 supports the biological relevance of our expression states.
Application of DRMNs to the cellular reprogramming sequencing data set using histone marks, accessibility, and Q-motifs. (A) Shown are gene expression (log 1 + TPM) patterns of the k = 7 modules for each cell state (major row). The number above the heatmap is the number of genes in that module. The color corresponds to the level of expression, with more red denoting high expression and more blue denoting low expression. (B) Inferred regulators for each module across time. Only modules with highest expression and that had TFs as regulators (5, 6, and 7) are shown. The red intensity is proportional to the z-score significance of the regression weight of a regulator. For all values, see Supplemental Table S6. (C) Transitioning gene sets showing changes into the high expression modules (5, 6, 7). Shown are the mean expression levels of genes in the gene set (left; red–blue heatmap), the module assignment (second), the number of genes in each module (third), and the set of regulators for each gene set (white–red heatmap). Red arrows depict gene sets discussed in the text. (D) Selected transitioning gene set C216 in the cellular reprogramming data set. The panel shows the member genes of the transitioning gene set. The columns show the module assignment of each gene, followed by its expression level in each cell state (Expression). The subsequent groups of columns are the levels of the regulator on the gene promoters. The name of the regulator is specified at the bottom of the heatmap.
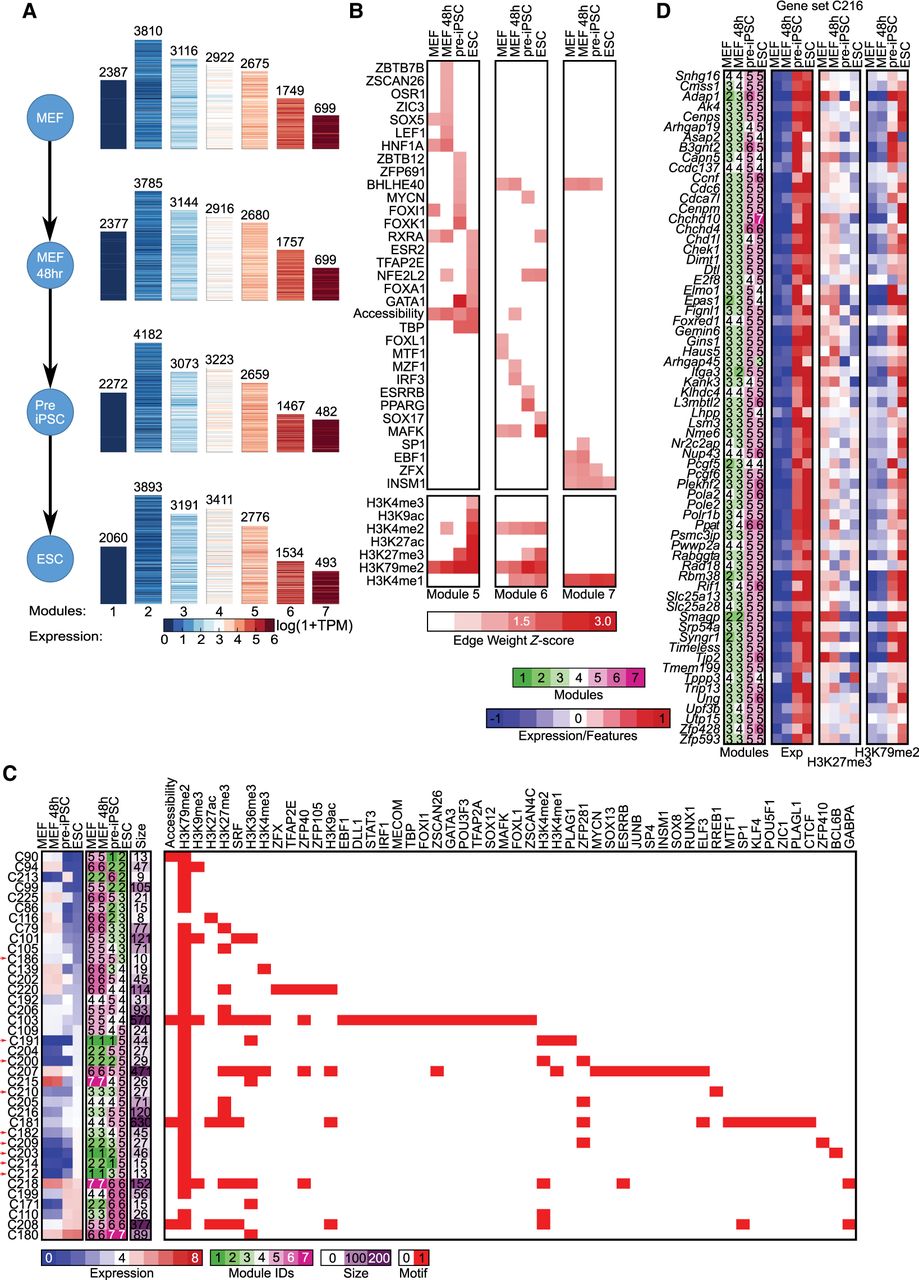
We examined the regulators for the three modules associated with highest expression (5, 6, and 7) (Fig. 4B). Histone marks (H3K79me2 and H3K4me1) and accessibility were selected as predictive features for all four cellular stages. In contrast, the TFs were selected in a more stage-specific manner with a few exceptions (e.g., INSM1 and BHLHE40), suggesting that TFs are important for the specificity of transcriptional programs. Several TFs that were predicted significant in a specific stage have known roles in that stage, for example, NFE2L2 in the ESC and pre-IPSC module 6, which is known to play an important role in the ESC state (Dai et al. 2020), and MYCN and ESRRB in the pre-IPSC module 6, which are both known to be important for early embryonic stages. ESRRB has also been shown to be important for suppressing the MEF program during reprogramming (Chronis et al. 2017). SOX17 association with ESCs was surprising because SOX17 is lowly expressed in ESCs; however, SOX17 shares motif affinity with SOX2, which could explain this association (Supplemental Fig. S8). We also found several muscle and mesodermal factors associated with MEF (FOXL1 [Miyashita et al. 2020], MTF1 [Tavera-Montañez et al. 2019] in module 6), MEF48 (OSR1 [Vallecillo-García et al. 2017], LEFTY1 [Phan et al. 2020] in module 5), and both MEF and MEF48 (SOX5 in module 5) (Ikeda et al. 2002). The regulators were expressed in the cell states they were selected for prediction with the exception of FOXI1 (Supplemental Fig. S9A). For FOXI1, we found other members of the Forkhead box family to be expressed (Supplemental Fig. S9B).
Finally, we leveraged the DRMN modules to identify transitioning gene sets and their regulators, which can inform us about specific pluripotency and somatic expression programs that change during reprogramming (Methods). In total, we identified 85 gene sets with their predicted regulators (see Methods; Supplemental Table S3; Supplemental File S1). We focused on 42 gene sets with transitions into the high expression modules 5, 6, or 7, as these indicate the strongest up-regulated expression states during reprogramming (Fig. 4C). These gene sets showed two main types of dynamics (Fig. 4C; Supplemental Fig. S10): (1) repressed in MEF/MEF48 and induced in ESC/iPSC (C216, Fig. 4D) and (2) induced in MEF/MEF48 and repressed in ESC/iPSC (e.g., C101, C220) (Supplemental Fig. S10A,B). The majority of these gene sets were predicted to be regulated by a combination of TFs and histone marks. Notably, nine gene sets (C186, C191, C200, C210, C182, C209, C203, C214, C212) (Fig. 4C, red arrows) showed repressed expression in all but ESCs (e.g., C191, C200, C203) (Supplemental Fig. S10C,D,G). In contrast, there were only two gene sets, C225 and C186 (Supplemental Fig. S10E,F), that showed an opposite expression signature of repressed in ESCs and induced in the other cell stages. Although these gene sets showed a similar trend of expression, they were associated with different sets of regulators, which include a combination of elongation, promoter and repressive marks, and distinct TFs (e.g., PLAG1 in C191, ZFP281 in C200, BCL6B in C203). Several of the regulators have known regulatory roles in pluripotency and development, for example, ZFP281 (Fidalgo et al. 2011); PLAG1, which is involved in cancer and growth processes and was shown to effect embryonic development (Madissoon et al. 2019); and BCL6B, which reduces reprogramming efficiency (Zhang et al. 2018). These gene sets can also provide clues into factors governing reprogramming efficiency as they retain a somatic MEF-like state in the pre-iPSC stage.
Using DRMN to gain insight into regulatory program dynamics across a long time course
The reprogramming study showed DRMN application to a short time course (three to four time points). We next tested the ability of DRMN to analyze temporal dynamics of a longer 16 time point data set measuring transcriptomic and accessibility profiles during hepatocyte dedifferentiation (Seirup et al. 2022). This data set also showed DRMN application when only accessibility and gene expression are measured. Dedifferentiation of primary cells such as liver hepatocytes is a major challenge in studying normal liver function, as well as for liver-related diseases (Elaut et al. 2006). Dedifferentiation could be due to the changes in the regulatory program over time; however, little is known about the transcriptional and epigenetic changes during this process. We applied DRMN to this data set to characterize the transcriptional dynamics and predict regulators associated with major changes in expression.
Using DRMN, we partitioned the genes into five levels of expression (1–5) at all time points (Fig. 5A). Comparison of module assignments across time showed that module 1, associated with lowest expression was most conserved across time points, whereas modules 2, 3, and 4, showed transitions happening between 4 and 6 h and 14 and 16 h (Supplemental Fig. S11). The relatively high conservation of the repressed module 1 was in contrast to DRMN modules from the reprogramming study, where it was least conserved. The repressed state was enriched for developmental processes (Supplemental Table S2), whereas the other modules were enriched for diverse metabolic processes. Modules 4 and 5, which are associated with induced expression, are enriched for more liver-specific metabolic function such as coenzyme metabolism and acetyl CoA metabolism, and modules 2 and 3 were enriched for general housekeeping function such as nucleic acid metabolism. We next examined the regulators associated with each module predicted by DRMN (Fig. 5B), which we previously showed to be more relevant to liver state than simpler enrichment-based methods (Fig. 3A). Focusing on the highly expressed modules (3, 4), we found several liver factors, for example, NFKB (Luedde and Schwabe 2011), FOXK1, FOXK2 (Le Lay and Kaestner 2010; Sakaguchi et al. 2019), ONECUT2 (Clotman et al. 2005; Laudadio et al. 2012), and LHX9 (Rétaux et al. 1999), that are likely important for maintenance of the hepatocyte state (Fig. 5B). In addition, we found several regulators involved in cell fate decision making, for example, TCF3 (Cole et al. 2008) and SMAD2 (Uemura et al. 2005). The cell fate regulators are enriched in the later part of the time course, indicating their potential roles in dedifferentiation. As before, we verified that the regulators were expressed in the time point they were selected; in several cases, one or more members of the same family for the motif were expressed (Supplemental Fig. S12).
Application of DRMNs to the hepatocyte dedifferentiation data set using accessibility and Q-motifs. (A) Shown are gene expression (log 1 + TPM) patterns of the k = 5 modules for each time point (major row). The number above the heatmap is the number of genes in that module. The color corresponds to the level of expression, with more red denoting high expression and more blue denoting low expression. (B) Inferred regulators for each module across time. Only modules with highest expression and that had TFs as regulators (3 and 4) are shown. The red intensity is proportional to the z-score significance of the regression weight of a regulator. For all values, see Supplemental Table S6. Bolded names are those discussed in the text. (C) Transitioning gene sets showing changes into the high expression modules (3, 4, 5). Shown are the mean expression levels of genes in the gene set (left; red–blue heatmap), the module assignment (second), the number of genes in each module (third), and the set of regulators for each gene set (white–red heatmap). Red arrows depict gene sets discussed in the text. Some of the regulator names were shortened for space; the full names are available in Supplemental File S7. (D,E) Selected transitioning gene sets in the hepatocyte dedifferentiation data set. Each panel shows the member genes of a transitioning gene set (label on top). The columns show the module assignment of each gene, followed by its expression level in each cell type (Expression). The subsequent groups of columns are the levels of the regulator on the gene promoters. The name of the regulator is specified at the top of the heatmap. All significant regulators are shown.
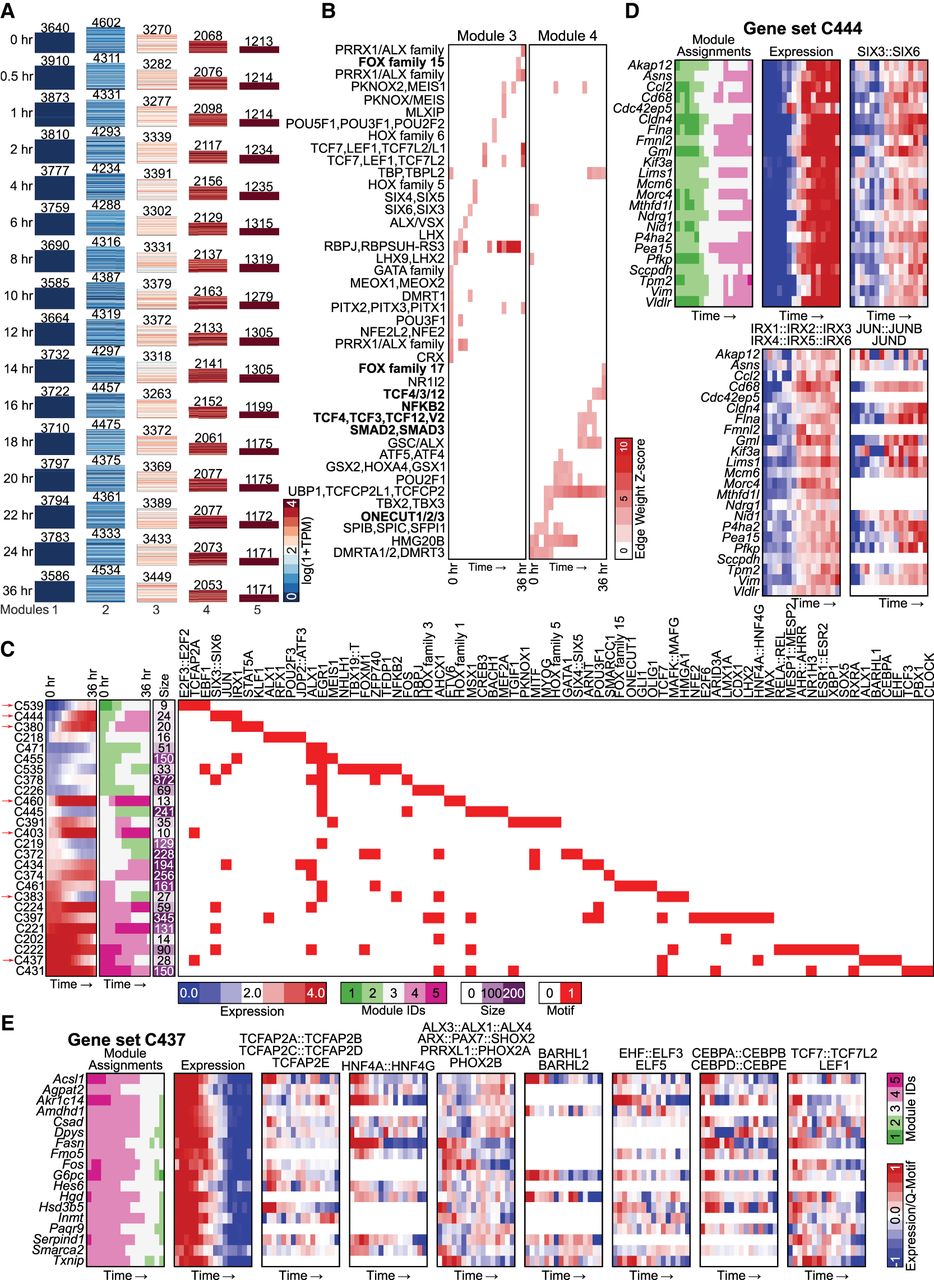
To gain insight into fine-grained transition dynamics and the regulators driving these dynamics, we again used the DRMN module assignments to identify genes that transition from one module to another as a function of time. We identified 84 gene sets with predicted regulators at ≥60% confidence (Methods; Supplemental File S1). We focused on those gene sets with a transition into modules 3, 4, and 5 and identified a total of 25 gene sets with varying types of transitions (Fig. 5C). Many of the transitions were between modules that are adjacent to each other based on expression levels, suggesting that the majority of the dynamic transitions are subtle (e.g., module 4 and 5). Several of these gene sets showed a gradual up-regulation of expression, for example, C444 (Fig. 5D), C380, C539, C403, and C460 (Supplemental Fig. S11B–E), exhibiting transitions at 4 and 6 h, which coincided with the largest changes in module assignment. Regulators associated with these gene sets included liver-specific (JUN [C444], STAT5A and STAT5B [C380]) or developmental regulators (IRX1 [C380, C444] [Yu et al. 2017], SIX6 [C444] [Diacou et al. 2018], and KLF family [C380]). We also identified gene sets with down-regulation of expression, for example, C437 (Fig. 5E) and C383 (Supplemental Fig. S11F). Key regulators included hepatocyte nuclear factors, HBF4G, HNF4A, CEBPA (C437), the EGR family, as well as several components of Wnt NF-kB signaling pathways (C383). Early growth response (EGR) factors have been shown to play important roles in different liver-related functions including repair and injury (Magee and Zhang 2017) that have been implicated in liver-specific function (Rudraiah et al. 2016). To summarize, liver-related regulators were associated with both up- and down-regulated genes; however, up-regulated genes were additionally associated with developmental regulators. These predictions implicate relevant regulators in liver cell fate maintenance and offer avenues for functional validation studies to understand dedifferentiation.
DRMN application to find regulators of lineage-specific expression on hierarchical lineages
To show the utility of DRMN on hierarchically related cell lineages, we considered a data set profiling early differentiation of human embryonic stem cells (hEMSCs; H1) into four lineages: mesendoderm, mesenchymal, neural progenitors, and trophoblast (Xie et al. 2013). In addition to accessibility, this data set measured eight different histone marks: H3K4me1, H3K4me2, H3K4me3, H3K27ac, H3K9ac, H3K79me2, H3K36me3, and H3K27me3. We applied DRMN to this data set and identified genes at five major levels of expression, 1–5, with 1 representing the lowest expression and 5 the highest (Fig. 6A). The extent of gene conservation depended on the expression level, with states 1 and 2 showing low conservation and modules 3 and 4 showing high conservation (Fig. 6B). The low conservation of states 1 and 2 is consistent with our observations in the reprogramming study. GO process enrichment showed that the repressed module is enriched for developmental- and lineage-specific functions, whereas the induced modules tended to be enriched for cell cycle– and translation-related processes (Supplemental Table S2). The most repressed genes showed the largest extent of cell type–specific enrichments, whereas the induced state was enriched for similar processes.
Application of DRMNs to ESC differentiation data set using histone marks, accessibility, and Q-motifs. (A) Shown are gene expression (log 1 + TPM) patterns of the k = 5 modules for each lineage (major row). The number above the heatmap is the number of genes in that module. The color corresponds to the level of expression, with more red denoting high expression and more blue denoting low expression. (B) Similarity of modules across lineages as measured by Jaccard index. The color intensity is proportional to the module match. (C) Inferred regulators for each module across time. Only modules with highest expression (3 and 4) and that had TFs as regulators are shown. The red intensity is proportional to the z-score significance of the regression weight of a regulator. For all values, see Supplemental Table S6. (D) Selected transitioning gene set profiles showing changes into the high expression modules (3, 4, 5). Shown are the mean expression levels of genes in the gene set (left; red–blue heatmap), the module assignment (second), the number of genes in each module (third), the set of regulators for each gene set (white–red heatmap), and enrichment in lineage-specific gene sets from Xie et al. (2013). The complete transitioning gene set is shown in Supplemental Figure S14. Some of the regulator names were shortened for space; the full names are available in Supplemental File S7. Bolded names are those discussed in the text.
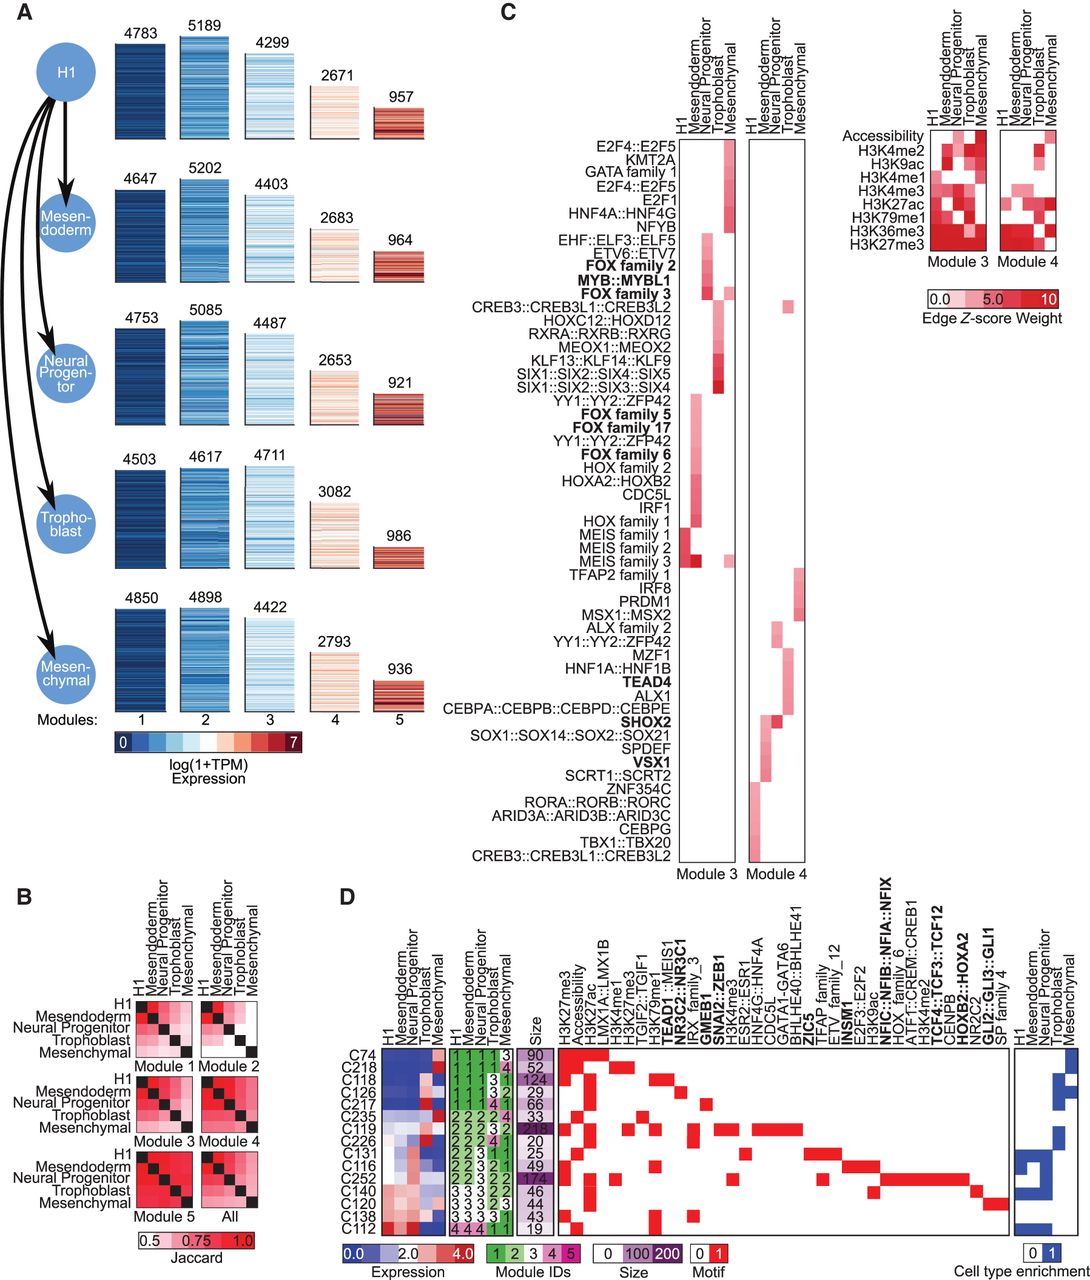
We next examined the regulators selected by DRMN, focusing on the two highly expressed modules, 3 and 4 (5 was associated only with histone marks). We verified that the regulators were expressed in the corresponding lineage they were selected; in several cases, one or more members of the same family were expressed (Supplemental Fig. S13). Similar to the reprogramming study, histone mark associations were more conserved across cell types than TFs, with the elongation mark, H3K36me3, and repressive mark, H3K27me3, being among the most conserved marks across cell types. Among the TFs associated with each module, several have known lineage-specific roles (Fig. 6C). For example, we found several neuronal lineage regulators including FOX (Ferri et al. 2007) and MYB (Malaterre et al. 2008) proteins in module 3 of the neural progenitor cell type, and VSX1 (Francius et al. 2016) and SHOX2 (Scott et al. 2011) in mesendoderm module 4. Similarly, TEAD4, a regulator important for trophoblast self-renewal (Saha et al. 2020), was associated with Trophoblast module 4.
We used the DRMN results to examine fine-grained regulatory dynamics of early lineage specification. We focused on 72 gene sets transitioning into the high expression modules, 3, 4, and 5 for which we could predict regulators with high confidence (Methods; Fig. 6D; Supplemental Fig. S14). These gene sets showed up-regulation in a single lineage (C74, C131) (Supplemental Fig. S15A,B), as well as in multiple lineages (C112 and C138) (Supplemental Fig. S15C,D). Xie et al. (2013) independently identified lineage-specific genes based on mRNA levels. The majority of our gene sets with lineage-specific expression pattern have a significant overlap with the Xie et al. (2013) gene sets. For example, gene sets C74, C218 (Supplemental Fig. S15A,E), and C235 (Supplemental Fig. S15F) included genes that were repressed in all but the mesenchymal state and were enriched for Xie et al. (2013) lineage-specific genes for the mesenchymal state (Supplemental Fig. S14). We see similar results for gene sets with trophoblast (C226) (Supplemental Fig. S16A) and neural progenitor up-regulation (C131, C116) (Supplemental Figs. S15B, S16B). The enrichment in the lineage-specific gene sets from Xie et al. (2013) was a useful corroboration of our study; in addition, we predicted TFs for several of these gene sets. In particular, gene sets associated with the neural progenitor cell state were predicted to be regulated by relevant regulators such as INSM1 (C116), ZIC5 (C131), NFIX (Heng et al. 2014), HOXA2, HOXB2 (Davenne et al. 1999), and TCF4 (all associated with C252) (Fig. 6D; Wittmann and Häberle 2018). Similarly for the trophoblast-associated gene sets, we predicted TEAD1 (C118), GMEB1 (C217), SNAI2 (C119), and NR3C2 (C126), as among the regulators (Fig. 6D). TEAD1, which is a member of the Hippo signaling pathway, is expressed in placental cells (Soncin and Parast 2020). GMEB1 and NR3C2 are involved in glucocorticoid signaling, which is implicated in the development of the placenta (Kisanga et al. 2018). SNAI2 is a regulator of the epithelial–mesenchymal transition (EMT), which is a key process in trophoblast development. Finally, we examined regulators of gene sets showing up-regulation in multiple lineages (e.g., C120, C140) (Supplemental Fig. S16C,D) and found these regulators are involved in multiple developmental lineages (e.g., GLI1) (Hui and Angers 2011). Taken together, DRMN predicted key TFs associated with lineage-specific patterns of expression, expanding on the Xie et al. (2013) study which focused primarily on histone modifications. Several of these regulators are known to be involved in these specific lineages, whereas others are novel predictions participating in relevant pathways that can be followed with future functional studies.
Discussion
Cell type–specific gene expression patterns are established by a complex interplay of multiple regulatory levels, including TF binding, genome accessibility, and histone modifications. To gain insight into regulatory network dynamics associated with cell type–specific expression patterns, time course and lineage-aware data sets measuring transcriptomes and epigenomes of a dynamic process are becoming increasingly available (Wamstad et al. 2012; Xie et al. 2013; Lara-Astiaso et al. 2014; Chronis et al. 2017; Bunina et al. 2020). Analyzing these data sets to identify the underlying gene regulatory network dynamics that drive context-specific expression changes is a major challenge. This is because of the large number of variables measured in each context (time point or cell type), but low sample size for each context. In this work, we developed DRMN, which simplifies genome-scale regulatory networks from individual genes to gene modules and infers regulatory program for each module in all the input conditions. DRMN offers a flexible framework to integrate a variety of regulatory genomic signals. In its simplest form, DRMN can be applied to expression data sets with sequence-specific motifs to learn a predictive regulatory model. In its more general form, DRMN can integrate a variety of regulatory signals such as genome-wide chromatin accessibility, histone modification, and TF profiles measured using sequencing and array technologies. Furthermore, DRMN is applicable to data sets of different experimental designs such as short time series (e.g., the reprogramming study), long time series (e.g., the hepatocyte dedifferentiation study), and hierarchically related cell types on lineages (e.g., in the cellular differentiation study).
Central to DRMN's modeling framework is joint learning of predictive regulatory programs for each cell type or time point by using multitask learning. Using two different approaches to multitask learning, we show that joint learning of regulatory programs is advantageous compared to an approach of learning regulatory programs independently per condition. Although a few models handle multiple regulatory signals over time, they are based entirely on clustering of multiple signals in given loci (Ernst et al. 2011; Roy and Sridharan 2017). Predictive modeling of expression that also clusters genes into expression groups is more powerful than clustering expression alone, including approaches that explicitly model temporal and hierarchical relationships across data sets. Such models are able to capture fine-grained expression variation as a function of the upstream regulatory state of a gene.
We applied DRMNs to distinct types of dynamic processes that involved cell fate transitions: mouse reprogramming from a differentiated fibroblast cell state to a pluripotent state (three to four cell states), hepatocyte dedifferentiation (16 time points), and forward differentiation of hESCs to different lineages (five cell types). When compared across processes, the repressed modules were least conserved in the reprogramming and differentiation study, whereas it was most conserved in the dedifferentiation study. Accordingly, biological processes were repressed in a cell state–specific manner in the reprogramming and forward differentiation study, whereas we saw a common down-regulation of developmental processes in the hepatocyte dedifferentiation data set. Furthermore, there were greater changes in expression in the reprogramming time course compared to dedifferentiation, indicating the difference in magnitude of change in the two processes. Using DRMN transitioning gene sets, we asked specific questions tailored to the process under study. In the reprogramming study, we investigated transitioning genes that could inform us about the incomplete repression of the somatic program (Sridharan and Plath 2008; Chronis et al. 2017), which is considered a major barrier in reprogramming efficiency and identified previously implicated, as well as novel, TFs that can be followed up with perturbation studies. In the dedifferentiation study, we predicted a combination of developmental- and liver-specific regulators associated with genes induced or repressed as a function of time. Finally, in the forward differentiation study, we identified lineage-specific genes, many of which had significant overlap with the original study (Xie et al. 2013) and predicted several TFs in addition to histone modifications as important regulators for the neural and trophoblast lineages. By identifying TFs associated with different trends of expression, we expanded on these previous studies which largely focused on the epigenome dynamics. These predictions offer testable hypothesis of regulators driving expression dynamics in cell fate transitions.
The DRMN model can be extended in several directions. One direction of future work would be to incorporate ATAC-seq signal from more distal regions by using genome-wide chromosome conformation capture assays (de Wit and de Laat 2012; Gorkin et al. 2014; Fraser et al. 2015), as well as computational long-range predictions (Whalen et al. 2016; Zhang et al. 2019). Another direction would be to use more generic sequence features, such as k-mers (Setty and Leslie 2015) or deep learning models (Avsec et al. 2021), to enable the discovery of novel regulatory elements and offer great flexibility in capturing sequence specificity and its role in predictive models of expression. DRMN's predictive model often selected elongation marks such H3K36me3 as good predictors of expression. However, these could represent downstream transcriptional processes rather than upstream regulatory processes. Explicit modeling of the dependency structure among the regulatory features could assist with discriminating regulatory signals that are upstream of versus downstream from expression. DRMN relies solely on the sequence specificity of a TF when linking to a module, which might not be sufficient to distinguish between paralogous TFs. Incorporation of the TF's expression level might be beneficial to distinguish between multiple TFs with similar sequence specificities.
In conclusion, DRMN offers a powerful and flexible framework to define context-specific gene regulatory programs from time series and hierarchically related regulatory genomic data sets. As additional data sets that profile epigenomic and transcriptomic dynamics of specific processes become available, methods like DRMN will become increasingly useful to examine regulatory network dynamics underlying context-specific expression.
Methods
DRMN model description
We define a RMN as the set of modules and their regulators of any one condition (e.g., cell types, time points). DRMN is a collection of RMNs, one for each condition related by time or a lineage tree. In our description below, we assume we have a set of related cell types; however, the same description applies to multiple time points or related conditions.
RMN
An RMN Rc for cell type c is denoted by the tuple 〈Gc, Θ c〉. Gc is a bipartite graph specifying the edges between F features and K modules, and Θ c are the parameters of the regulator programs for each module that relate the selected regulatory features to the expression of genes in the module. In RMN, each cell type's data are modeled independently, and we optimize the posterior probability of each cell type c’s model, defined as P(Rc|Xc, Yc), which is proportional to P(Xc|Yc, Rc)P(Rc). Here Xc is the expression data for cell type c, Yc is an N × F matrix, with the gth row Yc(g, :) specifying the values of F features for gene g. RMN models each gene g’s expression in c, Xcg, as a mixture model as follows:
Here, Mcg = i denotes the module/mixture component, f = 0 corresponds to the bias term, are the features associated with component i, and Fci denotes the number of columns of . The data likelihood for each cell type c is . For details, see Supplemental Methods.
DRMN
The DRMN model is defined by a set of RMNs, R = {R1, · · · , RC}, linked via the lineage tree τ over C cell types. The posterior probability of the model given the data is . Based on the Bayes rule, this can be rewritten as P(X1, · · · , XC|R1, · · · , RC, Y1, · · · , YC)P(R1, · · · , RC). In DRMN, we model the expression of a gene g across all cell types together. The data likelihood is defined as
Given the module assignments, Mcg, the gene expressions across cell types are independent of each other. Hence the probability of g’s expression across all cell types is
Using the tree structure, we assume that the module assignment in a cell type c, Mcg is independent of everything else, given its parent pa(c) = c′ in τ, which allows efficient computation of P(M1g, · · · , MCg|τ) using pairwise conditional distributions, . P(Xcg|Mcg, Rc, Yc(g, :)) is computed in the same way as Equation 1. is obtained from the transition probabilities. P(R|τ), specifies a prior over the structure/feature sets in each of the cell type–specific RMN models, Rc. The former controls what sets of features get associated with each module i, and how they change over time. We used two formulations for the former to enable sharing information: DRMN-ST defines a structure prior over the graph structures P(G1, …, GC), whereas DRMN-Fused uses a regularized regression framework and implicitly defines priors on P(Θ 1, · · · , Θ C). In both frameworks, we share information between the cell types/conditions to learn the regulatory programs of each cell type/condition. For details, see Supplemental Methods.
DRMN learning
DRMNs are learned by optimizing the overall DRMN likelihood (Equation 2), using an expectation maximization (EM) style algorithm that searches over the space of possible graphs for a local optimum (Algorithm 1) (Supplemental Methods). In the maximization (M) step, we estimate transition parameters (M1 step) and the regulatory program structure (M2 step). In the expectation (E) step, we compute the expected probability of a gene's expression profile to be generated by one of the regulatory programs. The M2 step uses multitask learning to jointly learn the regulatory programs for all cell types using either the framework of DRMN-ST or DRMN-Fused. DRMN typically converges between the first 15–20 iterations (Supplemental Fig. S17).
Identification of transitioning gene sets and their regulators
A transitioning gene is a gene whose module assignment changes in at least one time point/cell type. We grouped the genes into transitioning gene sets using a hierarchical clustering approach with city block as a distance metric and 0.05 as a distance threshold. We developed two strategies for selecting regulators for transitioning gene sets: simple linear regression for short time courses (with five or fewer time points or conditions) and multitask group LASSO (MTG-LASSO), which is suitable for longer time courses. Both approaches take as input a list of genes from a transitioning set and predict the regulators that explain the variation in expression over time. The simple linear regression approach used the MERLIN algorithm (Roy et al. 2013) to find regulators that can explain the overall variation in the expression of genes in the set. The MTG-LASSO approach used a multitask regression framework that performs multiple regression tasks, one for each gene in the set, to select regulatory features as predictors for each gene's expression levels. Once regulators were selected using either approach, we filtered the predicted regulators per gene set by assessing the correlation of the regulator/feature with the gene expression of a gene across the conditions and included a regulator if it was correlated to at least five genes with a Pearson's correlation of 0.6 or higher. For more details, see Supplemental Methods, “Predicting regulators for transitioning gene sets” section.
Evaluating the ability to model expression
We assessed the ability of DRMN to model expression based on the ability to capture variation in expression compared to previous expression clustering methods: simple expression clustering (GMM-Indep, GMM-merged), time point aware expression clustering (ESCAROLE) (Chasman et al. 2019), and single-task learning methods (RMN-ST and RMN-Fused). We compared the methods using threefold cross validation (CV). Briefly, we split the data set along the gene dimension into three parts, each part comprising the expression data and features across conditions for genes in that part. We used each part as a test set and trained a model on the remaining two parts. We used the trained model to generate predictions on the test set as follows. Let h denote the index of a test gene in cell type c with measured expression value Xhc, and let Yc(h, :) be its feature values. As the DRMN, RMN, and GMM models are all based on a mixture model, we do not know which component of the mixture generated the expression. Therefore, we instead first obtain the mixture component with the highest likelihood of generating the expression:
Evaluation of predicted regulators and TF–target gene networks
We evaluated DRMN outputs of regulators and TF–target relationships against multiple baseline methods (Fig. 3; Supplemental Fig. S6). For regulator prediction comparison, we examined two enrichment-based approaches (regulator enrichment on ESCAROLE modules and DRMN modules), and DREM 2.0 (v2.0.3) (Schulz et al. 2012), which infers regulatory models of gene regulation from time-series data using an input/output HMM approach. To rank DRMN regulators, we computed change in prediction error after removing a regulator and used this as a score for the importance of the regulators. For each module, we performed fivefold CV to predict the expression of the module as a linear function of regulators selected for that module. Next, we recalculated the prediction error after removing a regulator. The total change in prediction error of each regulator across all modules was used for ranking the regulators. For the enrichment baseline approaches, we tested modules from DRMN or ESCAROLE for enrichment of motif instances and used −log of FDR-corrected P-values of a hypergeometric test (summed over modules) as a score for ranking regulators. These approaches were applied to the Chronis et al. (2017) reprogramming, Xie et al. (2013) forward differentiation, and Seirup et al. (2022) hepatocyte dedifferentiation data sets.
To rank DREM regulators, we first applied DREM to the Chronis et al. (2017) reprogramming and the Seirup et al. (2022) hepatocyte dedifferentiation data sets because of their temporal nature. For both data sets we gave DREM as input: (1) normalized and log-transformed gene expression matrices and (2) binarized Q-motif feature data in the required input format for DREM. To binarize the features, values above the genome-wide average were set to one and values below set to zero. DREM was applied to these data sets with recommended default settings from the command line. To obtain a ranking of features, we used the absolute value of the regression weights of the features provided in the output regulatory state model of DREM; if a feature was selected more than once, we used the sum of the absolute value. The ranking was used for computing the AUPR curve. In addition, we also selected a subset of regulatory features with a coefficient of magnitude >0.001 in at least one inferred regulatory state model and used this set for the F-score (Fig. 3; Supplemental Fig. S6). Note, we did not have the information of which regulatory state model is associated with which cell stage–specific regulators in v2.0.3, although this functionality may be available in the graphical user interface in other versions of DREM.
We asked how well the predicted regulators recover known regulators associated with a specific cell type based on the F-score and AUPR. For the reprogramming and the H1ESC differentiation data set, we used a list of genes associated with the ESC state as a gold standard (Supplemental Table S4; Supplemental File S2). This list was created using genes assigned to the GO terms “regulation of embryonic development” and “embryonic organ development” and gene lists from Müller et al. (2008) and Wong et al. (2008) listed in MSigDB (Subramanian et al. 2005). For the hepatocyte dedifferentiation data set, we used a list of important regulators collected from literature (Kyrmizi et al. 2006; Odom et al. 2006; Sheaffer and Kaestner 2012; Wangensteen et al. 2015; Velazquez et al. 2021). Note that in the Sierup et al. (2022) and Xie et al. (2013) data sets, Q-motif features were named with Cis-BP (Weirauch et al. 2014) motif IDs. Before comparison with the gold standard regulators, these IDs were converted to common names of the TFs. The Q-motif features for the Chronis et al. (2017) data were already mapped to common regulator names. We used the AUCCalculator Java package to calculate AUPR (Davis and Goadrich 2006).
For regulator–target network comparison, we compared DRMN to two baseline approaches: enrichment of regulators in ESCAROLE modules and enrichment of regulators in DRMN modules (Supplemental Table S5). For the enrichment methods, we created a network by mapping regulators associated with a module (by enrichment) to all genes in the module and scored edges by the feature values. For DRMN, we scored edges by the input Q-motif value multiplied by estimated regression coefficients. As gold standards, we used ChIP and regulator perturbation-based (knockdown and knockout of regulators) interactions from the ESCAPE database (Xu et al. 2013), which provides these interactions in hESCs and mESCs. We also added ChIP-based interactions identified in mESCs and hESCs from The ENCODE Project Consortium (The ENCODE Project Consortium 2012), as well as additional regulator–perturbation interactions identified in Nishiyama et al. (2009, 2013) and Correa-Cerro et al. (2011). For mouse hepatocyte dedifferentiation, we additionally used ChIP-based interactions from the HepG2 cell line from The ENCODE Project Consortium. We compared the networks based on AUPR and F-score on the top 50K edges from each approach. The gold standard regulators and networks are available as Supplemental File S2.
Application of DRMN to different data sets
We applied DRMN to four different data sets profiling three dynamic processes: (a) a microarray time course data set of cellular reprogramming from MEFs to iPSCs, (b) a sequencing time course data set using the same system as (a), (c) a sequencing time course data set profiling dedifferentation of hepatocyte cells, and (d) differentiation of H1ESC cells to different lineages. Below, we describe the data set processing, feature generation, hyperparameter selection, and analysis of transitioning gene sets.
Reprogramming array data
This data set measures gene expression and eight chromatin marks in three cellular stages: MEFs, pre-iPSCs, and iPSCs collected from multiple publications (Maherali et al. 2007; Sridharan et al. 2009, 2013; Roy and Sridharan 2017) (NCBI Gene Expression Omnibus [GEO; https://www.ncbi.nlm.nih.gov/geo/] accession number GSE97222). The expression values of 15,982 genes were measured by microarray. Eight chromatin marks were measured by chromatin immunoprecipitation followed by promoter microarray (ChIP-on-chip). For each gene promoter, each mark's value was averaged across an 8000-bp region associated with the promoter. The chromatin marks included those associated with active transcription (H3K4me3, H3K9ac, H3K14ac, and H3K18ac), repression (H3K9me2, H3K9me3, H3K27me3), and transcription elongation (H3K79me2). We considered the following set of features: Motif, Histone, and Histone + Motif. We used the motif collection available with the PIQ software (Sherwood et al. 2014) from https://bitbucket.org/thashim/piq-single/src/master/, which was sourced from multiple databases (Matys et al. 2003; Sandelin et al. 2004; Berger et al. 2006). From the full motif list, we used only those annotated with TF proteins (Ravasi et al. 2010), resulting in a total of 353 TFs. We used FIMO to find motif instances using the mm9 mouse genome (Grant et al. 2011). Motif instances for the same TF were further aggregated into a single feature per gene by selecting the most significant motif instance based on P-value. This resulted in a total of 353 dimensions for the Motif feature.
To determine suitable range of the number of modules we used a visual inspection of the modules, the silhouette index, and overall predictive power. We computed the silhouette index on expression-alone modules from ESCAROLE runs, visualized the expression heatmaps to assess the overall expression states, and found k = 5 or k = 7 to be most appropriate (Supplemental Fig. S18). To determine the hyperparameter settings, we performed a grid search with threefold CV on a range of values for ρ1 (sparsity in each task), ρ2 (selection of similar features for closely related cell types), and ρ3 (selection of similar features for all cell types): ρ1 ∈ {0.5, 1, 2, 5, 10, 20, 30, 40, 50, 60, 70, 80, 90, 100, 110, 120, 130}, ρ2 ∈ {0, 10, 20, 30, 40, 50}, and ρ3 = {0, 10, 20, 30, 40, 50} (Supplemental Fig. S19; Supplemental Methods). We focused on k = 7 as it gave visually distinct patterns of expression (Supplemental Fig. S20) and had a comparable predictive power to k = 5. The top five hyperparameter configurations were {(50, 50, 30), (50, 10, 30), (90, 10, 0), (40, 40, 50), (30, 50, 50)}. Inspection of the heatmaps of DRMN modules showed that the results were similar across these configurations; hence, we selected the first configuration (50, 50, 30) for DRMN application on the full data set. DRMN modules were interpreted using GO enrichment using a hypergeometric test with FDR to control for multiple hypothesis correction and transitioning gene set analysis (Supplemental Tables S2, S3).
Reprogramming sequencing data
This data set generated by Chronis et al. (2017), assayed gene expression with RNA-seq, nine chromatin marks with ChIP-seq, and chromatin accessibility with ATAC-seq in different stages of reprogramming (MEF, MEF48, pre-iPSC, and ESC) (GEO accession number GSE90895). The chromatin marks included H3K27ac, H3K27me3, H3K36me3, H3K4me1, H3K4me2, H3K4me3, H3K79me2, H3K9ac, and H3K9me3. We aligned all sequencing reads to the mouse mm9 reference genome using Bowtie 2 (Langmead and Salzberg 2012). For RNA-seq data, we quantified expression to TPMs using RSEM (Li and Dewey 2011) and applied a log transform. After removing unexpressed genes (TPM < 1), we had 17,358 genes. For the ChIP-seq and ATAC-seq data sets, we obtained per-base-pair read coverage using BEDTools (Quinlan and Hall 2010), aggregated counts within ±2500 bps of a gene's transcription start site (TSS), and applied log transformation. Q-motif features were generated using the motif collection available with the PIQ software (see Supplemental Methods; Sherwood et al. 2014).
To determine the number of modules, we used the silhouette index of ESCAROLE clusters (Supplemental Fig. S18) and found both k = 5 and 7 to be appropriate. We used k = 7 as this gave visually distinct patterns of expression (Fig. 4). For hyperparameter determination, we used a threefold CV mode with grid search (similar to the array data set) (Supplemental Figs. S21–S23) and determined the top five configurations of hyperparameters ρ1, ρ2, ρ3, as {(10,50,40), (20,50,40), (10,50,10), (40,50,0), (10,50,0)}. As the DRMN modules were largely similar, we present results for one of the configurations: ρ1 = 10, ρ2 = 50, ρ3 = 40. The final results for this data set are obtained by applying DRMN-Fused to the Histone + Accessibility + Q-Motif feature set with k = 7 modules. We tested the modules for GO enrichment and defined transitioning gene sets based on genes that change their module assignments (Supplemental Tables S2, S3). Of the 17,358 genes, 11,152 genes changed their module assignments. We clustered them into sets of five or more genes and defined 111 gene sets consisting of 10,194 genes (the remaining were singleton or genes with similarity to four or fewer genes) (Supplemental Table S3). We next used a simple regression model to predict regulators for each gene set (see “Identification of transitioning gene sets and their regulators” section).
Hepatocyte dedifferentiation time course data
The dedifferentiation time course consisted of samples extracted from adult mouse liver followed by RNA-seq and ATAC-seq analysis at 0, 0.5, 1, 2, 4, 6, 8, 10, 12, 14, 16, 18, 20, 22, 24, and 36 h (16 time points in total) (Seirup et al. 2022). Sequencing reads were aligned to the mouse mm10 reference genome using Bowtie 2 (Langmead and Salzberg 2012), and gene expression was quantified using RSEM (Li and Dewey 2011). Any gene with TPM = 0 in all time points was removed, resulting in 14,794 genes with a measurement in at least one time point. Per-base-pair read coverage for ATAC-seq was obtained using BEDTools (Quinlan and Hall 2010), and counts were aggregated within ±2500 bp of a gene's TSS. Both gene expression and accessibility data were quantile-normalized across 16 time points and then log-transformed.
We examined the silhouette index of the ESCAROLE expression modules and found k = 5 to be appropriate (Supplemental Fig. S18). Furthermore, as both k = 5 and k = 7 were reasonable for the reprogramming sequencing data set, we used k = 5 as it was computationally faster. We applied DRMN-Fused with Accessibility and Q-Motif as the feature set with k = 5 modules. Q-Motif features were generated similar to the Chronis et al. (2017) data set using PWMs from Cis-BP database (Weirauch et al. 2014). Motif instances were scored by the ATAC-seq signal, resulting in a total of 2856 features. The Q-Motif features were quantile-normalized and log-transformed across the 16 time points. To determine the appropriate settings for the hyperparameters for DRMN-Fused, we scanned the following range of values: ρ1 ∈ {30, 50, 70, 90, 110, 130, 150}, ρ2 ∈ {0, 10, 30, 50, 70}, and ρ3 = {0, 10, 30, 50, 70} within a threefold CV setting (Supplemental Fig. S24) and picked the setting with the lowest overall prediction error. The top five parameter configurations were {(70,10,70), (70,0,70), (90,0,50), (70,30,50), (70,50,30)}. We finally did a full run of DRMN-Fused with (ρ1 = 70, ρ2 = 10, ρ3 = 70), which had the best prediction error. The DRMN modules were interpreted with GO enrichment analysis. We defined transitioning gene sets from the DRMN modules. Of the 14,793 genes, there were 5762 genes that change their module assignments, which were grouped into a total of 150 transitioning gene sets of at least five genes, spanning a total of 5636 genes (Supplemental Table S3). We next predicted regulators for these transitioning gene sets using a regularized Group LASSO model, multitask group LASSO (for more details, see “Identification of transitioning gene sets and their regulators” section).
H1ESC differentiation into different lineages
The differentiation data set from Xie et al. (2013) profiled gene expression, accessibility, and histone modifications in hESCs and four lineages derived from hESCs: mesendoderm, neural progenitor, trophoblast-like, and mesenchymal stem cells (NCBI Sequence Read Archive [SRA; https://www.ncbi.nlm.nih.gov/sra] accession number SRP000941). The data set included eight histone modification marks: H3K27ac, H3K27me3, H3K36me3, H3K4me1, H3K4me2, H3K4me3, H3K79me1, and H3K9ac. Gene expression was measured with RNA-seq; histone modifications were measured with ChIP-seq; and chromatin accessibility with DNase-seq. We aligned all sequencing reads to the human hg19 reference genome using Bowtie 2 (Langmead and Salzberg 2012). We do not expect our results to change if we use GRCh38 because most of the analysis is for protein-coding genes and promoter proximal regions. We additionally realigned the RNA-seq data to GRCh38 and observe a correlation of 0.93–0.99 across the cell lines. RNA-seq data were quantified to TPMs using RSEM (Li and Dewey 2011), quantile-normalized across cell lines, and log-transformed, resulting in 17,899 genes with expression across all cell lines. For both the ChIP-seq (chromatin marks) and DNase-seq data, we obtained per-base pair read coverage using BEDTools (Quinlan and Hall 2010) and aggregated counts within ±2500 bp of a gene's TSS.
DRMN was applied using the full set of features, Accessibility, Q-Motif, Histone with k = 5 modules. The number of modules was set following a similar approach as the hepatocyte dedifferentiation data set. Q-Motif features were obtained using Cis-BP human motif PWM collection by applying utility tools from the PIQ software package (Sherwood et al. 2014) on ±2500 bp around a gene TSS. Each motif instance was scored with the DNase-seq signal, resulting in a total of 2998 features. These features were quantile-normalized and log-transformed across the cell lines. To determine the appropriate settings of the hyperparameters, we performed threefold CV with hyperparameter values in the following ranges: ρ1 ∈ {30, 50, 70, 90, 110, 130, 150}, ρ2 ∈ {0, 10, 30, 50, 70}, and ρ3 ∈ {0, 10, 30, 50, 70} (Supplemental Fig. S25). The top five configurations were {(150,0,30), (30,0,0), (150,0,10), (30,0,10), (130,0,30)} with similar results. The results reported here were generated by applying DRMN on the full data set with ρ1 = 150, ρ2 = 0, ρ3 = 30. We note that for this data set, as the relationships between the cell types are captured by a two-level tree, the ρ2 parameter likely does not have a large effect, and most of the task sharing is sufficiently captured by the global ρ3 parameter. Once modules were defined, we analyzed them as above and generated transitioning gene sets. We identified a total of 6988 (of 17,904) transitioning genes that changed their expression state. We grouped these into 122 gene sets of at least five genes and included 6730 genes (Supplemental Table S3). We identified regulators for the transitioning gene sets using our simple regression-based approach (for more details, see “Identification of transitioning gene sets and their regulators” section).
Data access
The DRMN code is available at GitHub (https://github.com/Roy-lab/drmn) along with usage instructions and is also available as Supplemental File S3. Data preprocessing and feature generation scripts are available at GitHub (https://github.com/Roy-lab/drmn_utils) and as Supplemental File S4. DRMN input files have been uploaded to Zenodo and are available at https://zenodo.org/record/6461721 and as Supplemental File S5. DRMN outputs have been provided as Supplemental File S6. The necessary mapping between motif names and TF names is available in Supplemental File S7.
Competing interest statement
The authors declare no competing interests.
Acknowledgments
We thank the Center for High Throughput Computing (CHTC) for computing resources. We thank Erika Da-Inn Lee for assistance with figures. This work was made possible in part by National Institutes of Health/National Institute of General Medical Sciences (NIH NIGMS) grant 1R01GM117339 to S.R.
Notes
[1] Supplementary material [Supplemental material is available for this article.]
[2] Article published online before print. Article, supplemental material, and publication date are at https://www.genome.org/cgi/doi/10.1101/gr.276542.121.
[3] Freely available online through the Genome Research Open Access option.
References
- ↵Avsec Ž, Weilert M, Shrikumar A, Krueger S, Alexandari A, Dalal K, Fropf R, McAnany C, Gagneur J, Kundaje A, 2021. Base-resolution models of transcription-factor binding reveal soft motif syntax. Nat Genet 53: 354–366. 10.1038/s41588-021-00782-6
- ↵Berger MF, Philippakis AA, Qureshi AM, He FS, Estep PW, Bulyk ML. 2006. Compact, universal DNA microarrays to comprehensively determine transcription-factor binding site specificities. Nat Biotechnol 24: 1429–1435. 10.1038/nbt1246
- ↵Bunina D, Abazova N, Diaz N, Noh KM, Krijgsveld J, Zaugg JB. 2020. Genomic rewiring of SOX2 chromatin interaction network during differentiation of ESCs to postmitotic neurons. Cell Syst 10: 480–494.e8. 10.1016/j.cels.2020.05.003
- ↵Chasman D, Iyer N, Fotuhi Siahpirani A, Estevez Silva M, Lippmann E, McIntosh B, Probasco MD, Jiang P, Stewart R, Thomson JA, 2019. Inferring regulatory programs governing region specificity of neuroepithelial stem cells during early hindbrain and spinal cord development. Cell Syst 9: 167–186.e12. 10.1016/j.cels.2019.05.012
- ↵Chronis C, Fiziev P, Papp B, Butz S, Bonora G, Sabri S, Ernst J, Plath K. 2017. Cooperative binding of transcription factors orchestrates reprogramming. Cell 168: 442–459.e20. 10.1016/j.cell.2016.12.016
- ↵Clotman F, Jacquemin P, Plumb-Rudewiez N, Pierreux CE, Van der Smissen P, Dietz HC, Courtoy PJ, Rousseau GG, Lemaigre FP. 2005. Control of liver cell fate decision by a gradient of TGFβ signaling modulated by Onecut transcription factors. Genes Dev 19: 1849–1854. 10.1101/gad.340305
- ↵Cole MF, Johnstone SE, Newman JJ, Kagey MH, Young RA. 2008. Tcf3 is an integral component of the core regulatory circuitry of embryonic stem cells. Genes Dev 22: 746–755. 10.1101/gad.1642408
- ↵Correa-Cerro LS, Piao Y, Sharov AA, Nishiyama A, Cadet JS, Yu H, Sharova LV, Xin L, Hoang HG, Thomas M, 2011. Generation of mouse ES cell lines engineered for the forced induction of transcription factors. Sci Rep 1: 167. 10.1038/srep00167
- ↵Dai X, Yan X, Wintergerst KA, Cai L, Keller BB, Tan Y. 2020. Nrf2: redox and metabolic regulator of stem cell state and function. Trends Mol Med 26: 185–200. 10.1016/j.molmed.2019.09.007
- ↵Davenne M, Maconochie MK, Neun R, Pattyn A, Chambon P, Krumlauf R, Rijli FM. 1999. Hoxa2 and Hoxb2 control dorsoventral patterns of neuronal development in the rostral hindbrain. Neuron 22: 677–691. 10.1016/S0896-6273(00)80728-X
- ↵Davis J, Goadrich M. 2006. The relationship between precision-recall and ROC curves. In Proceedings of the 23rd international conference on machine learning (ICML 2006), pp. 233–240. Association for Computing Memory, Pittsburgh.
- ↵de Wit E, de Laat W. 2012. A decade of 3C technologies: insights into nuclear organization. Genes Dev 26: 11–24. 10.1101/gad.179804.111
- ↵Diacou R, Zhao Y, Zheng D, Cvekl A, Liu W. 2018. Six3 and Six6 are jointly required for the maintenance of multipotent retinal progenitors through both positive and negative regulation. Cell Rep 25: 2510–2523.e4. 10.1016/j.celrep.2018.10.106
- ↵Dong X, Greven MC, Kundaje A, Djebali S, Brown JB, Cheng C, Gingeras TR, Gerstein M, Guigó R, Birney E, 2012. Modeling gene expression using chromatin features in various cellular contexts. Genome Biol 13: R53. 10.1186/gb-2012-13-9-r53
- ↵do Rego TG, Roider HG, de Carvalho FAT, Costa IG. 2012. Inferring epigenetic and transcriptional regulation during blood cell development with a mixture of sparse linear models. Bioinformatics 28: 2297–2303. 10.1093/bioinformatics/bts362
- ↵Elaut G, Henkens T, Papeleu P, Snykers S, Vinken M, Vanhaecke T, Rogiers V. 2006. Molecular mechanisms underlying the dedifferentiation process of isolated hepatocytes and their cultures. Curr Drug Metab 7: 629–660. 10.2174/138920006778017759
- ↵The ENCODE Project Consortium. 2012. An integrated encyclopedia of DNA elements in the human genome. Nature 489: 57–74. 10.1038/nature11247
- ↵Ernst J, Vainas O, Harbison CT, Simon I, Bar-Joseph Z. 2007. Reconstructing dynamic regulatory maps. Mol Syst Biol 3: 74. 10.1038/msb4100115
- ↵Ernst J, Kheradpour P, Mikkelsen TS, Shoresh N, Ward LD, Epstein CB, Zhang X, Wang L, Issner R, Coyne M, 2011. Mapping and analysis of chromatin state dynamics in nine human cell types. Nature 473: 43–49. 10.1038/nature09906
- ↵Ferri ALM, Lin W, Mavromatakis YE, Wang JC, Sasaki H, Whitsett JA, Ang SL. 2007. Foxa1 and Foxa2 regulate multiple phases of midbrain dopaminergic neuron development in a dosage-dependent manner. Development 134: 2761–2769. 10.1242/dev.000141
- ↵Fidalgo M, Shekar PC, Ang YS, Fujiwara Y, Orkin SH, Wang J. 2011. Zfp281 functions as a transcriptional repressor for pluripotency of mouse embryonic stem cells. Stem Cells 29: 1705–1716. 10.1002/stem.736
- ↵Francius C, Hidalgo-Figueroa M, Debrulle S, Pelosi B, Rucchin V, Ronellenfitch K, Panayiotou E, Makrides N, Misra K, Harris A, 2016. Vsx1 transiently defines an early intermediate V2 interneuron precursor compartment in the mouse developing spinal cord. Front Mol Neurosci 9: 145–145. 10.3389/fnmol.2016.00145
- ↵Fraser J, Williamson I, Bickmore WA, Dostie J. 2015. An overview of genome organization and how we got there: from FISH to Hi-C. Microbiol Mol Biol Rev 79: 347–372. 10.1128/MMBR.00006-15
- ↵Gong W, Koyano-Nakagawa N, Li T, Garry DJ. 2015. Inferring dynamic gene regulatory networks in cardiac differentiation through the integration of multi-dimensional data. BMC Bioinformatics 16: 74. 10.1186/s12859-015-0460-0
- ↵González AJ, Setty M, Leslie CS. 2015. Early enhancer establishment and regulatory locus complexity shape transcriptional programs in hematopoietic differentiation. Nat Genet 47: 1249–1259. 10.1038/ng.3402
- ↵Gorkin DU, Leung D, Ren B. 2014. The 3D genome in transcriptional regulation and pluripotency. Cell Stem Cell 14: 762–775. 10.1016/j.stem.2014.05.017
- ↵Grant CE, Bailey TL, Noble WS. 2011. FIMO: scanning for occurrences of a given motif. Bioinformatics 27: 1017–1018. 10.1093/bioinformatics/btr064
- ↵Heng YHE, McLeay RC, Harvey TJ, Smith AG, Barry G, Cato K, Plachez C, Little E, Mason S, Dixon C, 2014. NFIX regulates neural progenitor cell differentiation during hippocampal morphogenesis. Cereb Cortex 24: 261–279. 10.1093/cercor/bhs307
- ↵Hui C, Angers S. 2011. Gli proteins in development and disease. Annu Rev Cell Dev Biol 27: 513–537. 10.1146/annurev-cellbio-092910-154048
- ↵Ikeda T, Zhang J, Chano T, Mabuchi A, Fukuda A, Kawaguchi H, Nakamura K, Ikegawa S. 2002. Identification and characterization of the human long form of Sox5 (L-SOX5) gene. Gene 298: 59–68. 10.1016/S0378-1119(02)00927-7
- ↵Jojic V, Shay T, Sylvia K, Zuk O, Sun X, Kang J, Regev A, Koller D, Immunological Genome Project Consortium, Best AJ, 2013. Identification of transcriptional regulators in the mouse immune system. Nat Immunol 14: 633–643. 10.1038/ni.2587
- ↵Kisanga EP, Tang Z, Guller S, Whirledge S. 2018. Glucocorticoid signaling regulates cell invasion and migration in the human first-trimester trophoblast cell line Sw.71. Am J Reprod Immunol 80: e12974. 10.1111/aji.12974
- ↵Koch C, Konieczka J, Delorey T, Lyons A, Socha A, Davis K, Knaack SA, Thompson D, O'Shea EK, Regev A, 2017. Inference and evolutionary analysis of genome-scale regulatory networks in large phylogenies. Cell Syst 4: 543–558.e8. 10.1016/j.cels.2017.04.010
- ↵Kundaje A, Lianoglou S, Li X, Quigley D, Arias M, Wiggins CH, Zhang L, Leslie C. 2007. Learning regulatory programs that accurately predict differential expression with MEDUSA. Ann N Y Acad Sci 1115: 178–202. 10.1196/annals.1407.020
- ↵Kyrmizi I, Hatzis P, Katrakili N, Tronche F, Gonzalez FJ, Talianidis I. 2006. Plasticity and expanding complexity of the hepatic transcription factor network during liver development. Genes Dev 20: 2293–2305. 10.1101/gad.390906
- ↵Langfelder P, Horvath S. 2008. WGCNA: an R package for weighted correlation network analysis. BMC Bioinformatics 9: 559. 10.1186/1471-2105-9-559
- ↵Langmead B, Salzberg SL. 2012. Fast gapped-read alignment with Bowtie 2. Nat Methods 9: 357–359. 10.1038/nmeth.1923
- ↵Lara-Astiaso D, Weiner A, Lorenzo-Vivas E, Zaretsky I, Jaitin DA, David E, Keren-Shaul H, Mildner A, Winter D, Jung S, 2014. Chromatin state dynamics during blood formation. Science 345: 943–949. 10.1126/science.1256271
- ↵Laudadio I, Manfroid I, Achouri Y, Schmidt D, Wilson MD, Cordi S, Thorrez L, Knoops L, Jacquemin P, Schuit F, 2012. A feedback loop between the liver-enriched transcription factor network and Mir-122 controls hepatocyte differentiation. Gastroenterology 142: 119–129. 10.1053/j.gastro.2011.09.001
- ↵Lee TI, Young RA. 2013. Transcriptional regulation and its misregulation in disease. Cell 152: 1237–1251. 10.1016/j.cell.2013.02.014
- ↵Lee SI, Dudley AM, Drubin D, Silver PA, Krogan NJ, Pe'er D, Koller D. 2009. Learning a prior on regulatory potential from eQTL data. PLoS Genet 5: e1000358. 10.1371/journal.pgen.1000358
- ↵Le Lay J, Kaestner KH. 2010. The Fox genes in the liver: from organogenesis to functional integration. Physiol Rev 90: 1–22. 10.1152/physrev.00018.2009
- ↵Li B, Dewey CN. 2011. RSEM: accurate transcript quantification from RNA-seq data with or without a reference genome. BMC Bioinformatics 12: 323. 10.1186/1471-2105-12-323
- ↵Luedde T, Schwabe RF. 2011. NF-κB in the liver: linking injury, fibrosis and hepatocellular carcinoma. Nat Rev Gastroenterol Hepatol 8: 108–118. 10.1038/nrgastro.2010.213
- ↵Madissoon E, Damdimopoulos A, Katayama S, Krjutškov K, Einarsdottir E, Mamia K, De Groef B, Hovatta O, Kere J, Damdimopoulou P. 2019. Pleomorphic adenoma gene 1 is needed for timely zygotic genome activation and early embryo development. Sci Rep 9: 8411. 10.1038/s41598-019-44882-0
- ↵Magee N, Zhang Y. 2017. Role of early growth response 1 in liver metabolism and liver cancer. Hepatoma Res 3: 268–277. 10.20517/2394-5079.2017.36
- ↵Maherali N, Sridharan R, Xie W, Utikal J, Eminli S, Arnold K, Stadtfeld M, Yachechko R, Tchieu J, Jaenisch R, 2007. Directly reprogrammed fibroblasts show global epigenetic remodeling and widespread tissue contribution. Cell Stem Cell 1: 55–70. 10.1016/j.stem.2007.05.014
- ↵Malaterre J, Mantamadiotis T, Dworkin S, Lightowler S, Yang Q, Ransome MI, Turnley AM, Nichols NR, Emambokus NR, Frampton J, 2008. c-Myb is required for neural progenitor cell proliferation and maintenance of the neural stem cell niche in adult brain. Stem Cells 26: 173–181. 10.1634/stemcells.2007-0293
- ↵Matys V, Fricke E, Geffers R, Gössling E, Haubrock M, Hehl R, Hornischer K, Karas D, Kel AE, Kel-Margoulis OV, 2003. TRANSFAC: transcriptional regulation, from patterns to profiles. Nucleic Acids Res 31: 374–378. 10.1093/nar/gkg108
- ↵Miyashita N, Horie M, Suzuki HI, Saito M, Mikami Y, Okuda K, Boucher RC, Suzukawa M, Hebisawa A, Saito A, 2020. FOXL1 regulates lung fibroblast function via multiple mechanisms. Am J Respir Cell Mol Biol 63: 831–842. 10.1165/rcmb.2019-0396OC
- ↵Müller FJ, Laurent LC, Kostka D, Ulitsky I, Williams R, Lu C, Park IH, Rao MS, Shamir R, Schwartz PH, 2008. Regulatory networks define phenotypic classes of human stem cell lines. Nature 455: 401–405. 10.1038/nature07213
- ↵Nishiyama A, Xin L, Sharov AA, Thomas M, Mowrer G, Meyers E, Piao Y, Mehta S, Yee S, Nakatake Y, 2009. Uncovering early response of gene regulatory networks in ESCs by systematic induction of transcription factors. Cell Stem Cell 5: 420–433. 10.1016/j.stem.2009.07.012
- ↵Nishiyama A, Sharov AA, Piao Y, Amano M, Amano T, Hoang HG, Binder BY, Tapnio R, Bassey U, Malinou JN, 2013. Systematic repression of transcription factors reveals limited patterns of gene expression changes in ES cells. Sci Rep 3: 1390. 10.1038/srep01390
- ↵Odom DT, Dowell RD, Jacobsen ES, Nekludova L, Rolfe PA, Danford TW, Gifford DK, Fraenkel E, Bell GI, Young RA. 2006. Core transcriptional regulatory circuitry in human hepatocytes. Mol Syst Biol 2: 2006.0017. 10.1038/msb4100059
- ↵Osmanbeyoglu HU, Shimizu F, Rynne-Vidal A, Alonso-Curbelo D, Chen HA, Wen HY, Yeung TL, Jelinic P, Razavi P, Lowe SW, 2019. Chromatin-informed inference of transcriptional programs in gynecologic and basal breast cancers. Nat Commun 10: 4369. 10.1038/s41467-019-12291-6
- ↵Parikh AP, Wu W, Curtis RE, Xing EP. 2011. TREEGL: reverse engineering tree-evolving gene networks underlying developing biological lineages. Bioinformatics 27: i196–i204. 10.1093/bioinformatics/btr239
- ↵Phan QM, Fine GM, Salz L, Herrera GG, Wildman B, Driskell IM, Driskell RR. 2020. Lef1 expression in fibroblasts maintains developmental potential in adult skin to regenerate wounds. eLife 9: e60066. 10.7554/eLife.60066
- ↵Pierson E, The GTEx Consortium, Koller D, Battle A, Mostafavi S, Ardlie KG, Getz G, Wright FA, Kellis M, Volpi S, 2015. Sharing and specificity of co-expression networks across 35 human tissues. PLoS Comput Biol 11: e1004220. 10.1371/journal.pcbi.1004220
- ↵Quinlan AR, Hall IM. 2010. BEDTools: a flexible suite of utilities for comparing genomic features. Bioinformatics 26: 841–842. 10.1093/bioinformatics/btq033
- ↵Ravasi T, Suzuki H, Cannistraci CV, Katayama S, Bajic VB, Tan K, Akalin A, Schmeier S, Kanamori-Katayama M, Bertin N, 2010. An atlas of combinatorial transcriptional regulation in mouse and man. Cell 140: 744–752. 10.1016/j.cell.2010.01.044
- ↵Rétaux S, Rogard M, Bach I, Failli V, Besson MJ. 1999. Lhx9: a novel LIM-homeodomain gene expressed in the developing forebrain. J Neurosci 19: 783–793. 10.1523/JNEUROSCI.19-02-00783.1999
- ↵Roy S, Sridharan R. 2017. Chromatin module inference on cellular trajectories identifies key transition points and poised epigenetic states in diverse developmental processes. Genome Res 27: 1250–1262. 10.1101/gr.215004.116
- ↵Roy S, Werner-Washburne M, Lane T. 2011. A multiple network learning approach to capture system-wide condition-specific responses. Bioinformatics 27: 1832–1838. 10.1093/bioinformatics/btr270
- ↵Roy S, Lagree S, Hou Z, Thomson JA, Stewart R, Gasch AP. 2013. Integrated module and gene-specific regulatory inference implicates upstream signaling networks. PLoS Comput Biol 9: e1003252. 10.1371/journal.pcbi.1003252
- ↵Rudraiah S, Zhang X, Wang L. 2016. Nuclear receptors as therapeutic targets in liver disease: Are we there yet? Annu Rev Pharmacol Toxicol 56: 605–626. 10.1146/annurev-pharmtox-010715-103209
- ↵Saha B, Ganguly A, Home P, Bhattacharya B, Ray S, Ghosh A, Rumi MAK, Marsh C, French VA, Gunewardena S, 2020. TEAD4 ensures postimplantation development by promoting trophoblast self-renewal: an implication in early human pregnancy loss. Proc Natl Acad Sci 117: 17864–17875. 10.1073/pnas.2002449117
- ↵Sakaguchi M, Cai W, Wang CH, Cederquist CT, Damasio M, Homan EP, Batista T, Ramirez AK, Gupta MK, Steger M, 2019. Foxk1 and FoxK2 in insulin regulation of cellular and mitochondrial metabolism. Nat Commun 10: 1582. 10.1038/s41467-019-09418-0
- ↵Sandelin A, Alkema W, Engström P, Wasserman WW, Lenhard B. 2004. JASPAR: an open-access database for eukaryotic transcription factor binding profiles. Nucleic Acids Res 32: D91–D94. 10.1093/nar/gkh012
- ↵Schulz MH, Devanny WE, Gitter A, Zhong S, Ernst J, Bar-Joseph Z. 2012. DREM 2.0: improved reconstruction of dynamic regulatory networks from time-series expression data. BMC Syst Biol 6: 104. 10.1186/1752-0509-6-104
- ↵Schwab JD, Kühlwein SD, Ikonomi N, Kühl M, Kestler HA. 2020. Concepts in Boolean network modeling: What do they all mean? Comput Struct Biotechnol J 18: 571–582. 10.1016/j.csbj.2020.03.001
- ↵Scott A, Hasegawa H, Sakurai K, Yaron A, Cobb J, Wang F. 2011. Transcription factor short stature homeobox 2 is required for proper development of tropomyosin-related kinase B-expressing mechanosensory neurons. J Neurosci 31: 6741–6749. 10.1523/JNEUROSCI.5883-10.2011
- ↵Segal E, Shapira M, Regev A, Pe'er D, Botstein D, Koller D, Friedman N. 2003. Module networks: identifying regulatory modules and their condition-specific regulators from gene expression data. Nat Genet 34: 166–176. 10.1038/ng1165
- ↵Seirup M, Sengupta S, Swanson S, McIntosh BE, Collins M, Chu LF, Cheng Z, Gorkin DU, Duffin B, Bolin JM, 2022. Rapid changes in chromatin structure during dedifferentiation of primary hepatocytes in vitro. Genomics 114: 110330. 10.1016/j.ygeno.2022.110330
- ↵Setty M, Leslie CS. 2015. SeqGL identifies context-dependent binding signals in genome-wide regulatory element maps. PLoS Comput Biol 11: e1004271. 10.1371/journal.pcbi.1004271
- ↵Sheaffer KL, Kaestner KH. 2012. Transcriptional networks in liver and intestinal development. Cold Spring Harb Perspect Biol 4: a008284. 10.1101/cshperspect.a008284
- ↵Sherwood RI, Hashimoto T, O'Donnell CW, Lewis S, Barkal AA, van Hoff JP, Karun V, Jaakkola T, Gifford DK. 2014. Discovery of directional and nondirectional pioneer transcription factors by modeling DNase profile magnitude and shape. Nat Biotechnol 32: 171–178. 10.1038/nbt.2798
- ↵Soncin F, Parast MM. 2020. Role of Hippo signaling pathway in early placental development. Proc Natl Acad Sci 117: 20354–20356. 10.1073/pnas.2013559117
- ↵Sridharan R, Plath K. 2008. Illuminating the black box of reprogramming. Cell Stem Cell 2: 295–297. 10.1016/j.stem.2008.03.015
- ↵Sridharan R, Tchieu J, Mason MJ, Yachechko R, Kuoy E, Horvath S, Zhou Q, Plath K. 2009. Role of the murine reprogramming factors in the induction of pluripotency. Cell 136: 364–377. 10.1016/j.cell.2009.01.001
- ↵Sridharan R, Gonzales-Cope M, Chronis C, Bonora G, McKee R, Huang C, Patel S, Lopez D, Mishra N, Pellegrini M, 2013. Proteomic and genomic approaches reveal critical functions of H3K9 methylation and heterochromatin protein-1γ in reprogramming to pluripotency. Nat Cell Biol 15: 872–882. 10.1038/ncb2768
- ↵Subramanian A, Tamayo P, Mootha VK, Mukherjee S, Ebert BL, Gillette MA, Paulovich A, Pomeroy SL, Golub TR, Lander ES, 2005. Gene set enrichment analysis: a knowledge-based approach for interpreting genome-wide expression profiles. Proc Natl Acad Sci 102: 15545–15550. 10.1073/pnas.0506580102
- ↵Tavera-Montañez C, Hainer SJ, Cangussu D, Gordon SJV, Xiao Y, Reyes-Gutierrez P, Imbalzano AN, Navea JG, Fazzio TG, Padilla-Benavides T. 2019. The classic metal-sensing transcription factor MTF1 promotes myogenesis in response to copper. FASEB J 33: 14556–14574. 10.1096/fj.201901606R
- ↵Uemura M, Swenson ES, Gaça MDA, Giordano FJ, Reiss M, Wells RG. 2005. Smad2 and Smad3 play different roles in rat hepatic stellate cell function and α-smooth muscle actin organization. Mol Biol Cell 16: 4214–4224. 10.1091/mbc.e05-02-0149
- ↵Vallecillo-García P, Orgeur M, vom Hofe-Schneider S, Stumm J, Kappert V, Ibrahim DM, Börno ST, Hayashi S, Relaix F, Hildebrandt K, 2017. Odd skipped-related 1 identifies a population of embryonic fibro-adipogenic progenitors regulating myogenesis during limb development. Nat Commun 8: 1218. 10.1038/s41467-017-01120-3
- ↵Velazquez JJ, LeGraw R, Moghadam F, Tan Y, Kilbourne J, Maggiore JC, Hislop J, Liu S, Cats D, Chuva de Sousa Lopes SM, 2021. Gene regulatory network analysis and engineering directs development and vascularization of multilineage human liver organoids. Cell Syst 12: 41–55.e11. 10.1016/j.cels.2020.11.002
- ↵Wamstad JA, Alexander JM, Truty RM, Shrikumar A, Li F, Eilertson KE, Ding H, Wylie JN, Pico AR, Capra JA, 2012. Dynamic and coordinated epigenetic regulation of developmental transitions in the cardiac lineage. Cell 151: 206–220. 10.1016/j.cell.2012.07.035
- ↵Wangensteen KJ, Zhang S, Greenbaum LE, Kaestner KH. 2015. A genetic screen reveals Foxa3 and TNFR1 as key regulators of liver repopulation. Genes Dev 29: 904–909. 10.1101/gad.258855.115
- ↵Weirauch MT, Yang A, Albu M, Cote AG, Montenegro-Montero A, Drewe P, Najafabadi HS, Lambert SA, Mann I, Cook K, 2014. Determination and inference of eukaryotic transcription factor sequence specificity. Cell 158: 1431–1443. 10.1016/j.cell.2014.08.009
- ↵Whalen S, Truty RM, Pollard KS. 2016. Enhancer–promoter interactions are encoded by complex genomic signatures on looping chromatin. Nat Genet 48: 488–496. 10.1038/ng.3539
- ↵Wittmann MT, Häberle BM. 2018. Linking the neuropsychiatric disease gene TCF4 to neuronal activity-dependent regulatory networks. J Neurosci 38: 2653–2655. 10.1523/JNEUROSCI.3475-17.2018
- ↵Wong DJ, Liu H, Ridky TW, Cassarino D, Segal E, Chang HY. 2008. Module map of stem cell genes guides creation of epithelial cancer stem cells. Cell Stem Cell 2: 333–344. 10.1016/j.stem.2008.02.009
- ↵Xie W, Schultz MD, Lister R, Hou Z, Rajagopal N, Ray P, Whitaker JW, Tian S, Hawkins RD, Leung D, 2013. Epigenomic analysis of multilineage differentiation of human embryonic stem cells. Cell 153: 1134–1148. 10.1016/j.cell.2013.04.022
- ↵Xu H, Baroukh C, Dannenfelser R, Chen EY, Tan CM, Kou Y, Kim YE, Lemischka IR, Ma'ayan A. 2013. ESCAPE: database for integrating high-content published data collected from human and mouse embryonic stem cells. Database (Oxford) 2013: bat045. 10.1093/database/bat045
- ↵Young RA. 2011. Control of the embryonic stem cell state. Cell 144: 940–954. 10.1016/j.cell.2011.01.032
- ↵Yu W, Li X, Eliason S, Romero-Bustillos M, Ries RJ, Cao H, Amendt BA. 2017. Irx1 regulates dental outer enamel epithelial and lung alveolar type II epithelial differentiation. Dev Biol 429: 44–55. 10.1016/j.ydbio.2017.07.011
- ↵Zhang J, Cao H, Xie J, Fan C, Xie Y, He X, Liao M, Zhang S, Wang H. 2018. The oncogene Etv5 promotes MET in somatic reprogramming and orchestrates epiblast/primitive endoderm specification during mESCs differentiation. Cell Death Dis 9: 224. 10.1038/s41419-018-0335-1
- ↵Zhang S, Chasman D, Knaack S, Roy S. 2019. In silico prediction of high-resolution Hi-C interaction matrices. Nat Commun 10: 5449. 10.1038/s41467-019-13423-8