
Abstract
Mutation is the source of genetic variation and the fundament of evolution. Temperature has long been suggested to have a direct impact on realized spontaneous mutation rates. If mutation rates vary in response to environmental conditions, such as the variation of the ambient temperature through space and time, they should no longer be described as species-specific constants. By combining mutation accumulation with whole-genome sequencing in a multicellular organism, we provide empirical support to reject the null hypothesis of a constant, temperature-independent mutation rate. Instead, mutation rates depended on temperature in a U-shaped manner with increasing rates toward both temperature extremes. This relation has important implications for mutation-dependent processes in molecular evolution, processes shaping the evolution of mutation rates, and even the evolution of biodiversity as such.
Mutation has been described as the “quantum force” of biology (Gibson 2005): pervasive throughout the tree of life, the fundamental basis of evolution, and notoriously difficult to measure. Evidence for the variation of mutation rates (µ) has been accumulating for a century, with pioneering investigations in Drosophila dating back to the 1930s (Timofeeff-Ressovsky 1936; Demerec 1937) and more recent studies estimating the variability of µ in microorganisms (Lee et al. 2012; Dillon et al. 2018; Ramiro et al. 2020), plants (Sutherland and Watkinson 1986; Wang et al. 2019; Krasovec et al. 2020), and invertebrates (Thomas et al. 2010; Matsuba et al. 2013; Berger et al. 2017; Flynn et al. 2017; Pfenninger et al. 2020), as well as vertebrates (Hodgkinson and Eyre-Walker 2011; Carlson et al. 2018; Thomas et al. 2018). On the intraspecific level, the spontaneous µ was often claimed to be a species-specific constant (Lynch 2010). However, model-based analyses indicate the possibility of fitness-dependent mutation rates (Agrawal 2002), and accordingly, mutation rates have been shown to be sensitive to genetic and environmental stress (Sharp and Agrawal 2012; but see Baer et al. 2006). The question of which factors directly drive mutational rate variation remains unresolved, particularly in multicellular organisms. Temperature has long been suggested as a major determinant of µ variation. Experiments in the first half of the 20th century (for review, see Lindgren 1972) reported generally large effects of temperature treatments on phenotypically visible mutations. As reported by Muller (1928) in the first study on this topic, “both the direction of the effect of temperature on the time-rate of mutation, and its approximate magnitude, are the same as in the case of its effect on the time-rate of ordinary chemical reactions.” However, cold treatments also increased the apparent mutation rate in some studies (Birkina 1938; Kerkis 1941). Apart from these early studies, mainly performed even before DNA was identified as the carrier of genetic information, there is little empirical evidence if and to what extent temperature modifies the spontaneous rate of mutation on the molecular level. Higher temperature stress had a significant effect on microsatellite µ in Caenorhabditis elegans (Matsuba et al. 2013). Studies on Drosophila melanogaster suggest that indeed temperature-dependent metabolic activities increased the somatic mutation rate as a consequence of oxidative stress (Garcia et al. 2010). Stressful temperature conditions increased µ in experimental evolution lines of the seed beetle Callosobruchus maculatus (Berger et al. 2017), and the temperature-dependent mass-specific metabolic rate seemed to influence the interspecific molecular clock rate that depends at least partially on µ (Gillooly et al. 2005).
Despite century-long research on the potential impact of temperature on mutational variation, we still lack a thorough understanding of mechanisms underlying the temperature dependence of µ. Empirical evidence for increased µ under stressful temperature conditions is strong; however, the relation between natural, and thus relevant, temperature ranges and the variability of µ on an intraspecific level is still unclear. It was therefore our aim to test the following null hypothesis (H0): The spontaneous mutation rate is a species-specific constant and independent of environmental conditions.
We tested this hypothesis with the nonbiting midge Chironomus riparius, a suitable model species for experimental population genomic studies. C. riparius is a fully developed system for multigeneration experiments (Foucault et al. 2019) with comprehensive genomic resources (Schmidt et al. 2020). A haploid spontaneous single nucleotide µ of 2.1 × 10⁻⁹ has been previously reported, also establishing the necessary experimental framework (Oppold and Pfenninger 2017). Moreover, there is indirect evidence for the temperature dependence of µ among C. riparius populations (Oppold et al. 2016). With a Holarctic distribution range, the species occurs across different climate regions, including northern habitats with cold winter seasons and southern habitats with hot summer seasons, and population-specific temperature tolerance is subject to local adaptation (Waldvogel et al. 2018).
Results
Mutation accumulation at different temperatures
Here, we performed short-term mutation accumulation experiments at temperatures between 12°C and 26°C (Fig. 1). As generally expected for ectothermic organisms, the generation time of individuals in our experiments decreased with increasing temperature (Fig. 1), and we also observed a reduction of body size with increasing temperature. The targeted maximum of 50 generational passages (GPs) by accumulating 10 mutation accumulation lines (MALs) over five consecutive generations was fulfilled or closely reached in experiments under intermediate temperature conditions (number of GPs at 17°C, 20°C, 23°C, respectively: 45, 50, 47). A reduced number of GPs was realized under lower and highest temperatures (12°C, 14°C, 26°C, respectively: 20, 15, 28). In the 26°C experiment, the loss of MALs could be partially compensated by recovering backup lines.
Experimental setup of mutation accumulation at different constant temperatures. The succession of circles indicates how many generations (F1–F5) could be passed under the different temperature conditions. Circles are labeled with the total number of MALs that survived until the respective generation. Mean generation time (GT) is decreasing with increasing temperature as indicated in the detail graph. Number of generational passages (GP = MALs × generation) sums up to a total of 205 (excluding GPs of mutator lines).
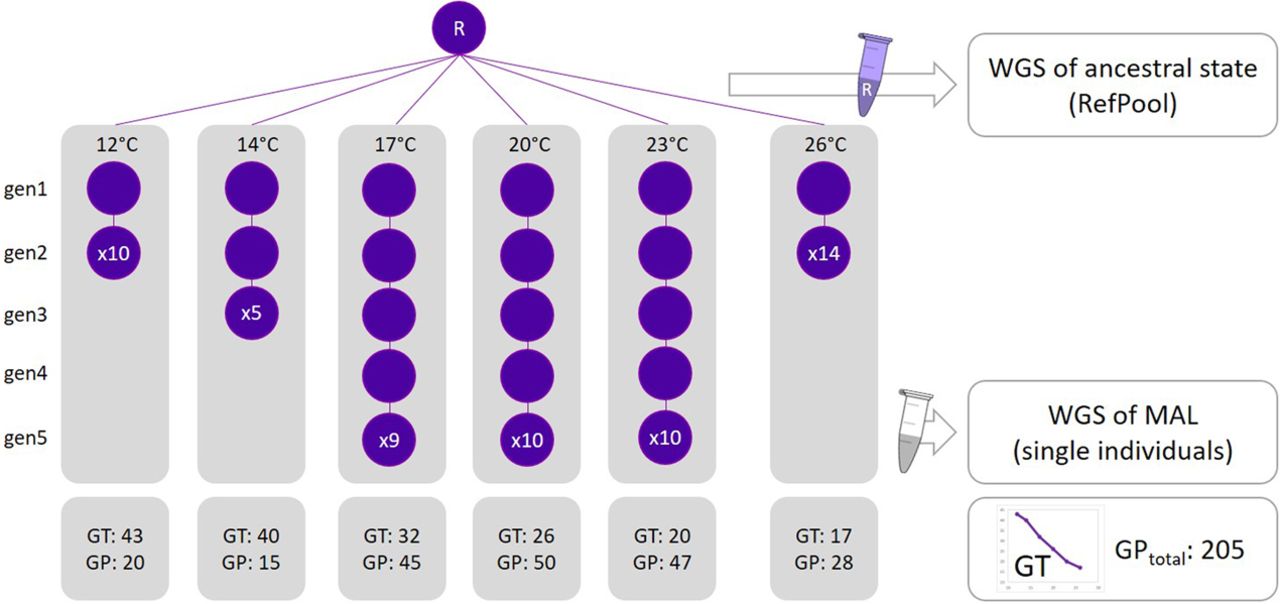
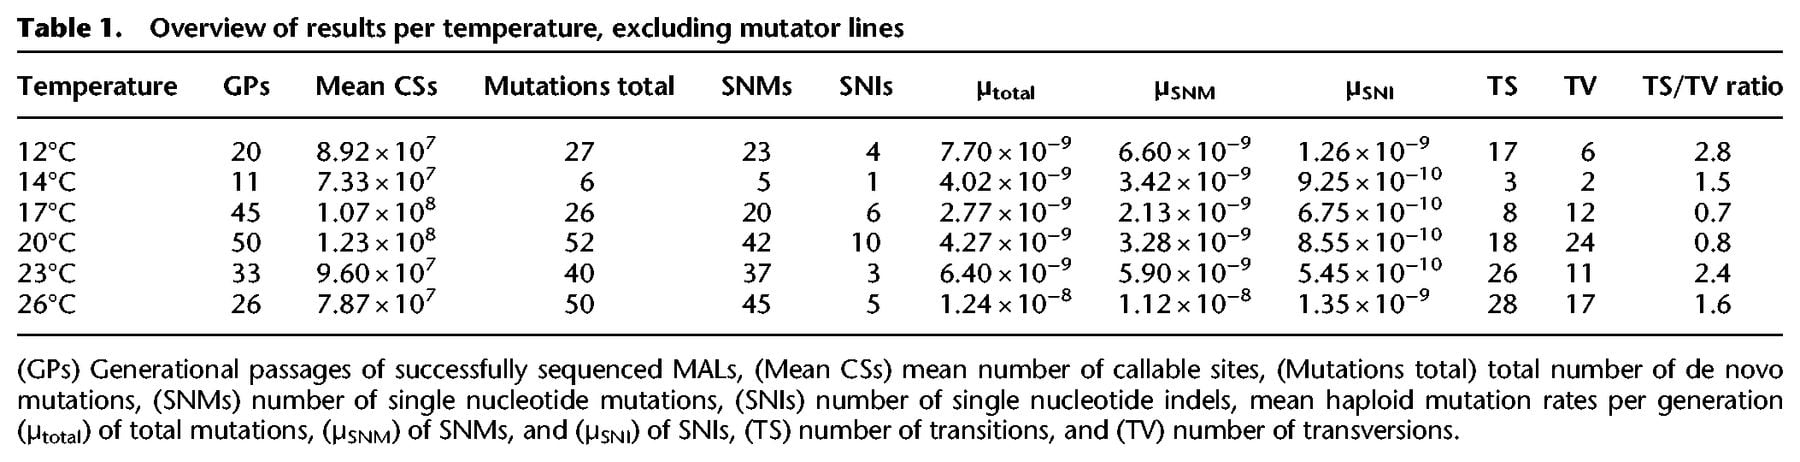
Whole-genome data of the ancestral state (sequenced as pooled offspring [RefPool]) and 58 single individuals across all mutation accumulation lines were passed along the de novo mutation calling pipeline established for this species (Oppold and Pfenninger 2017; Methods). Across a total number of 5.5 × 10⁹ analyzed genomic positions, we identified 106,149 de novo mutations in MALs of all temperatures. Most of these mutations (105,948) were found in five MALs with an extraordinarily high mutation load. Mutation rates of these five MALs were increased at least fourfold when compared to the mean rates of all other MALs at the same temperature (Supplemental Table S2). Accordingly, we identified these MALs as mutator lines and excluded them from downstream analyses. This resulted in a final set of 201 de novo mutations during a total of 177 generational passages detected throughout all temperature experiments (Table 1). There were seven MALs with zero de novo mutations (randomly distributed across temperatures: χ2 = 7.6844, df = 5, P-value = 0.1745). The total rate of spontaneous mutations per haploid genome per generation ranged between 2.77 × 10⁻⁹ and 1.24 × 10⁻⁸ across all temperature experiments (Table 1).
Overview of results per temperature, excluding mutator lines
Mutation rate estimates in relation to temperature
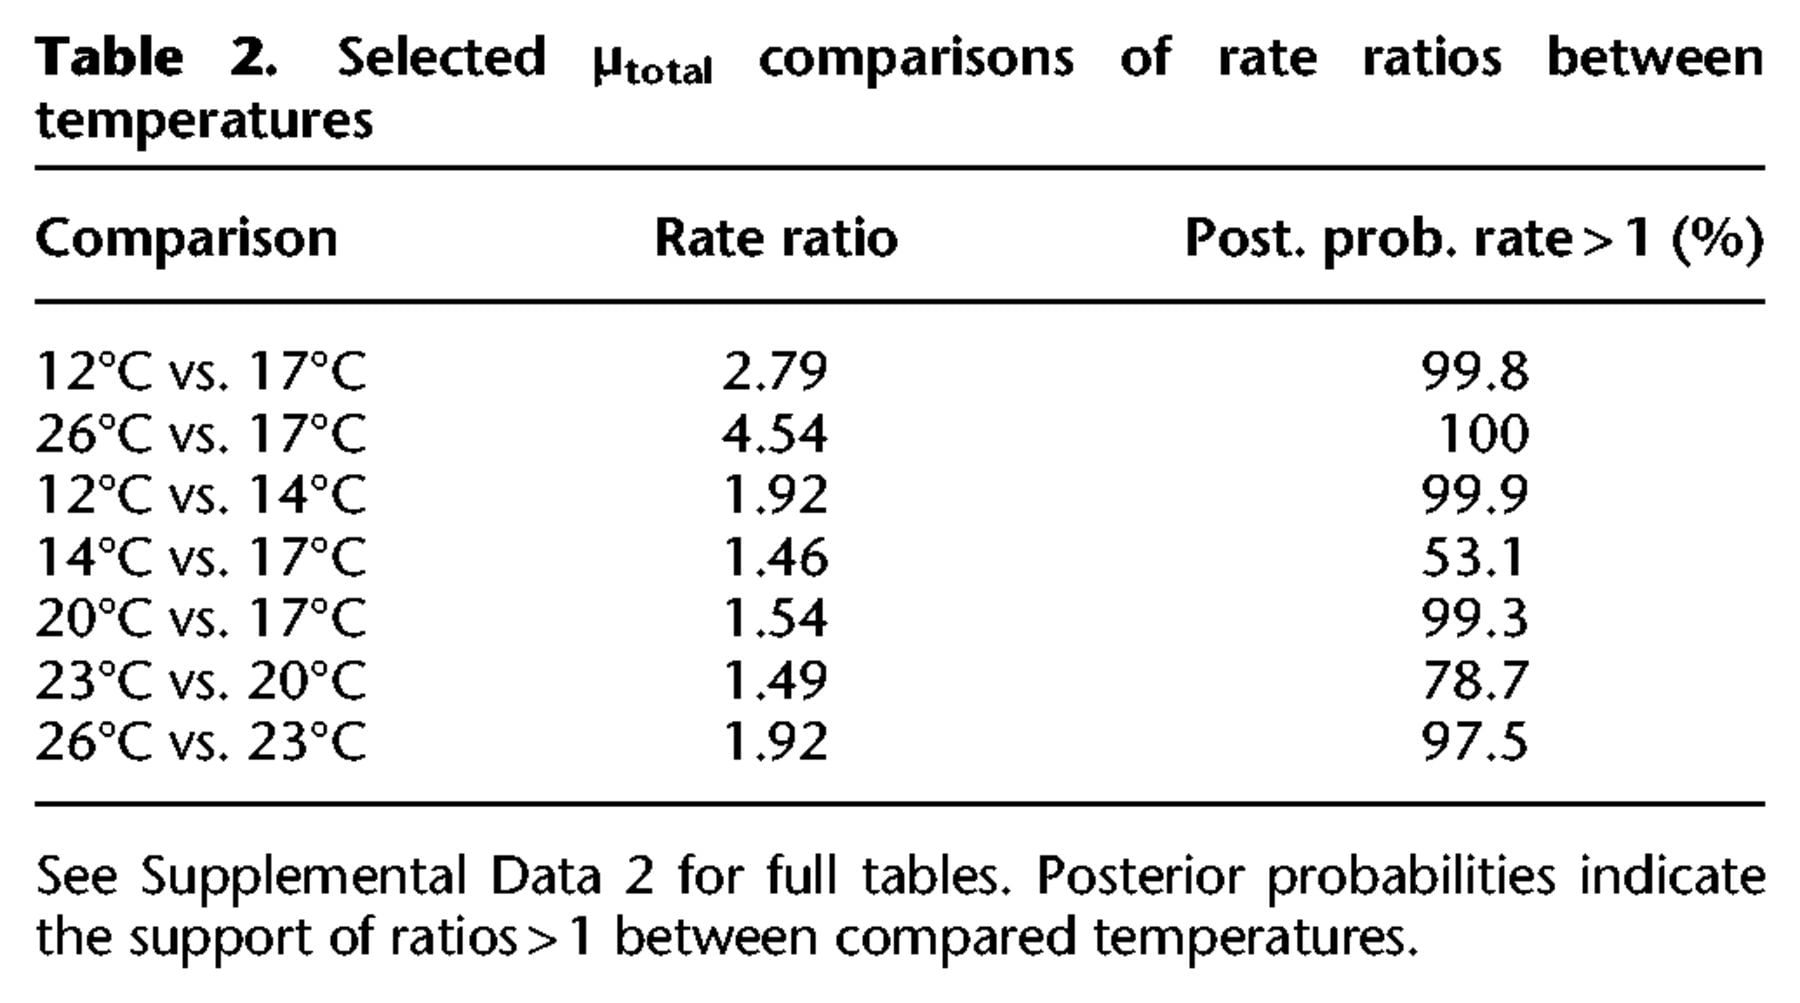
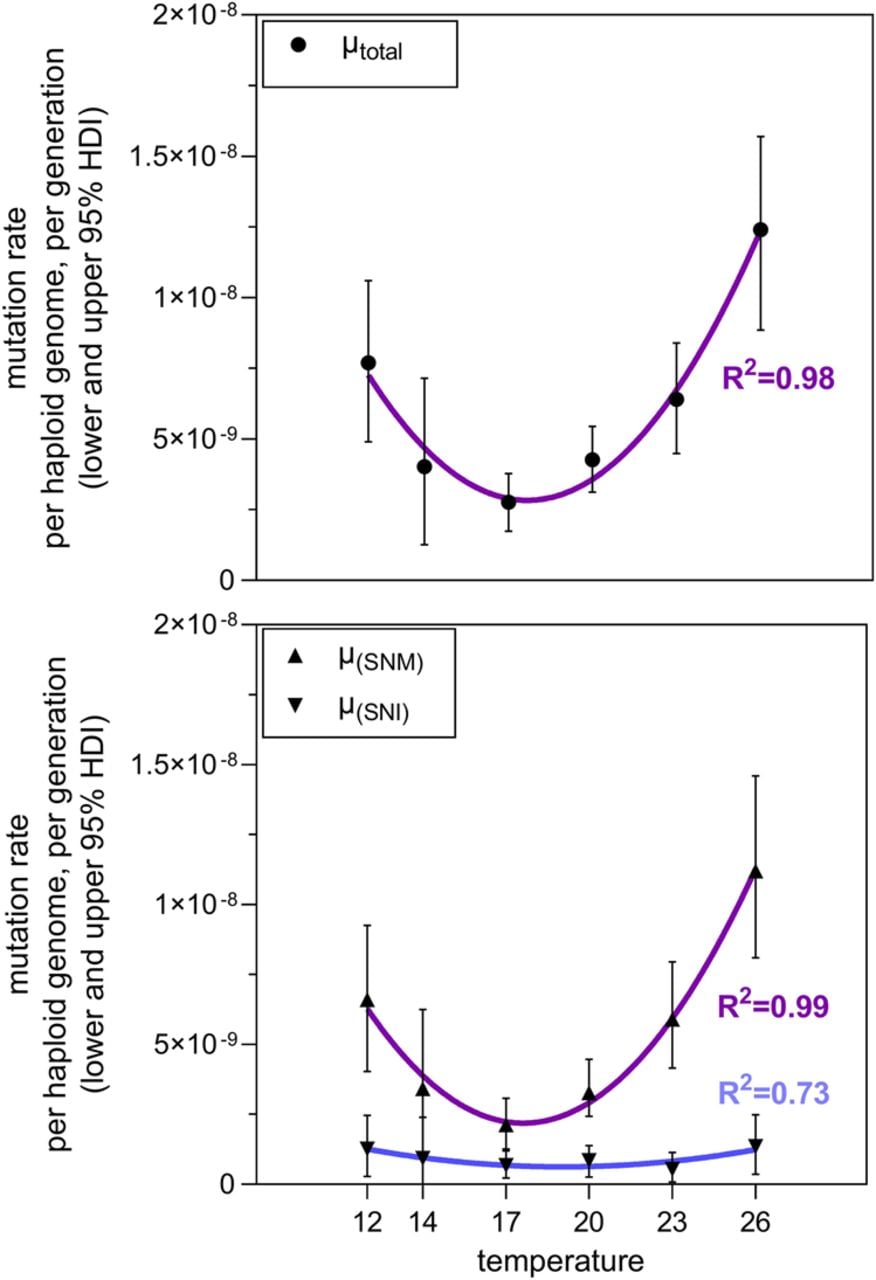
Temperature had a significant impact on realized spontaneous µ in our MAL experiments. The lowest rate of total mutations was calculated for the 17°C experiment with 2.77 × 10⁻⁹ (95% highest density intervals of posterior distributions [HDI]: lower 1.74 × 10⁻⁹ and upper 3.78 × 10⁻⁹) (Table 1; Supplemental Data 2). From this minimum, µ increased monotonically with the absolute temperature difference in both directions (Fig. 1). µ at the extreme temperatures 12°C (7.70 × 10⁻⁹, 95% HDI: lower 4.90 × 10⁻⁹ and upper 1.06 × 10⁻⁸, Δ5°C from minimum) and 26°C (1.24 × 10⁻⁸, 95% HDI: lower 8.85 × 10⁻⁹ and upper 1.57 × 10⁻⁸, Δ9°C from minimum) was 2.79 times and 4.54 times higher than the minimum rate, respectively (respective posterior probabilities 99.8% and 100%) (Table 2). In all cases, there was predominant to conclusive evidence that the next temperature step in the direction of both extremes induced a higher µ (Table 2).
Selected µtotal comparisons of rate ratios between temperatures
When decomposing total µ into single nucleotide mutations (SNMs; µSNM) and single nucleotide indels (SNIs; µSNI), the distribution of the data in relation to temperature was almost identical for the former (Fig. 2, bottom). Due to the low number of de novo SNIs, µSNI values were comparably low (Table 1; Fig. 2, bottom), and, at first sight, no clear U-shape distribution in relation to temperature appeared. However, fitting second-order polynomial regression models to the data found a U-shape relation between temperature and all measured rates, with a respective goodness of fit of r2= 0.98, r2= 0.99, and r² = 0.73 (Fig. 2). Polynomial regression models fitted the data better compared to a linear regression model as evidenced by a lower Akaike information criterion (AIC = 6 vs. AIC = 8) (Supplemental Table S3) and goodness of fit measures (r2= 0.28, r2= 0.30, and r² = 0.002, respectively, for the linear models). These results are thus in line with the statistical evidence by Bayesian inference.
Spontaneous mutation rates per haploid genome per generation in relation to temperature of the MAL experiment. Top: Mutation rate of the total sum of de novo mutations. Bottom: Separate mutation rates of single nucleotide mutations (SNMs) and single nucleotide indels (SNIs). Nonlinear fit as second-order polynomial regression; R² values are given to describe the goodness of model fit. Corresponding test statistics are listed in Supplemental Data 2.
Mutational spectrum at different temperatures
We additionally disentangled temperature effects on the mutational spectrum. Excluding mutator lines, we detected 172 SNMs (86%) and 29 indels (Table 1). SNMs divided into 100 transitions and 72 transversions (ratio = 1.38) (Table 1). Overall, transitions occurred significantly more often than transversions (Mann–Whitney U = 53.5, P = 0.0015).
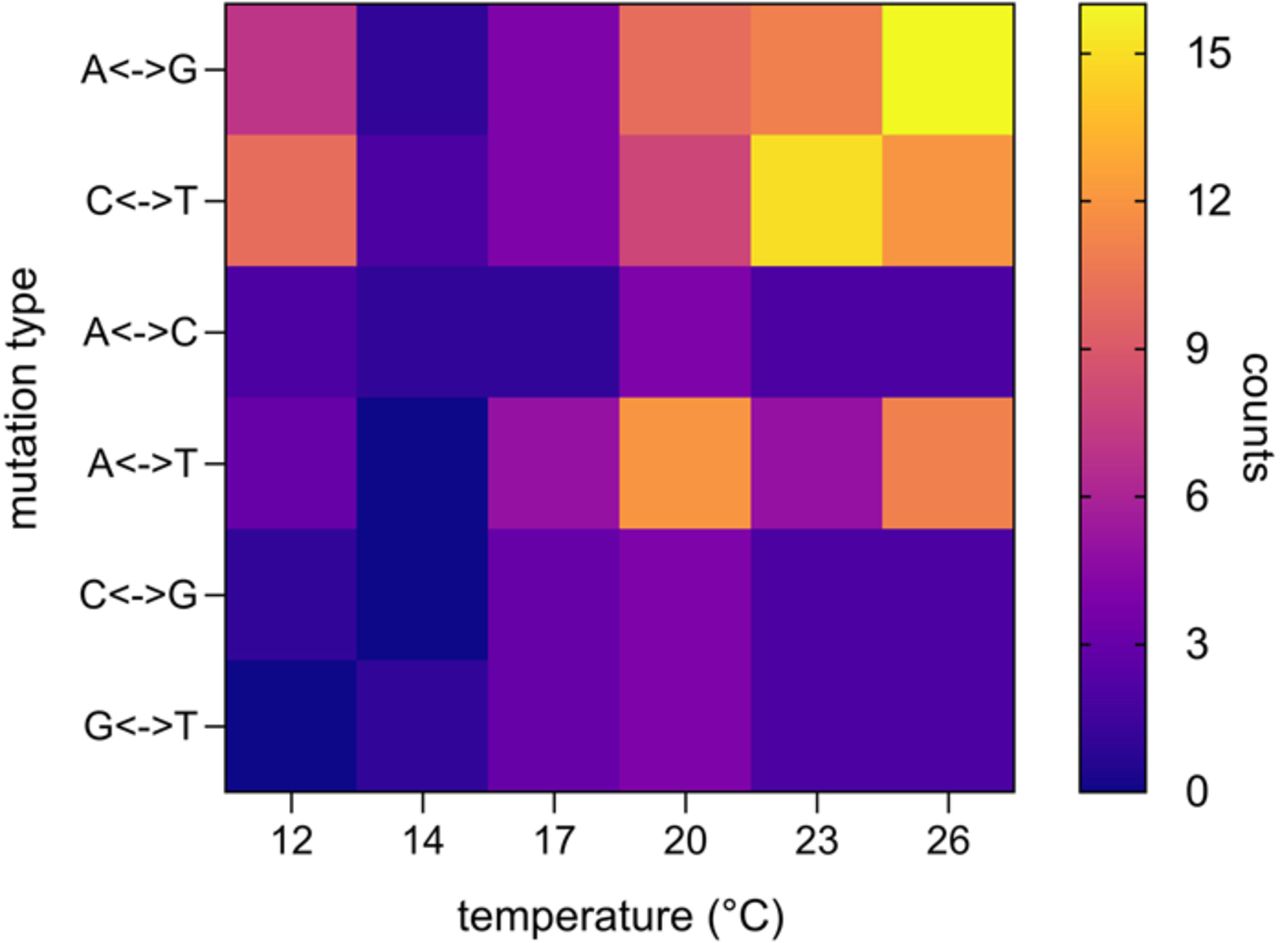
Our data allow a more fine-scaled resolution of the mutation spectrum, and we found temperature to have a significant effect on mutation types (F = 4.94, P = 0.0028), explaining 28% of the total variation (Fig. 3). Transition-transversion ratios shifted from a dominance of transversions at intermediate temperatures to a dominance of transitions at extreme temperatures (Table 1; Supplemental Fig. S2). The detailed pattern also revealed an increase in frequency of all four transition types at extreme temperatures, whereas the effect on transversions was unidirectional with increasing temperatures and mostly due to an increase of A/T mutations (Fig. 2).
Heat map of detected SNM types per experimental temperature. Transitions in rows 1 and 2, transversions in rows 3 to 6. Different mutation types explain 43% (F = 7.52, P = 0.0002) and temperatures 28% (F = 4.94, P = 0.0028) of the total variance.
Discussion
Ambient temperature affects mutation rates
To provide a fine-scale resolution of the relation between temperature and µ, we report here directly estimated spontaneous single nucleotide mutation rates in the nonbiting midge C. riparius under different temperature regimes. The temperature range chosen in our study covers the natural thermal conditions of physiological and developmental activity and the expected natural tolerance for the origin of the population. Temperatures below 12°C will generally induce developmental pausing for larval overwintering (Oppold et al. 2016) and temperatures constantly above 26°C lead to significant negative fitness effects (Nemec et al. 2013), especially in nonadapted populations such as the laboratory strain chosen here. Fitness effects due to increased temperature stress might at least partially explain the loss of MALs at both temperature extremes (Vogt et al. 2007), which also reveals the limited breadth of temperature tolerance of the species. Nevertheless, the number of accumulated de novo mutations along all MALs of the different temperatures was sufficient to allow for estimation of robust mutation rates. The µ estimates of the 20°C experiment are directly comparable to the previously reported µ for C. riparius (Oppold and Pfenninger 2017; see Supplemental Table S1), and the magnitude is comparable to µ estimates of several other insects, for example, D. melanogaster (2.8 × 10⁻⁹) (Keightley et al. 2014) and Heliconius melpomene (2.9 × 10⁻⁹) (Keightley et al. 2015).
Significantly exceeding mean µ estimates at different temperatures, we detected five so-called mutator lines (see above and Supplemental Table S2). The spontaneous occurrence of mutator lines is a known phenomenon for MAL experiments (Haag-Liautard et al. 2008; Schrider et al. 2013) and has also been previously observed in C. riparius (Doria et al. 2021). As reported by Doria et al. (2021) and contrasting with the observation in Drosophila (Schrider et al. 2013), mutator alleles most probably arose along the course of our experiment because all other lines deriving from the same ancestral parents produced offspring with normal rates. We can thus rule out a natural background to cause the extraordinary increase in mutation rates. However, the number of observed mutator lines does not allow for a conclusion as to whether their occurrence across temperatures has a nonrandom distribution. Given that mutator lines are most likely to accumulate a high number of deleterious mutations, it can be assumed that the extinction of a MAL marks the expected final outcome of a mutator line. Therefore, it is hardly possible to disentangle effects of classical inbreeding depression under temperature stress from the effect assumed here of temperature directly driving the occurrence of deleterious mutations. It is furthermore likely that many mutation accumulation experiments that last over a higher number of generations (Denver et al. 2000; Krasovec et al. 2019) miss out on this phenomenon by the fast accumulation of deleterious mutations and the subsequent loss of lines.
Temperature dependence of spontaneous mutation rates in C. riparius
Our results deliver unequivocal empirical evidence to reject the H0: Single nucleotide mutation rates are not constant within C. riparius but depend on temperature, with a minimal rate at an optimum temperature. Such a relation was theoretically assumed (Baer et al. 2007), but empirical evidence was largely lacking. Before the present study, only Ogur and colleagues (1960) documented the effects of a fine-scaled, wider temperature range on spontaneous mutations in Saccharomyces species 60 years ago. They used respiration deficiency as a phenotypic mutation proxy and found a U-shaped relation, similar to what we found for nucleotide mutations in our whole-genome scale approach in a multicellular organism (Fig. 2). Other studies were restricted either to only partially covering the respective species’ physiological temperature range and/or extreme temperatures that would a priori evoke stressful conditions for the species of choice (e.g., Matsuba et al. 2013; Chu et al. 2018).
There are a few mechanistic hypotheses that could explain the observed pattern (Baer et al. 2007; Thomas et al. 2010; Chu et al. 2018). The metabolic rate hypothesis (MH) suggests that increased metabolic activity leads to the production of free oxygen radicals (ROS), faster than can be effectively eliminated by the organismal antioxidative stress response, which act as endogenous mutagens (Lushchak 2011). As ambient temperature determines the metabolic rate of ectotherm organisms, µ should rise with temperature as a consequence of increased oxidative stress, which causes DNA damage and, as a result, sometimes erroneous repair (Barzilai and Yamamoto 2004). The effect of high temperatures leading to increased mutation rates has been documented for almost a century (Muller 1928; Timofeeff-Ressovsky 1936; Lindgren 1972; Gillooly et al. 2005; Matsuba et al. 2013), and recent experiments with Escherichia coli (Chu et al. 2018) and Arabidopsis thaliana (Belfield et al. 2021) underline this. However, it is well established that low temperatures can also induce oxidative stress, even though the mechanisms are not well known (Lalouette et al. 2011). Antioxidative stress response to both high and low temperatures was, for example, observed in C. riparius (Park and Kwak 2014). It was speculated that low temperatures either weaken the systems of ROS elimination and/or enhance ROS production (Lushchak 2011). In our experiments, the number of successful MALs and their respective amount of generational passages (Fig. 2) reveal the increased stress-level at both of the two extreme temperatures. At 12°C and 26°C, all MALs were lost after the second generation, whereas the majority of lines reached the fifth generation of mutation accumulation at the intermediate temperatures of 17°C, 20°C, and 23°C. Metabolic effects alone could therefore explain the observed pattern.
However, a negative correlation between temperature and µ could also arise from the positive relation between ambient temperature and generation times in the ectotherm C. riparius (Oppold et al. 2016). Whatever mutagens are acting (endogenous ROS production, COSMIC rays), their time to induce mutations in the germline should increase with generation time. One could term this the generation length hypothesis (GL). Several studies lend support for the GL: in primates, µ can be predicted via the reproductive longevity (Thomas et al. 2018) and the mammalian male mutation bias is higher for species with long generation times (Goetting-Minesky and Makova 2006). There is evidence that this effect does not depend on the absolute number of cell divisions (Wu et al. 2020). Also, in invertebrates, there is significant evidence for a correlation between rates of molecular evolution and generation times (Thomas et al. 2010). Even though these studies investigated only the relation between temperature-independent generation time and µ, their results implied that the temperature-dependent changes in generation time of ectotherms could impact µ. Direct support comes from temperature experiments impacting on life-history and µ in seed beetles (Berger et al. 2017). Martin and Palumbi (1993) already concluded from their comparative analysis on the relation of body size, metabolic rate, generation time, and the molecular clock that our understanding of molecular evolution could be improved when reconsidering “the generation time hypothesis to include physiological effects such as the metabolic rate.”
There is empirical evidence for all of these processes to play a role (Baer et al. 2007), leading to potentially complex interactions in each particular case. The U-shaped relation between µ and temperature discovered here could therefore be either due to increased oxidative stress toward physiological extreme temperatures (MH) and/or an interaction with inversely increasing generation times with decreasing temperatures (GL). As generation time and metabolism are intricately linked in ectotherm organisms, additional studies separating these effects are necessary to infer the acting processes.
Temperature effects on the mutational spectrum
The transition bias describes a common pattern in which nucleotide transitions are favored over transversions in molecular evolution (Stoltzfus and Norris 2016). However, the cause has not yet been resolved. A tendency toward an enrichment of transitions has also been observed in a previous study on the mutational spectrum in C. riparius (Oppold and Pfenninger 2017). In the present study, the pattern is less clear and we observe a tendential shift from a transition dominance at extreme temperatures to a transversion dominance at intermediate temperatures (Table 2; Supplemental Fig. S1). Even though a higher number of SNMs is required to fully resolve this tendency, this finding is particularly interesting with regard to the ongoing debate on two alternative hypotheses to explain the transition bias: a selective (Wakeley 1996; Rosenberg et al. 2003) or mutational (Vogel and Kopun 1977; Gojobori et al. 1982) mechanism. With regard to our experimental design of mutation accumulation, we can neglect selection in favor of “less severe” biochemical amino acid changes due to transitions and thus reject the “transition bias due to selection” hypothesis. Referring to the mutational mechanisms, it has already been discussed that the extraordinarily high AT content (69%) of the C. riparius genome may at least statistically impact the mutation spectrum of the species (Oppold and Pfenninger 2017).
The temperature-dependent mutation spectrum observed for C. riparius provides important evidence that temperature is more than a general stress factor acting on mutational processes, though a study comparing the effect of temperature stress on spontaneous mutations in nematodes claims otherwise (Matsuba et al. 2013). The differences in the mutation spectrum suggest that temperature as a bipolar factor is shaping mutational variation through different molecular mechanisms.
Implications for the variation of mutation rates in natural populations
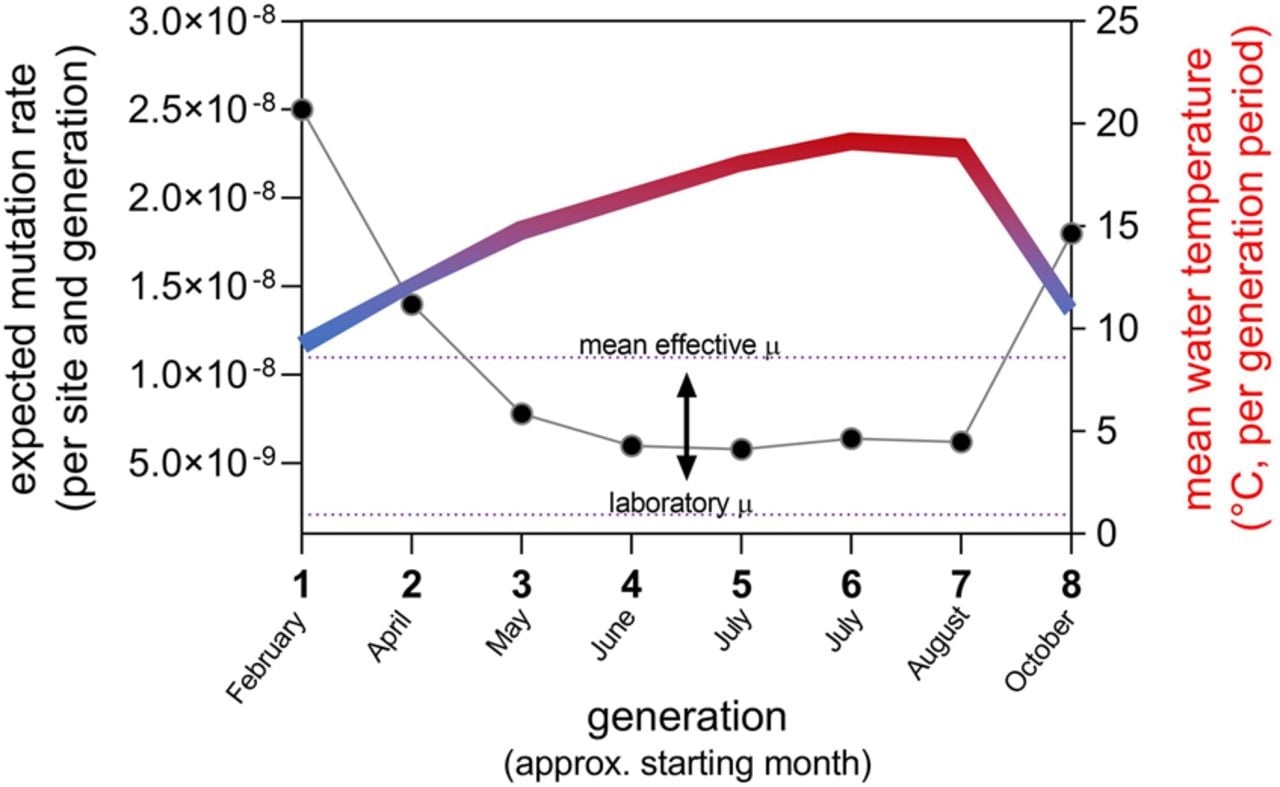
Our observation that µ varies significantly in response to environmental temperature has important implications for mutation-dependent processes in molecular evolution, processes shaping the evolution of mutation rates, and even the evolution of biodiversity as such. Temperature as an abiotic environmental factor is considered to hold a key position at the interface of ecology and evolution for its influence on organismal physiology (Clarke and Fraser 2004), population divergence (Waldvogel et al. 2018), and now also mutational variability. The substantial variation of µ in response to ambient temperature, and perhaps also other environmental factors, is especially relevant for our understanding of evolutionary processes under natural conditions. For C. riparius, for example, µ in a natural population is expected to vary by a factor of more than four among the successive generations throughout a year in this multivoltine species (Fig. 4). This suggests that the mean effective µ over the generations in a year under natural conditions could be five times higher than measured at a constant standard temperature (20°C) in the laboratory (Oppold and Pfenninger 2017). The effective µ in this model is rather driven by cold temperatures (Fig. 4), with respective consequences for the expected mutational spectrum.
Expected variation of mutation rate calculated per generation for a natural C. riparius field population (left y-axis) with regard to the annual variation in water temperature (Hasselbach in Hesse, Germany) averaged for each generation period (right y-axis). Due to the temperature-dependence of generation times, C. riparius can pass eight generations per year (x-axis). The mean effective µ is 5.29-fold higher than µ measured under laboratory conditions (indicated by arrow) (Oppold and Pfenninger 2017).
Different other population genetic parameters depend on µ, in particular the estimation of the long-term effective population size (Ne) from theta (Charlesworth 2009). Given the variation of µ with regard to the natural temperature range (Fig. 4), it appears advisable to use a mean effective rate to obtain accurate estimates of Ne. The same applies for the estimation of divergence times from sequence divergence data, with the additional complication that, for example, changes in Ne over time may have additionally influenced the baseline µ with regard to the cost-fidelity hypothesis (Sung et al. 2012). Last but not least, the evolutionary speed hypothesis (ESH), aiming to explain the latitudinal biodiversity gradient (Rhode 1992), assumed as one molecular underpinning for faster evolutionary processes in lower latitudes that the higher temperatures in these regions increase µ, leading thus to faster mutation accumulation (Oppold et al. 2016). If, however, the finding of increased µ toward both temperature extremes is a general phenomenon, it would make this particular aspect of the ESH hypothesis obsolete.
Our scenario of mutation variation to be expected in natural populations also raises the question of whether the position of the µ optimum observed here is in itself a species-specific constant or whether this position on the temperature scale can evolve in response to local temperature conditions. Answers to this question will enhance our understanding of the interplay between climate variability and molecular evolution (Pauls et al. 2013).
Methods
Mutation accumulation experiments
The model organism Chironomus riparius used here is a swarm-breeding nonbiting midge with a semi-aquatic life-cycle. After fertilization, females oviposit clutches containing up to 600 eggs, all of which represent full siblings. The experimental setup for mutation accumulation followed the exact procedure described in Oppold and Pfenninger (2017). In short, the experiment started from a single egg clutch of the C. riparius “Laufer” strain, a long-standing laboratory strain with decreased heterozygosity (Nowak et al. 2007). Together, all siblings of this initial egg clutch form the so-called RefPool representing the ancestral genetic state of a single parental pair. Mutation accumulation lines are then initiated with egg clutches of the next generation (single clutch per MAL) (Supplemental Fig. S3). In our previous study (Oppold and Pfenninger 2017), we performed the experiment under constant conditions at 20°C. Simultaneously and now presented in this study, we established MALs at five additional temperatures: 12°C, 14°C, 17°C, 23°C, and 26°C. Ten MALs were initiated for each temperature condition, with additional backup MALs to compensate for the loss of lines due to lethal inbreeding effects.
Whole-genome resequencing
To establish the genetic baseline of the ancestral state against which to compare the genetic state after mutation accumulation, we sequenced all sibling individuals of the RefPool as a pooled sample. As soon as enough egg clutches to start MALs had been collected, head capsules of all adult RefPool individuals were pooled for DNA extraction and pooled sequencing on an Illumina HiSeq platform as a 150-bp paired-end library to an expected coverage of 60–80×. After mutation accumulation across generations, a single female midge of each MAL was whole-genome sequenced on an Illumina HiSeq platform as 150-bp paired-end library to an expected mean coverage of 25× (see Oppold and Pfenninger 2017 for details).
Whole-genome sequencing data of RefPools and individuals per MAL were cleaned from adapters and quality trimmed using the automatic wrapper script autotrim (available at https://github.com/schellt/autotrim). Genomic data of the 20°C mutation accumulation experiment (RefPool R1 and 20°C MAL) have already been analyzed in our previous study (Oppold and Pfenninger 2017), though mapped to an older genome assembly version. To make use of the more complete and less fragmented genome assembly, cleaned reads of RefPool and MALs (including the data published in Oppold and Pfenninger 2017) were mapped against the latest version of the C. riparius genome assembly (Schmidt et al. 2020) with masked repeat- and TE-regions (see Schmidt et al. 2020 for TE- and repeat-library) and excluding sequences of the mitochondrial genome. We used the Burrows–Wheeler Aligner BWA-MEM (0.7.17-r1188) (Li and Durbin 2009) for mapping and followed the GATK best practices pipeline (McKenna et al. 2010) to remove duplicates (Picard tools v2.20.8) (https://broadinstitute.github.io/picard/), realignment around indels (insertions and deletions, supported by GATK version 4), and recalibration of bases.
Estimation of spontaneous mutation rates
We define de novo mutations to be single base exchanges (hereafter called single nucleotide mutations, SNMs) and single base insertions and deletions (hereafter called single nucleotide indels, SNIs) that happen in the germline and are thus inherited to the next generation. After a defined number of generational passages (mutation accumulation) and when compared against an ancestral genotype(s), de novo mutations can be identified to be novel and unique to a respective MAL. For the bioinformatics pipeline, this means that genome scans of the RefPool and all MALs are compared per site along the reference genome, whereas the basic criteria for a de novo mutation is its absence in the RefPool and in all but one MAL. When relating to the ancestral genotypes of the pair fostering the MALs of an experiment, the lowest possible true frequency of an allele in the RefPool genome scan is 0.25 (parental alleles were sequenced through the pool of their offspring; see above). We can thus rule out the conflictual detection of low-frequency alleles because the probability of missing such an allele in the RefPool and all but one MAL is exceedingly low. Although these criteria are obviously straightforward, their application to whole-genome data required a stringent control for base and read quality to avoid false positives as well as false negatives. We therefore combined the statistical approach for genome-wide detection of de novo mutations (Keightley et al. 2014; Oppold and Pfenninger 2017) with a probabilistic mutation calling approach (Winter et al. 2018). Although SNIs can only be detected via the statistical approach, the probabilistic mutation calling implemented in the tool accuMUlate (Winter et al. 2018) allowed for a more sensitive detection of SNMs, lowering the false negative rate. In short, the probability that a given site in a genomic alignment contains at least one mutation is calculated from a model that directly reflects the design of MA experiments. Each set of MAL samples per temperature was accordingly compared against its respective RefPool . For the statistical approach, each MAL sample was analyzed as a separate BAM file, whereas accuMUlate requires the input of one overall BAM file into which all MAL samples per temperature, including the respective RefPool, were merged. accuMUlate output was further filtered according to the following criteria (see Winter et al. 2018 for description of categories): probability of a mutation ≥0.9, probability of one mutation ≥0.9, probability of correct descendant genotype ≥0.9, minimum depth = nMAL · 15 × + 15×, maximum depth = nMAL · 47 × + 195×, number of mutant alleles in RefPool = 0, mapping quality difference ≤1.96, insert size difference ≤1.96, strand bias ≥0.05, pair-mapping rate difference ≥0.05. For the calculation of mutation rates and to compensate for coverage variation among samples (Supplemental Data 1), we used the separate BAM files to more precisely define the number of callable sites for each sample (details described in Oppold and Pfenninger 2017) as direct divisor, instead of using the denominator of the accuMUlate package. Finally, the combination of the two mutation detection approaches gave us the most robust and comprehensive set of de novo mutation candidates, all of which were visually curated in the Integrative Genomics Viewer (IGV) (v2.6.3) (Thorvaldsdottir et al. 2013), excluding SNMs in the 23°C mutator lines (see below). To account for the possibility that mutator alleles can arise and become fixed within a single MAL, as has been shown in other mutation accumulation studies before (Schrider et al. 2013, Doria et al. 2021), we set a conservative threshold of a fourfold increase in mutation rates compared to mutation rates of the same temperature treatment to define a so-called mutator line. We tested for random distribution of MALs with zero de novo mutations performing a χ2 test with degrees of freedom df = 5.
Test on temperature dependence of rates
To account for the Poisson distribution of our data (mutation counts), we used a Bayesian framework (R package Bayesian First Aid) (Bååth 2014) to infer credible intervals (95% highest density intervals of posterior distributions) and to test differences between rates of different temperatures. To allow for the observation of zero mutations, the model uses Jeffreys prior on lambda. The posterior distribution was sampled with default values (three chains, 5000 iterations). Posterior probability indicates support of rate ratios. Non-overlapping HDIs of two rates give decisive support for differences between temperatures. Second-order polynomial regression was fitted to mean mutation rates per temperature, independent of the Bayesian 95% HDIs. Model fit of the polynomial regression was additionally compared to a linear regression by means of the Akaike information criterion.
Differences in numbers of mutation types between temperatures were tested as two-way ANOVA with Tukey's multiple comparisons post-test. Transitions and transversions were not grouped within the analysis.
Estimation of mutational variation for a natural population
Daily water temperature data for a C. riparius population in a small river (Hasselbach, Hessen, Germany 50.167562°N, 9.083542°E) of a nearby waste water treatment plant were analyzed for the years 2009–2018. A population model of the temperature dependence of the generation time was fitted to the averaged data to obtain the number and length of the seasonal generations. The mean water temperature for each generation was then used to infer the expected µ from the second-order polynomial function fitted on the relation between experimental temperature and µ (Fig 2, top).
Data access
All raw and processed sequencing data generated in this study have been submitted to the European Nucleotide Archive (ENA; https://www.ebi.ac.uk/ena/browser/home) under accession number PRJEB44550. Detailed lists of de novo mutations and Bayesian estimates are available as Supplemental Data 1 and 2.
Competing interest statement
The authors declare no competing interests.
Acknowledgments
We thank Timm Knautz for his assistance during the experiments, and we acknowledge that the “Abwasserverband Freigericht” generously provided the temperature data of the Hasselbach which we used to infer mutation rates in a natural habitat. This study was funded by the Senckenberg Gesellschaft für Naturforschung.
Notes
[1] Supplementary material [Supplemental material is available for this article.]
[2] Article published online before print. Article, supplemental material, and publication date are at https://www.genome.org/cgi/doi/10.1101/gr.275168.120.
References
- ↵Agrawal AF. 2002. Genetic loads under fitness-dependent mutation rates. J Evol Biol 15: 1004–1010. 10.1046/j.1420-9101.2002.00464.x
- ↵Bååth R. 2014. Bayesian first aid: a package that implements Bayesian alternatives to the classical *.test functions in R. Proc UseR 33: 2.
- ↵Baer CF, Phillips N, Ostrow D, Avalos A, Blanton D, Boggs A, Keller T, Levy L, Mezerhane E. 2006. Cumulative effects of spontaneous mutations for fitness in Caenorhabditis: role of genotype, environment and stress. Genetics 174: 1387–1395. 10.1534/genetics.106.061200
- ↵Baer CF, Miyamoto MM, Denver DR. 2007. Mutation rate variation in multicellular eukaryotes: causes and consequences. Nat Rev Genet 8: 619–631. 10.1038/nrg2158
- ↵Barzilai A, Yamamoto KI. 2004. DNA damage responses to oxidative stress. DNA Repair (Amst) 3: 1109–1115. 10.1016/j.dnarep.2004.03.002
- ↵Belfield EJ, Brown C, Ding ZJ, Chapman L, Luo M, Hinde E, van Es SW, Johnson S, Ning Y, Zheng SJ, 2021. Thermal stress accelerates Arabidopsis thaliana mutation rate. Genome Res 31: 40–50. 10.1101/gr.259853.119
- ↵Berger D, Stångberg J, Grieshop K, Martinossi-Allibert I, Arnqvist G. 2017. Temperature effects on life-history trade-offs, germline maintenance and mutation rate under simulated climate warming. Proc Biol Sci 284: 20171721. 10.1098/rspb.2017.1721
- ↵Birkina BN. 1938. The effect of low temperature on the mutation process in Drosophila melanogaster. Biol. Zh 7: 653–660.
- ↵Carlson J, Locke AE, Flickinger M, Zawistowski M, Levy S, Myers RM, Boehnke M, Kang HM, Scott LJ, Li JZ, 2018. Extremely rare variants reveal patterns of germline mutation rate heterogeneity in humans. Nat Commun 9: 3753. 10.1038/s41467-018-05936-5
- ↵Charlesworth B. 2009. Effective population size and patterns of molecular evolution and variation. Nat Rev Genet 10: 195–205. 10.1038/nrg2526
- ↵Chu XL, Zhang BW, Zhang QG, Zhu BR, Lin K, Zhang DY. 2018. Temperature responses of mutation rate and mutational spectrum in an Escherichia coli strain and the correlation with metabolic rate. BMC Evol Biol 18: 126. 10.1186/s12862-018-1252-8
- ↵Clarke A, Fraser KPP. 2004. Why does metabolism scale with temperature? Funct Ecol 18: 243–251. 10.1111/j.0269-8463.2004.00841.x
- ↵Demerec M. 1937. Frequency of spontaneous mutations in certain stocks of Drosophila melanogaster. Genetics 22: 469–478. 10.1093/genetics/22.5.469
- ↵Denver DR, Morris K, Lynch M, Vassilieva LL, Thomas WK, Vigilant L, Stoneking M, Harpending H, Hawkes K, Wilson AC, 2000. High direct estimate of the mutation rate in the mitochondrial genome of Caenorhabditis elegans. Science 289: 2342–2344. 10.1126/science.289.5488.2342
- ↵Dillon MM, Sung W, Lynch M, Cooper VS. 2018. Periodic variation of mutation rates in bacterial genomes associated with replication timing. mBio 9: 2020. 10.1128/mBio.01371-18
- ↵Doria HB, Waldvogel AM, Pfenninger M. 2021. Measuring mutagenicity in ecotoxicology: a case study of Cd exposure in Chironomus riparius. Environ Pollut 272: 116004. 10.1016/j.envpol.2020.116004
- ↵Flynn JM, Chain FJJ, Schoen DJ, Cristescu ME. 2017. Spontaneous mutation accumulation in Daphnia pulex in selection-free vs. competitive environments. Mol Biol Evol 34: 160–173. 10.1093/molbev/msw234
- ↵Foucault Q, Wieser A, Waldvogel A-M, Pfenninger M. 2019. Establishing laboratory cultures and performing ecological and evolutionary experiments with the emerging model species Chironomus riparius. J Appl Entomol 143: 584–592. 10.1111/jen.12606
- ↵Garcia AM, Calder RB, Dollé MET, Lundell M, Kapahi P, Vijg J. 2010. Age- and temperature-dependent somatic mutation accumulation in Drosophila melanogaster. PLoS Genet 6: e1000950. 10.1371/journal.pgen.1000950
- ↵Gibson G. 2005. Mutation accumulation of the transcriptome. Nat Genet 37: 458–460. 10.1038/ng0505-458
- ↵Gillooly JF, Allen AP, West GB, Brown JH. 2005. The rate of DNA evolution: effects of body size and temperature on the molecular clock. Proc Natl Acad Sci 102: 140–145. 10.1073/pnas.0407735101
- ↵Goetting-Minesky MP, Makova KD. 2006. Mammalian male mutation bias: impacts of generation time and regional variation in substitution rates. J Mol Evol 63: 537–544. 10.1007/s00239-005-0308-8
- ↵Gojobori T, Li WH, Graur D. 1982. Patterns of nucleotide substitution in pseudogenes and functional genes. J Mol Evol 18: 360–369. 10.1007/BF01733904
- ↵Haag-Liautard C, Coffey N, Houle D, Lynch M, Charlesworth B, Keightley PD. 2008. Direct estimation of the mitochondrial DNA mutation rate in Drosophila melanogaster. PLoS Biol 6: 1706–1714. 10.1371/journal.pbio.0060204
- ↵Hodgkinson A, Eyre-Walker A. 2011. Variation in the mutation rate across mammalian genomes. Nat Rev Genet 12: 756–766. 10.1038/nrg3098
- ↵Keightley PD, Ness RW, Halligan DL, Haddrill PR. 2014. Estimation of the spontaneous mutation rate per nucleotide site in a Drosophila melanogaster full-sib family. Genetics 196: 313–320. 10.1534/genetics.113.158758
- ↵Keightley PD, Pinharanda A, Ness RW, Simpson F, Dasmahapatra KK, Mallet J, Davey JW, Jiggins CD. 2015. Estimation of the spontaneous mutation rate in Heliconius melpomene. Mol Biol Evol 32: 239–243. 10.1093/molbev/msu302
- ↵Kerkis J. 1941. The effect of low temperature on the mutation frequency in D. melanogaster with consideration about the cause of mutation in nature. Drosoph Inform Serv 15: 25.
- ↵Krasovec M, Sanchez-Brosseau S, Piganeau G. 2019. First estimation of the spontaneous mutation rate in diatoms. Genome Biol Evol 11: 1829–1837. 10.1093/gbe/evz130
- ↵Krasovec M, Rickaby REM, Filatov DA. 2020. Evolution of mutation rate in astronomically large phytoplankton populations. Genome Biol Evol 12: 1051–1059. 10.1093/gbe/evaa131
- ↵Lalouette L, Williams CM, Hervant F, Sinclair BJ, Renault D. 2011. Metabolic rate and oxidative stress in insects exposed to low temperature thermal fluctuations. Comp Biochem Physiol A Mol Integr Physiol 158: 229–234. 10.1016/j.cbpa.2010.11.007
- ↵Lee H, Popodi E, Tang H, Foster PL. 2012. Rate and molecular spectrum of spontaneous mutations in the bacterium Escherichia coli as determined by whole-genome sequencing. Proc Natl Acad Sci 109: E2774–E2783. 10.1073/pnas.1210309109
- ↵Li H, Durbin R. 2009. Fast and accurate short read alignment with Burrows–Wheeler transform. Bioinformatics 25: 1754–1760. 10.1093/bioinformatics/btp324
- ↵Lindgren D. 1972. The temperature influence on the spontaneous mutation rate. I. Literature review. Hereditas 70: 165–177. 10.1111/j.1601-5223.1972.tb01377.x
- ↵Lushchak VI. 2011. Environmentally induced oxidative stress in aquatic animals. Aquat Toxicol 101: 13–30. 10.1016/j.aquatox.2010.10.006
- ↵Lynch M. 2010. Evolution of the mutation rate. Trends Genet 26: 345–352. 10.1016/j.tig.2010.05.003
- ↵Martin AP, Palumbi SR. 1993. Body size, metabolic rate, generation time, and the molecular clock. Proc Natl Acad Sci 90: 4087–4091. 10.1073/pnas.90.9.4087
- ↵Matsuba C, Ostrow DG, Salomon MP, Tolani A, Baer CF. 2013. Temperature, stress and spontaneous mutation in Caenorhabditis briggsae and Caenorhabditis elegans. Biol Lett 9: 20120334. 10.1098/rsbl.2012.0334
- ↵McKenna A, Hanna M, Banks E, Sivachenko A, Cibulskis K, Kernytsky A, Garimella K, Altshuler D, Gabriel S, Daly M, 2010. The Genome Analysis Toolkit: a MapReduce framework for analyzing next-generation DNA sequencing data. Genome Res 20: 1297–1303. 10.1101/gr.107524.110
- ↵Muller HJ. 1928. The measurement of gene mutation rate in Drosophila, its high variability, and its dependence upon temperature. Genetics 13: 279–357. 10.1093/genetics/13.4.279
- ↵Nemec S, Patel S, Nowak C, Pfenninger M. 2013. Evolutionary determinants of population differences in population growth rate × habitat temperature interactions in Chironomus riparius. Oecologia 172: 585–594. 10.1007/s00442-012-2517-3
- ↵Nowak C, Vogt C, Diogo JB, Schwenk K. 2007. Genetic impoverishment in laboratory cultures of the test organism Chironomus riparius. Environ Toxicol Chem 26: 1018. 10.1897/06-349R.1
- ↵Ogur M, Ogur S, St. John R. 1960. Temperature dependence of the spontaneous mutation rate to respiration deficiency in Saccharomyces. Genetics 45: 189–194. 10.1093/genetics/45.2.189
- ↵Oppold AM, Pfenninger M. 2017. Direct estimation of the spontaneous mutation rate by short-term mutation accumulation lines in Chironomus riparius. Evol Lett 1: 86–92. 10.1101/086207
- ↵Oppold A-M, Pedrosa JA, Bálint M, Diogo JB, Ilkova J, Pestana JL, Pfenninger M. 2016. Support for the evolutionary speed hypothesis from intraspecific population genetic data in the non-biting midge Chironomus riparius. Proc Biol Sci 283: 20152413. 10.1098/rspb.2015.2413
- ↵Park K, Kwak IS. 2014. The effect of temperature gradients on endocrine signaling and antioxidant gene expression during Chironomus riparius development. Sci Total Environ 470-471: 1003–1011. 10.1016/j.scitotenv.2013.10.052
- ↵Pauls SU, Nowak C, Bálint M, Pfenninger M. 2013. The impact of global climate change on genetic diversity within populations and species. Mol Ecol 22: 925–946. 10.1111/mec.12152
- ↵Pfenninger M, Binde Doria H, Nickel J, Thielsch A, Schwenk K, Cordellier M. 2020. Spontaneous rate of clonal mutations in Daphnia galeata. bioRxiv 10.1101/2020.08.31.275495
- ↵Ramiro RS, Durão P, Bank C, Gordo I. 2020. Low mutational load and high mutation rate variation in gut commensal bacteria. PLoS Biol 18: e3000617. 10.1371/journal.pbio.3000617
- ↵Rhode K. 1992. Latitudinal gradients in species diversity: the search for the primary cause. Oikos 65: 514–527. 10.2307/3545569
- ↵Rosenberg MS, Subramanian S, Kumar S. 2003. Patterns of transitional mutation biases within and among mammalian genomes. Mol Biol Evol 20: 988–993. 10.1093/molbev/msg113
- ↵Schmidt H, Hellmann SL, Waldvogel AM, Feldmeyer B, Hankeln T, Pfenninger M. 2020. A high-quality genome assembly from short and long reads for the non-biting midge Chironomus riparius (Diptera). G3 (Bethesda) 10: 1151–1157. 10.1534/g3.119.400710
- ↵Schrider DR, Houle D, Lynch M, Hahn MW. 2013. Rates and genomic consequences of spontaneous mutational events in Drosophila melanogaster. Genetics 194: 937–954. 10.1534/genetics.113.151670
- ↵Sharp NP, Agrawal AF. 2012. Evidence for elevated mutation rates in low-quality genotypes. Proc Natl Acad Sci 109: 6142–6146. 10.1073/pnas.1118918109
- ↵Stoltzfus A, Norris RW. 2016. On the causes of evolutionary transition:transversion bias. Mol Biol Evol 33: 595–602. 10.1093/molbev/msv274
- ↵Sung W, Ackerman MS, Miller SF, Doak TG, Lynch M. 2012. Drift-barrier hypothesis and mutation-rate evolution. Proc Natl Acad Sci 109: 18488–18492. 10.1073/pnas.1216223109
- ↵Sutherland WJ, Watkinson AR. 1986. Somatic mutation: do plants evolve differently? Nature 320: 305. 10.1038/320305a0
- ↵Thomas JA, Welch JJ, Lanfear R, Bromham L. 2010. A generation time effect on the rate of molecular evolution in invertebrates. Mol Biol Evol 27: 1173–1180. 10.1093/molbev/msq009
- ↵Thomas GWC, Wang RJ, Puri A, Harris RA, Raveendran M, Hughes DST, Murali SC, Williams LE, Doddapaneni H, Muzny DM, 2018. Reproductive longevity predicts mutation rates in primates. Curr Biol 28: 3193–3197.e5. 10.1016/j.cub.2018.08.050
- ↵Thorvaldsdottir H, Robinson JT, Mesirov JP. 2013. Integrative Genomics Viewer (IGV): high-performance genomics data visualization and exploration. Brief Bioinform 14: 178–192. 10.1093/bib/bbs017
- ↵Timofeeff-Ressovsky NW. 1936. Qualitativer Vergleich der Mutabilität von Drosophila funebris und D. melanogaster. Z Indukt Abstamm Vererbungsl 71: 276–280.
- ↵Vogel F, Kopun M. 1977. Higher frequencies of transitions among point mutations. J Mol Evol 9: 159–180. 10.1007/BF01732746
- ↵Vogt C, Pupp A, Nowak C, Jagodzinski LS, Baumann J, Jost D, Oetken M, Oehlmann J. 2007. Interaction between genetic diversity and temperature stress on life-cycle parameters and genetic variability in midge Chironomus riparius populations. Clim Res 33: 207–214. 10.3354/cr033207
- ↵Wakeley J. 1996. The excess of transitions among nucleotide substitutions: new methods of estimating transition bias underscore its significance. Trends Ecol Evol 11: 158–162. 10.1016/0169-5347(96)10009-4
- ↵Waldvogel AM, Wieser A, Schell T, Patel S, Schmidt H, Hankeln T, Feldmeyer B, Pfenninger M. 2018. The genomic footprint of climate adaptation in Chironomus riparius. Mol Ecol 27: 1439–1456. 10.1111/mec.14543
- ↵Wang L, Ji Y, Hu Y, Hu H, Jia X, Jiang M, Zhang X, Zhao L, Zhang Y, Jia Y, 2019. The architecture of intra-organism mutation rate variation in plants. PLoS Biol 17: e3000191. 10.1371/journal.pbio.3000191
- ↵Winter DJ, Wu SH, Howell AA, Azevedo RBR, Zufall RA, Cartwright RA. 2018. accuMUlate: a mutation caller designed for mutation accumulation experiments. Bioinformatics 34: 2659–2660. 10.1093/bioinformatics/bty165
- ↵Wu FL, Strand AI, Cox LA, Ober C, Wall JD, Moorjani P, Przeworski M. 2020. A comparison of humans and baboons suggests germline mutation rates do not track cell divisions. PLoS Biol 18: e3000838. 10.1371/journal.pbio.3000838