
Polycomb-dependent differential chromatin compartmentalization determines gene coregulation in Arabidopsis
- Ying Huang1,
- Sanchari Sicar1,
- Juan S. Ramirez-Prado1,
- Deborah Manza-Mianza1,
- Javier Antunez-Sanchez2,
- Rim Brik-Chaouche1,
- Natalia Y. Rodriguez-Granados1,
- Jing An1,
- Catherine Bergounioux1,
- Magdy M. Mahfouz3,
- Heribert Hirt1,3,
- Martin Crespi1,
- Lorenzo Concia1,4,
- Fredy Barneche4,
- Simon Amiard5,
- Aline V. Probst5,
- Jose Gutierrez-Marcos2,
- Federico Ariel6,
- Cécile Raynaud1,
- David Latrasse1 and
- Moussa Benhamed1,7,8
- 1Université Paris-Saclay, CNRS, INRAE, Univ Evry, Institute of Plant Sciences Paris-Saclay (IPS2), 91405, Orsay, France;
- 2School of Life Science, University of Warwick, Coventry CV4 7AL, United Kingdom;
- 3Division of Biological and Environmental Sciences and Engineering, King Abdullah University of Science and Technology, Thuwal 23955-6900, Kingdom of Saudi Arabia;
- 4Institut de Biologie de l'Ecole Normale Supérieure (IBENS), ENS, CNRS UMR8197, INSERM U1024, PSL Research University, 75005, Paris, France;
- 5GReD, Université Clermont Auvergne, CNRS, INSERM, BP 38, 63001, Clermont-Ferrand, France;
- 6Instituto de Agrobiotecnología del Litoral, CONICET, Universidad Nacional del Litoral, 3000, Santa Fe, Argentina;
- 7Université de Paris, Institute of Plant Sciences Paris-Saclay (IPS2), F-75006 Paris, France;
- 8Institut Universitaire de France (IUF)
Abstract
In animals, distant H3K27me3-marked Polycomb targets can establish physical interactions forming repressive chromatin hubs. In plants, growing evidence suggests that H3K27me3 acts directly or indirectly to regulate chromatin interactions, although how this histone modification modulates 3D chromatin architecture remains elusive. To decipher the impact of the dynamic deposition of H3K27me3 on the Arabidopsis thaliana nuclear interactome, we combined genetics, transcriptomics, and several 3D epigenomic approaches. By analyzing mutants defective for histone H3K27 methylation or demethylation, we uncovered the crucial role of this chromatin mark in short- and previously unnoticed long-range chromatin loop formation. We found that a reduction in H3K27me3 levels led to a decrease in the interactions within Polycomb-associated repressive domains. Regions with lower H3K27me3 levels in the H3K27 methyltransferase clf mutant established new interactions with regions marked with H3K9ac, a histone modification associated with active transcription, indicating that a reduction in H3K27me3 levels induces a global reconfiguration of chromatin architecture. Altogether, our results reveal that the 3D genome organization is tightly linked to reversible histone modifications that govern chromatin interactions. Consequently, nuclear organization dynamics shapes the transcriptional reprogramming during plant development and places H3K27me3 as a key feature in the coregulation of distant genes.
Gene expression regulation underlying eukaryotic cell differentiation depends largely on covalent modifications of nuclear chromatin, including histone modifications (Ahmad et al. 2010). It has been shown that histone modifications alter chromatin condensation, which ultimately affects global genome topology in the nucleus, as well as the local chromatin 3D conformation, thereby modulating the accessibility of specific loci to the transcriptional machinery (Rodriguez-Granados et al. 2016; Huang et al. 2020). In the last few years, the concept of genetic information encoded in a linear sequence of nucleotides associated with histones has evolved into a more comprehensive viewpoint considering the dynamic 3D architecture of the cell nucleus (Misteli 2007). From this perspective, structural elements such as loops, domains, territories, and factories emerge as crucial functional features controlling the physical interaction between promoters and distant regulatory elements (Sutherland and Bickmore 2009), as well as the spatial organization of transcriptional hubs. Consequently, nuclear organization dynamics appear as an integrator of developmental and environmental signals (Huang et al. 2020).
The advent of innovative methods to study genome-wide 3D spatial chromatin organization from a molecular perspective, such as Hi-C, HiChIP, and ChlA-PET, made it possible to uncover both small- and large-scale genome architecture in various cell types of metazoan organisms, notably in mammals (Fullwood et al. 2009; Mifsud et al. 2015; Mumbach et al. 2016; Mishra and Hawkins 2017). This has revealed the existence of megabase-long chromatin compartments comprising either active (A compartment) or inactive chromatin (B compartment) (Lieberman-Aiden et al. 2009; Fortin and Hansen 2015; Rowley et al. 2017). Furthermore, it also allowed the identification of topologically associated domains (TADs) as fundamental units of 3D genome organization. TADs are large self-interacting genomic regions (Dixon et al. 2012, 2016; Rocha et al. 2015; Gonzalez-Sandoval and Gasser 2016), which encompass genes displaying similar expression dynamics, suggesting that physical association is functionally relevant for the control of transcriptional activity (Dekker and Heard 2015). Higher-resolution studies have shown that TADs can be further subdivided into compartmental domains, which formation appears to be governed by transcription (Rao et al. 2017; Rowley et al. 2017).
Although plant and metazoan nuclei share certain commonalities, they also display radical differences (Feng et al. 2014; Grob et al. 2014; Rodriguez-Granados et al. 2016; Dong et al. 2017; Mascher et al. 2017; Huang et al. 2020). Notably, plants lack genes encoding CTCF transcription factors, which in animals are key players in the establishment of TADs and chromatin loops (de Wit et al. 2015; Guo et al. 2015). Pioneer Hi-C analyses revealed the absence of TAD-like structures in Arabidopsis thaliana (Feng et al. 2014; Grob et al. 2014; Wang et al. 2015), a phenomenon that has been attributed to the small size of its compact genome, which shows relatively homogenous transcriptional rates and a low density of noncoding regions (Rowley and Corces 2016; Rowley et al. 2017). Recent studies in plants with large and complex genomes revealed the existence of TAD-like domains (Dong et al. 2017, 2018; Liu et al. 2017; Wang et al. 2018; Concia et al. 2020). However, unlike their animal counterparts, these TAD-like structures mainly correspond to large heterochromatic compartments, suggesting that they should rather be referred to as Intergenic CONdensed Spacers (ICONS), because they are not functionally equivalent to TADs (Concia et al. 2020; Huang et al. 2020).
The existence of a large repertoire of histone modifications and variants with distinct physical properties and associated to diverse chromatin states (e.g., constitutive heterochromatin, facultative heterochromatin, euchromatin), allows the establishment of a highly precise cell-specific transcriptional landscape in response to environmental and developmental stimuli (Kouzarides 2007; Eichten et al. 2014). The numerous changing environmental signals perceived by the cell require a pertinent response, which must be accurately modulated with time (Gambino and Pantaleo 2017). Thus, reversible and dynamic histone modifications permit the induction and repression of the appropriate subsets of genes under certain conditions (Pfluger and Wagner 2007). In agreement, protein complexes and enzymes with opposite activity upon histone covalent modifications continuously shape the chromatin environment of target genes. Thus, the so-called writers govern the deposition of a specific covalent histone modification, whereas erasers participate in their removal (Mach 2018). A third group of proteins called readers, recognizes specific histone modifications and induces downstream processes through diverse mechanisms, including chromatin compaction, remodeling, the recruitment of secondary chromatin modifiers, transcription factors (TFs), and the DNA damage repair machinery, among others (Yun et al. 2011).
The trimethylation of the lysine 27 of histone H3 (H3K27me3) is a repressive covalent histone modification resulting from the activity of Polycomb repressive complexes (PRCs), formed by the combination of multiple Polycomb group (PcG) proteins (Grossniklaus and Paro 2014). In both animals and plants, PRCs are classified into PRC1 and PRC2, in which PRC2 deposits H3K27me3 on its targets, whereas PRC1 recognizes these histone modifications and stabilizes PRC2-mediated repression. There are three SET-domain proteins with H3K27me3 methyltransferase activity in A. thaliana: SWINGER (SWN), CURLY LEAF (CLF), and MEDEA (MEA) (Mozgova et al. 2015). The PcGs activity in this plant model is counteracted by four Jumonji (JMJ)-type proteins, which perform the active demethylation of H3K27me3 and determine spatial boundaries for this histone modification, restricting its spreading and the consequent formation of repressive chromatin domains (Yan et al. 2018). Among them, RELATIVE OF EARLY FLOWERING 6 (REF6) has been reported to promote flowering through the activation of the flower integrators FLOWERING LOCUS T (FT) and SUPPRESSOR OF OVEREXPRESSION OF CO 1 (SOC1) (Noh et al. 2004; Hou et al. 2014). Moreover, the ref6 mutation partially complements the developmental phenotype and the decreased fertility caused by the clf mutation (Lu et al. 2011). Consistently, the REF6 overexpressing plants share several of the developmental phenotypes of clf, highlighting the antagonistic function between this protein and the PRC2 complex (Lu et al. 2011).
Growing evidence indicates that H3K27me3 plays an important role in the spatial organization of chromatin in eukaryotes, a phenomenon that has been associated with its repressive role in transcription. For instance, it has been shown in animals that Polycomb targets marked with H3K27me3 can establish interactions between them, forming repressive chromatin hubs dependent on PRCs and insulator proteins (Lanzuolo et al. 2007; Cheutin and Cavalli 2014). PRCs have also been shown to regulate the maintenance of pluripotency in mammalian embryonic stem cells through the organization of interaction networks (Schoenfelder et al. 2015), and H3K27me3 levels have been associated with the Drosophila’s genome subdivision into TADs (Francis et al. 2004; Eskeland et al. 2010; Williamson et al. 2012; Joshi et al. 2015; Boettiger et al. 2016; El-Sharnouby et al. 2017; Kundu et al. 2017; McLaughlin et al. 2019). In plants, several studies suggested that this covalent histone modification is a key contributor to chromatin topology. A Hi-C approach served to propose that the local interaction of H3K27me3 domains is reduced in the Arabidopsis clf/swn double mutant background (Feng et al. 2014). Besides, it has been shown that H3K27me3 is enriched at long-distance interacting loci across the Arabidopsis genome (Liu et al. 2016a). Furthermore, in a previous study, we showed that the Drosophila HETEROCHROMATIN PROTEIN 1 (HP1) homolog in Arabidopsis LIKE-HP1 (LHP1) participates in the 3D conformation of the Arabidopsis genome (Veluchamy et al. 2016), and that its genome-wide distribution perfectly matches that of H3K27me3. LHP1 is considered a component of the plant PRC1 complex, given its capacity to recognize H3K27me3 through its chromodomain (Gaudin et al. 2001; Turck et al. 2007; Zhang et al. 2007). Therefore, H3K27me3 may directly or indirectly participate in the regulation of the dynamic interactivity of Polycomb target genes. However, several aspects of the molecular function of H3K27me3 in 3D chromatin architecture determination remain unclear. To gain a deeper understanding of the molecular role of H3K27me3, we combined cutting-edge technologies applied to the characterization of 3D chromatin conformation.
Results
Arabidopsis chromatin organization displays a strong compartmentalization
The first Hi-C analyses performed in Arabidopsis nuclei revealed that TADs, which are widely distributed among metazoans, are not obvious in this plant's genome (Liu et al. 2016a). Long-range chromatin interactions are rare in this organism and correspond almost exclusively to heterochromatic regions such as centromeres. A notable exception of this phenomenon is the KNOT, which brings together heterochromatic islands within euchromatin (Grob et al. 2014).
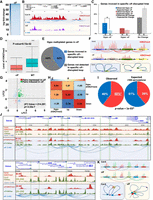
To determine the extent to which chromatin compartmentalization is a characteristic feature of the Arabidopsis genome, we performed immunodetection of H3K27me3 and H3K9ac, two histone posttranslational modifications associated to gene repression and activation, respectively. The immunostaining performed on somatic nuclei during interphase revealed a heterogeneous distribution of these covalent histone modifications, suggesting that distinct euchromatin and facultative heterochromatin compartments exist in Arabidopsis (Fig. 1A; Supplemental Fig. S1). Moreover, by measuring the H3K9ac and H3K27me3 signal distribution along a virtual axis arbitrarily defined in an immunostained nucleus, we observed that the corresponding peaks are anticorrelated (Fig. 1B). Given the proximity between H3K9ac and H3K27me3 marked genes along the chromosome and the resolution of the confocal microscope that is about 0.5 µm, this result suggests that actively transcribed and repressed genes occupy distinct compartments within the cell nucleus. To gain a deeper understanding of the compartmental organization of active and silent chromatin, we conducted HiChIP, a sensitive method for the efficient analysis of protein-centric chromosome conformation (Fig. 1C,D; Supplemental Fig. S2; Mumbach et al. 2016). H3K27me3- and H3K9ac- HiChIPs were performed in 14-d-old wild-type (WT) shoots. A minimum of 159 million read pairs were produced for each sample, and 116 million uniquely mapped read pairs were generated (Supplemental Table S1), with a high reproducibility between replicates (Supplemental Fig. S3). In parallel, ChIP-seq was performed for the same histone modifications. In contrast to traditional Hi-C (Fig. 1C,D, left panels), the HiChIP approach allows revealing interactions associated with each specific histone modification (Fig. 1C,D, right panels). Both short- and long-range interactions from a few kilobases to several megabases were detected at the site of the respective histone modifications (Supplemental Fig. S4; Supplemental Tables S2–S5). By overlapping both H3K9ac and H3K27me3 HiChIP signals, our data suggested that genes associated to the same histone modification interact with each other to form contact domains and fold the genome locally to allow the spatial segregation of transcriptionally active and silent chromatin (Fig. 1E).
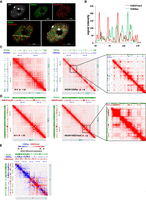
Arabidopsis chromatin organization displays strong compartmentalization. (A) Immunofluorescence detection of H3K9ac (green) and H3K27me3 (red) histone modifications and DAPI staining (gray) in an isolated Arabidopsis nucleus. (Scale bar) 5 μm. (B) Distribution of immunofluorescence signal intensity in the nucleus. The analysis was performed along the white line shown in the merged image in A. (C) Visualization of the interaction matrix of Hi-C and HiChIP in a specific region of Chromosome 2. H3K9ac ChIP-seq signal (blue peaks) were aligned with the maps to highlight the correlation with HiChIP enriched regions as expected. (D) Visualization of the interaction matrix of Hi-C and HiChIP in a specific region of Chromosome 4. H3K27me3 ChIP-seq signal (red peaks) were aligned with the maps to highlight the correlation with HiChIP enriched regions as expected. (E) Visualization of the interaction matrix of HiChIP data of H3K9ac and H3K27me3 in a specific region of Chromosome 2. Dots showing higher (blue) and lower (red) signals in H3K9ac HiChIP compared to H3K27me3, respectively. ChIP-seq signals of H3K9ac (blue peaks) and H3K27me3 (red peaks) were aligned with the map to highlight the correlation with HiChIP enriched regions.
Shoot and root nuclei display distinct 3D chromatin architectures
The 3D configuration of the nuclear genome is nonrandom and correlates with cell type–specific transcriptomes; however, the mechanisms implicated in the establishment of this configuration are poorly understood in plants. It has been recently shown that biosynthetic nonhomologous gene clusters are embedded in local 3D configurations that segregate cluster regions from the surrounding chromosome environment. Based on Hi-C and H3K27me3 distribution in Arabidopsis, it has been proposed that genome topology differs between shoots and roots (Nützmann et al. 2020). To further decipher the relationship between H3K27me3 and 3D chromatin conformation, we performed H3K27me3- HiChIP and ChIP-seq in shoots and roots. The high-resolution interaction matrix obtained by HiChIP revealed the widespread presence of interactions between genomic bins including H3K27me3-enriched genes from both tissues (Supplemental Figs. S5, S6). A differential analysis using HOMER comparing shoots and roots served to identify the most informative loops associated with H3K27me3 (Fig. 2A), which allowed us to focus on the top shoot-specific repressive loops (SSRLs) in downstream analyses (Supplemental Table S6). We found a positive correlation between H3K27me3 levels and the strength of the detected interactions when SSRLs were visualized at different scales (Fig. 2B,C). To further support our observations, we quantified the level of this histone modification in shoots and roots on genes associated to SSRLs, and we observed that 47% of those genes are hypermethylated in shoot compared to root, confirming that this repressive histone modification is associated with chromatin loop formation and/or stability (Fig. 2D; Supplemental Table S7).
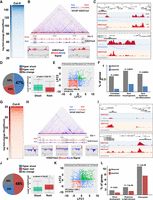
Shoot and root nuclei display distinct 3D chromatin architectures. (A) Heatmap showing the H3K27me3 HiChIP signal of the top shoot-specific repressive loops (SSRLs). (B) Example of long-distance SSRL on Chromosome 5. ChIP-seq signals of H3K27me3 in shoot (red peaks) and root (blue peaks) were aligned with the map and the differential analysis of both ChIP-seq signals in differentially interacting regions are highlighted (bottom panels in gray). (C) Example of short distance SSRL. H3K27me3 ChIP-seq signal is represented by red peaks and chromatin interactions signal by blue lines. (D) Analysis of H3K27me3 levels on SSRLs. The pie chart represents the percentage of the genes involved in SSRLs that are either hypermethylated in shoot or in root. The box plot shows the H3K27me3 levels in shoot or root of the 47% of shoot hypermethylated genes involved in SSRLs. (E) Scatterplot of log2 (shoot/root gene expression fold change) for pairs of genes interacting through H3K27me3-associated contacts in shoot. (F) Gene Ontology enrichment analysis of the differentially expressed genes involved in SSRLs. (G) Heatmap of H3K27me3 HiChIP signal of the top root-specific repressive loops (RSRLs). (H) Example of long-distance RSRLs on Chromosome 1. ChIP-seq signals of H3K27me3 in shoot (red peaks) and root (blue peaks) were aligned with the map and the differential analysis of both ChIP-seq signals in differentially interacting regions are highlighted (bottom panels in gray). (I) Example of short distance RSRLs. (J) Analysis of H3K27me3 level over RSRLs. The pie chart represents the percentage of genes involved in RSRLs that are either hypermethylated in shoot or root. The box plot displayed the H3K27me3 levels of the 48% of root hypermethylated genes involved in RSRLs. (K) Scatterplot of log2 (shoot/root gene expression fold change) for pairs of genes interacting through H3K27me3-associated contacts in root. (L) Gene Ontology enrichment analysis of the differentially expressed genes involved in RSRLs.
We then wondered whether gene pairs connected in SSRLs show similar changes in expression levels between shoots and roots. Using publicly available gene expression data (Liu et al. 2016b), we plotted the top SSRL gene pairs using the log2 (fold change shoot/root) of the first gene as the predictor and the log2 (fold change shoot/root) of the second gene as the response (Fig. 2E; Supplemental Fig. S7; Supplemental Table S8). This analysis revealed a significant correlation between H3K27me3 SSRL-associated loci and genes repressed in shoots (Fig. 2E). These data indicate that genes displaying specific physical contacts, and associated with H3K27me3, show similar transcriptional behavior and are likely part of common Polycomb-repressive compartments (Fig. 2E).
It has been extensively shown that H3K27me3 works as a repressive covalent histone modification participating in the regulation of multiple developmental genes in plants (Cheng et al. 2020). Then, to better understand the impact of H3K27me3-dependent chromatin architecture on plant development, we performed an analysis of Gene Ontology (GO) terms enriched among loci grouped in SSRLs with a lower expression in shoots than in roots. We found a significant enrichment in GO categories related to root development and cell identity (Fig. 2F), hinting at a comprehensive epigenetic reprogramming of developmental pathways in different organs. Reciprocally, we also explored the root-specific repressive loops (RSRLs) and their impact on developmental outputs (Fig. 2G; Supplemental Table S9). In agreement with our observations for SSRLs, genes associated in RSRLs displayed higher H3K27me3 levels in roots than in shoots and lower expression levels in roots compared to shoots (P-value = 3.2 × 10−55) (Fig. 2G–K; Supplemental Fig. S7; Supplemental Tables S10, S11). In addition, the GO analysis of genes grouped in RSRLs, which are down-regulated in roots, showed enrichment in categories related to shoot development and photosynthesis (Fig. 2L), in agreement to the nonphotosynthetic nature of root tissues. These observations suggest a role of H3K27me3-dependent genome topology in coordinating the transcriptional activity underlying developmental programs.
One limitation of HiChIP when using antibodies directed against a particular histone modification is that the detection of chromatin contact relies on the presence of this given histone modification at the site of interaction. Thus, the observed reduction of the strength of some interactions could merely reflect H3K27me3 depletion at loci of interest. To rule out this possibility, we performed Capture-Hi-C (C-Hi-C). This approach combines Hi-C with the hybridization-based capture of targeted genomic regions (Supplemental Fig. S8). To this end, we generated a biotinylated RNA bait library specifically targeting 4650 regions that accumulate H3K27me3 and included a subset of loci differentially methylated between shoots and roots (Supplemental Fig. S9). The comparison of both Hi-C and C-Hi-C matrixes allowed us to identify a significant enrichment of chromatin contacts over our target sequences (Fig. 3A) and to obtain a high-resolution map of interactions between captured regions, as well as between captured and noncaptured regions (Fig. 3B). A differential analysis using HOMER resulted in the identification of 7676 shoot-specific loops (SSLs), of which 277 overlapped with the SSRLs previously identified by HiChIP. These data suggest that the deposition of H3K27me3 participates in the establishment of tissue-specific chromatin loops (Fig. 3C–E; Supplemental Tables S12, S13, and S8). Focusing on these SSLs identified by both methods, we found that 67% of the genes grouped in SSLs were found to be specifically repressed in shoots compared to roots (Fig. 3F). This proportion is significantly higher than the one expected by chance (P-value = 1.61 × 10−144) (Supplemental Fig. S10). On the other hand, we found through the same approach 6737 root-specific loops (RSLs), among which 231 were also found on the previously generated H3K27me3-HiChIP data analysis and defined RSRLs (Fig. 3G–I; Supplemental Tables S13, S14). Of the genes grouped in RSLs, 54% were specifically repressed in roots compared to shoots, a proportion significantly higher than the one expected by chance (P-value = 2.71 × 10−68) (Fig. 3J; Supplemental Fig. S10). We also observed that 24% and 35% of the genes respectively grouped in SSLs and RSLs displayed an unexpected behavior, which could be explained by the fact that both shoots and roots correspond to complex samples of a mixture of various cell types. Altogether, our C-Hi-C data further supported that the H3K27me3 levels mediate the establishment and/or stability of repressive domains bringing together several genes in Arabidopsis and that Polycomb-related repressive compartments could play an important role in the transcriptional reprogramming underlying plant cell fate and organ development.
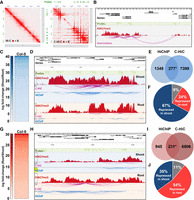
The levels of H3K27me3 correlate with the stability of repressive loops. (A) Visualization of the interaction matrix of Hi-C and C-Hi-C in a specific region of Chromosome 1. (B) Example of interaction analysis using C-Hi-C data showing captured regions (green bars), H3K27me3 ChIP-seq signal (red peaks), and chromatin interactions (purple lines). (C) Heatmap of C-Hi-C data showing the shoot-specific loops (SSLs). (D) Examples of the shoot-specific interacting region detected by both C-Hi-C and H3K27me3 HiChIP. Probes used for the C-Hi-C are represented by green bars, the H3K27me3 ChIP-seq signal by red peaks, the C-Hi-C interaction signals by purple lines, and H3K27me3 HiChIP interaction signals by blue lines. (E) Venn diagram representing overlap of loops called from HiChIP and C-Hi-C library sets. Only loops containing specific probes were selected for the comparison in HiChIP. (F) Pie chart representing the proportion of genes involved in shoot-specific loops that are repressed in shoot (blue, 67%), repressed genes in root (red, 24%), and unchanged (gray, 9%) among the genes involved in loops detected both with HiChIP and C-Hi-C. (G) Heatmap of C-Hi-C data showing the top root-specific loops (RSLs). (H) Examples of root-specific interacting region detected by both C-Hi-C and H3K27me3 HiChIP. Probes used for the C-Hi-C are represented by green bars, the H3K27me3 ChIP-seq signal by red peaks, the C-Hi-C interaction signals by purple lines, and H3K27me3 HiChIP interaction signals by blue lines. (I) Venn diagram representing overlap of loops called from HiChIP and C-Hi-C library sets. Only loops containing specific probes were selected for the comparison in HiChIP. (J) Pie chart representing genes involved in RSLs that are repressed in shoot (blue, 35%), repressed genes in root (red, 54%), and unchanged (gray, 11%) among the genes involved in loops detected both with HiChIP and C-Hi-C.
Ectopic deposition of H3K27me3 leads to occurrence of novel chromatin repressive loops
To decipher the impact of H3K27me3 levels on chromatin loop dynamics, we used the loss-of-function ref6-5 mutant, defective for a histone demethylase and displaying ectopic accumulation of H3K27me3 at thousands of loci (Fig. 4A; Lu et al. 2011; Yan et al. 2018; Antunez-Sanchez et al. 2020). Thus, to assess if ectopic H3K27me3 deposition could lead to the formation of new repressive compartments, we performed a C-Hi-C experiment comparing ref6-5 and WT shoots (Fig. 4B–D; Supplemental Fig. S11). A HOMER differential analysis identified the top ref6-specific repressive loops (reSLs) ranked according to the log fold change and Z-score (Fig. 4B; Supplemental Table S15). We observed that a large proportion of genes involved in reSLs displayed a significant increase in H3K27me3 levels in ref6-5 compared to WT (P-value = 4.62 × 10−76) (Fig. 4C–E; Supplemental Fig. S12; Supplemental Table S16). To confirm this, we assessed the proportion of ref6-5 hypermethylated genes associated to repressive loops and found that 40% were associated with reSLs (Fig. 4C–E). These data suggest that a gain in H3K27me3 triggers the establishment of novel chromatin interactions (Fig. 4D). Using publicly available transcriptomic data (Antunez-Sanchez et al. 2020), we assessed whether gene pairs connected through reSLs showed similar transcriptional shifts between ref6-5 and WT. We found a significant enrichment of corepressed reSL-paired gene loci among the 546 plotted couples (P-value = 4 × 10⁻¹⁰) (Fig. 4F; Supplemental Fig. S12; Supplemental Table S17). This result indicates that genes displaying specific physical contact in ref6-5 are globally repressed, likely linked to the ectopic accumulation H3K27me3 and the formation of repressive chromatin loops.
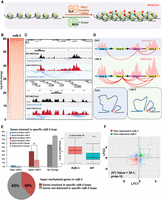
Ectopic deposition of H3K27me3 leads to formation of new chromatin repressive loops. (A) Schema illustrating the antagonistic role of the PRC2 complex (involving the histone methyltransferase CLF) and the histone demethylase REF6 to control H3K27me3 homeostasis and chromatin remodeling. (B) Heatmap of C-Hi-C data showing ref6-5 specific loops (reSLs). (C) Examples of reSLs detected by C-Hi-C. C-Hi-C interaction signal (blue lines) and H3K27me3 ChIP-seq signal in wild type (black peaks) and ref6-5 (red peaks) are represented. (D) Model of chromatin contacts organization in wild type and ref6-5 mutant. (E) Histogram representing the percentage of genes (observed [O] or expected [E]) involved in reSLs that are either hyper- or hypomethylated in ref6-5 compared to WT. To obtain the expected proportion, we shuffled the H3K27me3 signals 1000 times to obtain the randomized gene counts. The mean of the 1000 permutations was used to determine the expected proportions. Asterisk indicates significant difference (P-value < 2.2 × 10⁻¹⁶, test of proportions). The bottom pie chart represents the percentage of ref6-5 hypermethylated genes involved in reSLs. The box plot displays the H3K27me3 levels of the 40% of ref6-5 hypermethylated genes involved on reSLs. (F) Scatterplot of log2 (ref6-5/wild-type gene expression fold change) for pairs of genes interacting specifically in ref6-5 compared to wild-type.
Reduction of H3K27me3 level induces a reconfiguration of chromatin architecture
Considering that the ectopic deposition of H3K27me3 induces the formation of novel chromatin repressive loops, we decided to assess the impact of a reduction in H3K27me3 deposition on the interaction profile within Polycomb-related repressive domains. To this end, we used clf-29, a Polycomb Repressive Complex 2 (PRC2) histone methyltransferase mutant that displays a strong reduction on H3K27me3 levels at thousands of loci (Fig. 4A; Veluchamy et al. 2016). C-Hi-C and a differential analysis comparing clf-29 and WT shoots identified the top clf-specific disrupted loops (cSDLs) ranked according to the log fold change and Z-score (Fig. 5A,B; Supplemental Fig. S13; Supplemental Table S18). We observed that 33% of genes involved in cSDLs displayed a significant decrease in H3K27me3 levels in the clf-29 mutant compared to WT (P-value = 9.72 × 10−52) (Fig. 5C,D; Supplemental Table S19). To confirm this observation, we assessed the proportion of clf hypomethylated genes associated to cSDLs and found that 40% of the clf hypomethylated genes are associated to a cSDL, suggesting that the loss of H3K27me3 induced a destabilization of repressive loops in the clf-29 (Fig. 5E). To uncover the impact of chromatin architecture reorganization on transcriptional reprogramming, we analyzed the expression of gene pairs normally brought together into spatial proximity in WT shoots, which are no longer clustered in the clf-29. We observed a significant enrichment in transcriptionally activated genes (P-value = 4.336 × 10⁻⁷) (Fig. 5G; Supplemental Fig. S14; Supplemental Table S20), indicating that genes involved in loops lost in the clf-29 mutant tend to be up-regulated. Altogether, our results suggest that a clf-dependent decrease in H3K27me3 leads to a reconfiguration of chromatin architecture and the destabilization of H3K27me3-mediated repressive loops (Fig. 5B,F). This phenomenon can be associated to the transcriptional derepression of hundreds of genes in PRC2-related mutants.
Reduction of H3K27me3 levels induces a reconfiguration of chromatin architecture. (A) Heatmap of C-Hi-C data showing loops that are weaker in clf mutant than in wild type. (B) Example of C-Hi-C interactions displaying disrupted loops in clf compared to wild type. C-Hi-C interactions (blue lines) and H3K27me3 ChIP-seq signal in wild type (red peaks) and clf (purple peaks) are represented. (C) Histogram representing the percentage of genes (observed [O] or expected [E]) involved in cSDLs that are either hyper- or hypomethylated in clf compared to WT. To obtain the expected proportion, we shuffled the H3K27me3 signals 1000 times to obtain the randomized gene counts. The mean of the 1000 permutations was used to determine the expected proportions. Asterisk indicates significant difference (P-value < 2.2 × 10⁻¹⁶, test of proportions). (D) The box plot displays the H3K27me3 levels of the 40% of clf hypomethylated genes involved in cSDLs. (E) The pie chart represents the percentage of clf hypomethylated genes involved in cSDLs. (F) Model of chromatin contacts organization in wild type and clf mutant. (G) Scatterplot of log2 (clf/wild-type gene expression fold change) for pairs of genes interacting specifically in wild type compared to clf. (H) Heatmap presenting the log2 of odd ratios of combinations of features of interacting genes (Results). Positive log2 (odd ratio) indicates enrichment and negative indicates depletion. (I) Pie chart representing the proportion of loops involving a gene H3K27me3 hypomethylated and a gene marked or not by H3K9ac in clf mutant. (Hypo-H3K27me3) No H3K9ac loops in clf mutant (blue: 40% observed and 61% expected, respectively); (Hypo-H3K27me3) H3K9ac loops (red: 60% observed and 39% expected, respectively). (J) Examples of C-Hi-C interactions of a region losing H3K27me3 in clf and that tend to establish interactions with regions marked with H3K9ac euchromatin histone modification. C-Hi-C interactions (blue lines), H3K9ac ChIP-seq signal in wild type and clf (green peaks), H3K27me3 ChIP-seq signal in wild type and clf (red peaks) are represented. (K) Model of chromatin contacts organization in wild type and clf mutant.
To better understand the association between genome topology reconfiguration, H3K27me3 deposition and gene expression, we compared epigenomic and transcriptional features found in clf-29 and WT and integrated these data sets with chromatin interaction positioning (Supplemental Table S21). Our analysis revealed that interactions occur more frequently between genes with concordant transcriptional status, independently of whether they are up- or down-regulated in clf-29 compared to the WT (Fig. 5G,H). Moreover, a similar trend was observed for the epigenomic profile, because genes with concordant H3K27me3 levels are more prone to interact in common hubs (Fig. 5G,H). A higher frequency in the interaction among hypomethylated genes in clf-29 suggested a gain of novel interactions. Considering that clf hypomethylated genes showed a global transcriptional activation, we assessed in WT shoots the distribution of the H3K9ac histone modification, characteristic of active loci. Then we mapped the gained interactions determined by C-Hi-C in clf-29 throughout the genome, together with the distribution of the H3K9ac histone modification in the WT. We observed that regions losing H3K27me3 in clf-29 tend to establish novel interactions with regions marked with the active histone modification H3K9ac (Fig. 5I,J; Supplemental Figs. S15, S16; Supplemental Tables S22–S24). This suggests that a reduction in H3K27me3 levels induces a global reconfiguration of chromatin architecture (Fig. 5J,K), allowing genes that lost their repressive covalent histone modification to integrate transcriptionally active hubs. Altogether, our results show that the 3D genome organization is tightly linked to histone modifications that dynamically modulate the determination of chromatin domains associated with gene coregulation, thereby allowing the progression of plant developmental programs. Collectively, our data support the view that H3K27me3 acts as a key regulator of global and local facultative heterochromatin topology in plants.
Discussion
The first analyses of the 3D genome organization of Arabidopsis revealed the absence of TAD structures and the existence of an “A/B” type compartmentalization at a local level in domains of a few tens of kilobases (Lieberman-Aiden et al. 2009; Grob et al. 2014). Constitutive heterochromatin, which contains mainly transposable element marked by specific histone modifications such as H3K9me2 and H3K27me1, is one of the major factors directing this compartmentalization. However, the contribution of facultative heterochromatin to higher-order nuclear topology in plants is not clearly stated. In the current study, through the integration of immunostaining experiments and confocal microscopy, we provide evidence that H3K9ac-rich (euchromatin) and H3K27me3-rich (facultative heterochromatin) regions are spatially segregated, confirming that actively transcribed and repressed genes occupy distinct regions in the nucleus. This result is consistent with previous ChIP-based studies in Arabidopsis, which have shown that the distribution of facultative heterochromatic histone modifications such as H3K27me3 on the linear genome is anticorrelated to euchromatic histone modifications (Ha et al. 2011).
Hi-C data is useful for the depiction of the genome-wide 3D organization of chromatin in the nucleus; however, to understand which proteins or covalent histone modifications have a role in structuring this organization, it is necessary to integrate it with external data sets (e.g., ChIP-seq) allowing only correlative analyses. To circumvent this limitation and to address whether and how genomic regions associated to histones bearing a specific covalent modification interact through long-range chromatin looping in a genome-wide and unbiased manner, we performed HiChIP experiments, confirming that transcriptionally active and inactive genes localize in different nuclear compartments. In addition, we also observed both long- and short-range interactions, ranging from a few kilobases to several megabases, enriched at the site of either H3K27me3 or H3K9ac, highlighting the role of these histone modifications in 3D chromatin architecture. In plants, it has been previously hypothesized that H3K27me3 contributes to the establishment of chromatin loops, because this histone modification has been detected in interacting genomic regions (Liu et al. 2016a); however, in the current study we have taken advantage of the specific capture of H3K27me3-labeled chromatin loops to provide evidence of the role of this covalent histone modification in the spatial organization of chromatin. A similar approach has been used in maize to identify cis-regulatory elements, revealing that H3K27me3 is potentially implicated in mediating chromatin loops between regulatory elements and their target genes in a process associated to gene repression (Ricci et al. 2019).
Chromatin architecture and development
In the last few years, we have witnessed a significant increase in studies addressing the role of 3D genome organization in the regulation of developmental processes as well as in response to environmental cues. Hence, it is currently known that chromatin topology is highly dynamic during animal developmental phase transitions, including gametogenesis, embryo development, and cell differentiation. The recent development of single-cell and low-input Hi-C approaches has permitted the characterization of the embryo along different developmental stages, as well as different cell lines during differentiation and lineage commitment. This has allowed researchers to identify commonalities and particularities of each cell type and to associate them to specific phenotypes (Zheng and Xie 2019). These single-cell techniques have seldom been applied in plants, mainly because of the technical limitations that this imposes (Huang et al. 2020); however, some studies have started characterizing the chromatin topology of specific plant cell types, showing that as in animals, gamete, zygote, and differentiated cells present striking differences in their nuclear 3D chromatin configuration. By integrating single-cell 3C and Hi-C approaches, Zhou and collaborators analyzed the 3D genomes of rice sperm, egg, unicellular zygote, and mesophyll cells, finding that rice nuclei present spatially organized chromatin territories associated to different histone modifications and gene expression levels, providing evidence of the contribution of the spatial organization of chromatin to the coregulation of gene expression (Zhou et al. 2019).
The relevance of chromatin organization in the developmental context can be evidenced in the variety of diseases and developmental problems that have been associated to abnormalities in chromatin organization in various organisms. For instance, cardiac diseases, cancer and developmental disorders have been attributed to mutations in genes encoding CTCFs and cohesion proteins (Lupiáñez et al. 2015, 2016; Kaiser and Semple 2017; Rosa-Garrido et al. 2017). Furthermore, the disruption of TAD boundaries has been shown to have developmental effects as a consequence of enhancer hijacking, or the abnormal interaction between an enhancer and a promoter. Several examples of this phenomenon have been reported in the literature (Lupiáñez et al. 2016; Kaiser and Semple 2017; Zheng and Xie 2019), highlighting the crucial role of chromatin organization on cell homeostasis and animal development. However, studies demonstrating the developmental consequences of chromatin disorganization in plants remain scarce. It has been recently shown that loss of CROWDED NUCLEI (CRWN) proteins, which are candidate nuclear lamina proteins in Arabidopsis, leads to a general reduction on chromatin organization and an associated reprogramming of the transcriptome (Choi et al. 2019; Hu et al. 2019). Furthermore, the loss of these proteins has been reported to induce dwarfism and a spontaneous cell death phenotype, which have been attributed to the constitutive induction of the salicylic acid-dependent pathway of immunity (Hu et al. 2019). These results suggest that as in animals, 3D chromatin organization plays a key role in the regulation of plant development and homeostasis. Furthermore, these results suggest that several of the pleiotropic phenotypes observed in plants defective in the epigenomic machinery may result from distortions in chromatin architecture and their impact on gene expression; however, this needs to be experimentally assessed.
In the current study we provide evidence for the existence of distinctive chromatin architecture between root and shoot cells, as evidenced by the presence of shoot- and root-specific repressive loops mediated by H3K27me3. This represents valuable evidence for the understanding of how chromatin modifications contribute to chromatin topology and, consequently, to organ identity in plants. Our data show that genes involved in SSRLs and RSRLs are associated with biological functions specific to the studied organs, supporting the view that chromatin loops contribute to the developmental differentiation of specific cells types in plants (Fig. 6).
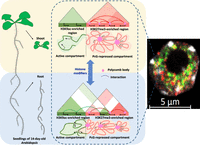
Histone modifiers control chromatin architecture by triggering formation of chromatin repressive or active domains to allow gene coregulation. Model of the formation of tissue-specific active and repressive chromatin domains in Arabidopsis seedlings. The green structures represent active compartments, which are associated with H3K9ac-marked euchromatin. The pink structures represent PcG-repressive compartments, which are associated with H3K27me3-marked facultative heterochromatin.
Polycomb-repressed chromatin is critical for 3D nuclear organization in plants
Traditionally, Polycomb complexes have been associated to the repression of developmental genes, including the well described Hox genes (Bantignies et al. 2011; Kassis et al. 2017). However, the introduction of 3D epigenomic techniques has allowed depiction of some of the molecular mechanisms by which these complexes regulate development, including the modulation of chromatin architecture (Illingworth 2019; Pachano et al. 2019). For instance, a recent study unveiled that H3K27me3 is a fundamental player in the chromatin reorganization occurring during oocyte development in mice (Du et al. 2020). Polycomb-associated domains (PADs) are self-interacting, cohesion-independent compartments enriched in H3K27me3 that are gradually established on the maternal genome until a late stage before disappearing upon meiotic resumption. Hi-C analyses of mutants defective on PRC2 and PRC1 subunits revealed that PAD establishment is highly dependent on these complexes and H3K27me3 (Du et al. 2020). Most of the studies on the 3D organization of PcG-bound chromatin in mammals have been performed in embryonic stem cells (ESCs) and have illustrated that Polycomb proteins and their associated histone modifications accumulate in ESCs in discrete foci that have been named PcG bodies (Bantignies et al. 2011; Pachano et al. 2019). Mutations in subunits of both PRC2 and PRC1 have been shown to lead to the dispersion of these structures (Hernández-Muñoz et al. 2005), suggesting significant changes in chromatin architecture in these mutants. The molecular mechanisms connecting H3K27me3 deposition, loop formation, and gene expression have been dissected into detail in Drosophila. This study showed (1) that H3K27me3 deposition is critical for loop formation, and (2) that chromatin looping contributes to gene repression, although it is not strictly required (Ogiyama et al. 2018). These results are coherent with our previous characterization of the Arabidopsis lhp1 mutant, deficient in a PRC1 subunit, where a vast proportion of genomic interactions are lost (Veluchamy et al. 2016). The loss of these interactions is associated, to a large extent, to a significant reduction on H3K27me3 levels on interacting partners, suggesting that both LHP1 and H3K27me3 are involved in loop formation in this organism. Because LHP1 is an H3K27me3 reader, it is considered to act, at least partially, downstream from H3K27me3 methyltransferases (Berry et al. 2017). Hence, if LHP1 activity depends on H3K27me3 levels, altering the latter through mutations on CLF or REF6 should have an impact on chromatin looping. In agreement, in the current study we found that increasing H3K27me3 levels leads to the formation of new chromatin repressive loops, whereas reducing them has the inverse effect. Altogether, these results indicate that, similar to animals, PRCs and H3K27me3 play a fundamental role in the shaping of regulatory chromatin interactions and overall, chromatin conformation in the three-dimensional space, a phenomenon that is associated with developmental processes and, most likely, cell identity. However, the respective importance of H3K27me3 deposition and H3K27me3-mediated chromatin looping for efficient gene repression will require further investigation.
We found that some of the regions that lose H3K27me3 in the clf mutant tend to establish interactions with transcribed regions marked with H3K9ac. This may indicate that one of the mechanisms by which H3K27me3 contributes to gene repression is through the preclusion of these interactions. In addition, in animals, there is recent evidence indicating that histone hyperacetylation also contributes to nuclear organization, because it induces the formation of long-range chromatin interactions and nuclear subcompartments (Rosencrance et al. 2020). This shows that the dynamic chromatin topology in the nuclear space results from the delicate balance of a plethora of elements, including various histone modifications, which recruit the nuclear machinery for its spatial organization. It has been proposed that nuclear proteins can pull the genome into new positions like in the game “cat's cradle,” in which the shape of a string is successively changed by opening up new sites for finger placement (Melé and Rinn 2016). Future research is likely to provide exciting new insights into the mechanisms involving histone modifications and associated molecules in the dynamic configuration of the plant genome.
In summary, our results show the 3D organization of the genome is tightly linked to histone modifications that trigger the formation of chromatin interactions associated to gene coregulation. By these means, they contribute to proper plant development, a process in which H3K27me3 is a key regulator of global and local facultative heterochromatin topology.
Methods
Plant material and growth conditions
Plant lines used in this study were in A. thaliana ecotype Columbia (Col-0) background. The T-DNA insertional mutants we used, clf-29 (SALK_N521003) and ref6-5 mutant (GABI_705E03), were obtained from the GABI-Kat collection (Mirouze et al. 2012). Seeds were surface-sterilized by treatment with bayrochlore, washed, and then sown in sterile half-strength MS medium, placed for 2–4 d at 4°C to obtain homogeneous germination, and plants were grown in a vertical orientation in square petri dishes in growth chambers at 20°C under long-day (16 h of light) conditions.
Immunostaining
Immunofluorescence labeling was performed according to Latrasse et al. (2017). Briefly, seedlings of 14-d-old Arabidopsis were fixed and then nuclei were isolated, placed on a poly-lysine slide, and incubated overnight at 4°C with primary antibodies specific to lysine-9-acetylated H3 (MilliporeSigma 07-352) and lysine-27-trimethylated H3 (Sigma-Aldrich 07-449). After washing, slides were incubated for 1 h at room temperature in the dark either with Goat anti-Rabbit Alexa Fluor Plus 488 (Invitrogen A11034) and Goat anti-Mouse Alexa Fluor Plus 555 (Invitrogen A32727) or with Goat anti-Rabbit Alexa Fluor Plus 555 (Invitrogen A32732) and Goat anti-Mouse Alexa Fluor Plus 488 (Invitrogen A32723) as secondary antibodies. DNA was counterstained with 4,6 diamidino-2-phenylindole (DAPI) in SlowFade Diamond Antifade mounting media. Slides were directly imaged on a confocal microscope (Zeiss Microsystems).
Chromatin immunoprecipitation followed by high-throughput sequencing (ChIP-seq) assay
ChIP-seq assays were performed on shoot or root of 14-d-old seedlings using anti-H3K27me3 (Sigma-Aldrich 07–449). Plant material was cross-linked in 1% (v/v) formaldehyde for 15 min at room temperature. Cross-linking was quenched with 0.125 M glycine for 5 min. The cross-linked plantlets were ground, and the nuclei were isolated and lysed in Nuclei Lysis Buffer (0.1% SDS, 50 mm Tris-HCl at pH 8, 10 mm ethylene diamine tetraacetic acid [EDTA] at pH 8). Cross-linked chromatin was sonicated for 5 min using a Covaris S220 (Peak Power: 175, cycles/burst: 200. Duty Factory: 20). The complexes were immunoprecipitated with antibodies, overnight at 4°C with gentle shaking, and incubated for 1 h at 4°C with 40 μL of Dynabeads Protein A (Thermo Fisher Scientific). The beads were washed 2 × 5 min in ChIP Wash Buffer 1 (0.1% SDS, 1% Triton X-100, 20 mM Tris−HCl at pH 8, 2 mM EDTA at pH 8, 150 mM NaCl), 2 × 5 min in ChIP Wash Buffer 2 (0.1% SDS, 1% Triton X-100, 20 mM Tris−HCl at pH 8, 2 mM EDTA at pH 8, 500 mM NaCl), 2 × 5 min in ChIP Wash Buffer 3 (0.25 mM LiCl, 1% NP-40, 1% sodium deoxycholate, 10 mM Tris−HCl at pH 8, 1 mM EDTA at pH 8) and twice in TE (10 mm Tris-HCl at pH 8, 1 mM EDTA at pH 8). ChIPed DNA was eluted by two 15-min incubations at 65°C with 250 μL of Elution Buffer (1% SDS, 0.1 m NaHCO3). Chromatin was reverse cross-linked by adding 20 μL of NaCl 5 M and incubated overnight at 65°C. Reverse cross-linked DNA was submitted to RNase and Proteinase K treatment and extracted with phenol−chloroform. DNA was ethanol precipitated in the presence of 20 μg of glycogen and resuspended in 10 μL of nuclease-free water in a DNA low-bind tube. Libraries were then generated using 10 ng of DNA and NEBNext Ultra II DNA Library Prep Kit for Illumina (NEB). The quality of the libraries was assessed with an Agilent 2100 Bioanalyzer (Agilent), and the libraries were subjected to 1 × 75 bp high-throughput sequencing by NextSeq 500 (Illumina).
HiChIP assay
HiChIP experiments were performed on shoots and roots of 14-d-old seedlings using the same procedure as in Concia et al. (2020) with either anti-H3K9ac (MilliporeSigma 07–352) or anti-H3K27me3 (Sigma-Aldrich 07–449). The quality of the libraries was assessed with Agilent 2100 Bioanalyzer (Agilent), and the libraries were subjected to 2 × 75 bp paired-end high-throughput sequencing by NextSeq 500 (Illumina).
Capture Hi-C assay
For Capture Hi-C, in situ Hi-C libraries from shoot and root of Col-0, ref6, and clf were first generated as in Concia et al. (2020). The quality and the DNA concentration of the libraries were assessed with an Agilent 2100 Bioanalyzer (Agilent). Capture was then performed using SureSelect XT Target Enrichment System for Illumina Paired-End Multiplexed Sequencing Library (Agilent) according to the manufacturer's recommendation. To this end, 52,911 custom probes were designed, covering 2.658 Mbp and 4650 genes (Supplemental Table S25). Capture was performed using 1 µg of in situ Hi-C libraries and following the manufacturer's recommendation. Quality control and sequencing of the libraries were performed in the same way as for HiChIP assays.
Analysis of ChIP-seq data
Single-end sequencing of ChIP samples was performed using Illumina NextSeq 500 with a read length of 76 bp. Trimmomatic-0.38 (Martin 2011) was used for quality trimming. Parameters for read quality filtering were set as follows: minimum length of 36 bp; mean Phred quality score greater than 30; leading and trailing bases removal with base quality <5. The reads were mapped onto the TAIR10 assembly using Bowtie 2 (Langmead and Salzberg 2012) with mismatch permission of 1 bp. To identify significantly enriched regions, we used MACS2 (Gaspar 2018). Parameters for peaks detection were set as follows: number of duplicate reads at a location:1; mfold of 5:50; Q-value cutoff: 0.05; extsize 200; broad peak. To extract the average scores across the genomic regions, multiBigwigSummary command from the deepTools package (Ramírez et al. 2016) was used with default parameters on the RPGC normalized bigWig files.
Differential expression analysis
Single-end sequencing of RNA-seq samples were trimmed using Trimmomatic-0.38 with the following parameters: minimum length of 30 bp; mean Phred quality score greater than 30; leading and trailing bases removal with base quality <5. STAR aligner (Dobin et al. 2013) was used to map the reads to TAIR10 genome assembly. Raw read counts were then extracted using featureCounts based on the gene annotations in Araport11_GFF3_ genes_transposons.201606.gtf. Finally, we used DESeq2 (Love et al. 2014) to identify differentially expressed genes. Genes having read counts ≥50 in at least two samples were considered for differential expression analysis.
Analysis of HiChIP and Capture Hi-C data
Raw FASTQ files were preprocessed with Trimmomatic-0.38 to remove Illumina sequencing adapters. The 5′ and 3′ ends with a quality score below 5 (Phred+33) were trimmed and reads shorter than 30 bp after trimming were dropped. The trimmed files were then processed with HiC-Pro v2.11.1 (Servant et al. 2015). The reads were aligned using Bowtie 2 onto the TAIR10 assembly with default settings, except for the parameter “‐‐score-min L, −0.6, −0.8”. Invalid ligation products (such as dangling ends, fragments ligated on themselves, and ligations of juxtaposed fragments) were discarded. Valid pairs were used to produce raw interaction matrixes at various resolutions. Finally, “.hic” files were generated with the software Juicer Tools and visualized with the tool Juicebox (Durand et al. 2016).
Identification and analysis of genomic interactions
Valid pairs generated are further analyzed using HOMER v4.10 (Zhang et al. 2008) for different resolutions (500 bp for short-range interactions and 20 kb for long-range interactions). For the short-range interactions, both the anchors of the interactions (genomic bins) were annotated with genes using BEDTools intersect (Quinlan and Hall 2010). We removed interactions without any gene annotations, self-loops, and duplicates. Finally, based on the gene annotations, we integrated the log fold change from RNA-seq data and ChIP-seq data.
Data access
All raw and processed sequencing data generated in this study have been submitted to the NCBI Gene Expression Omnibus (GEO; https://www.ncbi.nlm.nih.gov/geo/) under accession number GSE155502.
Competing interest statement
The authors declare no competing interests.
Acknowledgments
This work was supported by the Agence Nationale de la Recherche (ANR) (3DWheat project ANR-19-CE20-0001-01) and by the Institut Universitaire de France (IUF). Y.H. was supported by China Scholar Council fellowships (201806690005).
Author contributions: M.B. designed this research project. Y.H., J.S.R.-P., N.Y.R.-G., and R.B.-C. collected the plant materials. Y.H. and D.L. performed the Capture Hi-C, HiChIP, ChIP-seq experiments, and Capture Hi-C, HiChIP, ChIP-seq libraries. D.L. performed the Illumina sequencing and immunofluorescence staining experiments. S.S., J.A.-S., D.M.-M., J.A., D.L., L.C., and M.B. performed the bioinformatics analyses. Y.H., S.S., D.L., and M.B. made figures and supplemental data. M.B., F.A., and J.S.R.-P. wrote the paper with support from all authors. M.M.M., S.A., A.V.P., F.B., C.B., F.A., H.H., M.C., J.G.-M., C.R., and D.L. analyzed the data and provided critical feedback. All authors read and approved the final manuscript.
Footnotes
-
[Supplemental material is available for this article.]
-
Article published online before print. Article, supplemental material, and publication date are at https://www.genome.org/cgi/doi/10.1101/gr.273771.120.
- Received November 6, 2020.
- Accepted May 20, 2021.
This article is distributed exclusively by Cold Spring Harbor Laboratory Press for the first six months after the full-issue publication date (see https://genome.cshlp.org/site/misc/terms.xhtml). After six months, it is available under a Creative Commons License (Attribution-NonCommercial 4.0 International), as described at http://creativecommons.org/licenses/by-nc/4.0/.


