
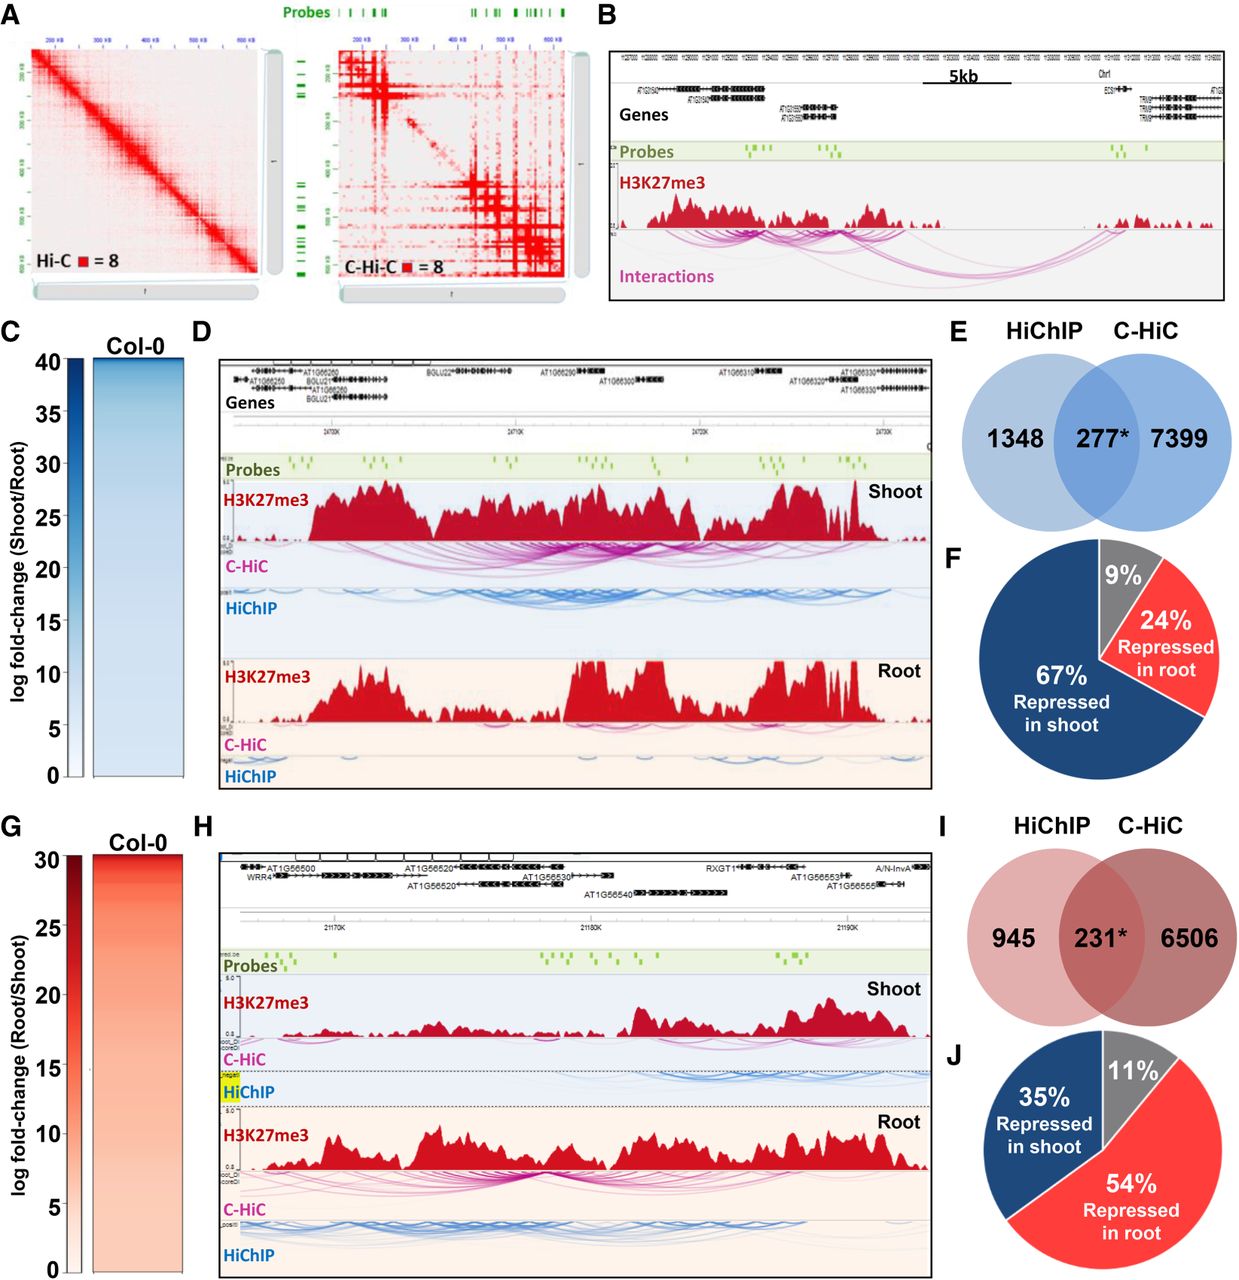
The levels of H3K27me3 correlate with the stability of repressive loops. (A) Visualization of the interaction matrix of Hi-C and C-Hi-C in a specific region of Chromosome 1. (B) Example of interaction analysis using C-Hi-C data showing captured regions (green bars), H3K27me3 ChIP-seq signal (red peaks), and chromatin interactions (purple lines). (C) Heatmap of C-Hi-C data showing the shoot-specific loops (SSLs). (D) Examples of the shoot-specific interacting region detected by both C-Hi-C and H3K27me3 HiChIP. Probes used for the C-Hi-C are represented by green bars, the H3K27me3 ChIP-seq signal by red peaks, the C-Hi-C interaction signals by purple lines, and H3K27me3 HiChIP interaction signals by blue lines. (E) Venn diagram representing overlap of loops called from HiChIP and C-Hi-C library sets. Only loops containing specific probes were selected for the comparison in HiChIP. (F) Pie chart representing the proportion of genes involved in shoot-specific loops that are repressed in shoot (blue, 67%), repressed genes in root (red, 24%), and unchanged (gray, 9%) among the genes involved in loops detected both with HiChIP and C-Hi-C. (G) Heatmap of C-Hi-C data showing the top root-specific loops (RSLs). (H) Examples of root-specific interacting region detected by both C-Hi-C and H3K27me3 HiChIP. Probes used for the C-Hi-C are represented by green bars, the H3K27me3 ChIP-seq signal by red peaks, the C-Hi-C interaction signals by purple lines, and H3K27me3 HiChIP interaction signals by blue lines. (I) Venn diagram representing overlap of loops called from HiChIP and C-Hi-C library sets. Only loops containing specific probes were selected for the comparison in HiChIP. (J) Pie chart representing genes involved in RSLs that are repressed in shoot (blue, 35%), repressed genes in root (red, 54%), and unchanged (gray, 11%) among the genes involved in loops detected both with HiChIP and C-Hi-C.


