
Iterative epigenomic analyses in the same single cell
- 1Laboratory of Cellular Oncology, Center for Cancer Research, National Cancer Institute, National Institutes of Health, Bethesda, Maryland 20892, USA;
- 2Biostatistics and Data Management Section, Center for Cancer Research, National Cancer Institute, National Institutes of Health, Rockville, Maryland 20850, USA;
- 3CCR Collaborative Bioinformatics Resource (CCBR), Center for Cancer Research, National Cancer Institute, National Institutes of Health, Bethesda, Maryland 20892, USA;
- 4Advanced Biomedical Computational Science, Frederick National Laboratory for Cancer Research sponsored by the National Cancer Institute, Frederick, Maryland 21702, USA
Abstract
Gene expression in individual cells is epigenetically regulated by DNA modifications, histone modifications, transcription factors, and other DNA-binding proteins. It has been shown that multiple histone modifications can predict gene expression and reflect future responses of bulk cells to extracellular cues. However, the predictive ability of epigenomic analysis is still limited for mechanistic research at a single cell level. To overcome this limitation, it would be useful to acquire reliable signals from multiple epigenetic marks in the same single cell. Here, we propose a new approach and a new method for analysis of several components of the epigenome in the same single cell. The new method allows reanalysis of the same single cell. We found that reanalysis of the same single cell is feasible, provides confirmation of the epigenetic signals, and allows application of statistical analysis to identify reproduced reads using data sets generated only from the single cell. Reanalysis of the same single cell is also useful to acquire multiple epigenetic marks from the same single cells. The method can acquire at least five epigenetic marks: H3K27ac, H3K27me3, mediator complex subunit 1, a DNA modification, and a DNA-interacting protein. We can predict active signaling pathways in K562 single cells using the epigenetic data and confirm that the predicted results strongly correlate with actual active signaling pathways identified by RNA-seq results. These results suggest that the new method provides mechanistic insights for cellular phenotypes through multilayered epigenome analysis in the same single cells.
A cell can accomplish a number of tasks responding to extracellular and intracellular signals by integrating complex gene-regulatory networks (GRNs) controlled by DNA, the epigenome, RNA, and protein (Davidson and Erwin 2006). Emerging single-cell technologies can now measure components of GRNs, including the genome, the transcriptome, and the proteome (Efremova and Teichmann 2020). These technologies have opened new and exciting opportunities for deciphering and reconstructing GRNs that drive cell functions (Aibar et al. 2017; Stuart et al. 2019; Stuart and Satija 2019; Welch et al. 2019). Yet, advances in single-cell epigenomic analysis are urgently needed to improve reconstruction of reliable and robust GRNs in single cells.
In bulk cell analysis, characterization of multiple histone modifications predicted gene expression more effectively than characterization of single histone modifications (Karlic et al. 2010; Dong and Weng 2013; Singh et al. 2016; Sekhon et al. 2018; Yin et al. 2019). In addition to capturing concurrent patterns of gene expression, broad epigenomic profiling in bulk cells could predict patterns of gene expression and cell phenotype in response to environmental stimuli (Bock et al. 2011; Krausgruber et al. 2020). These observations suggest that characterization of multiple histone modifications and DNA-binding proteins may have a similar potential even at a single cell level. However, technical limitations in current single-cell epigenomic technologies impede a broad profiling of histone modifications, DNA modifications, and DNA-binding proteins.
The nucleosome, the basic unit of chromatin structure and epigenetic signaling module, only possesses one double-stranded DNA segment per nucleosome or one binding site for transcription factors. This limits the number of attainable epigenomic signals per nucleosome resulting in digital/binary-like, sparse sequencing reads. Furthermore, existing single-cell epigenomic technologies cleave genomic DNA and discard the single cells after single use, preventing reanalysis of the same single cell to confirm the results and collect data of additional epigenetic marks. To account for these limitations, we pursued development of a new single-cell method for epigenomic analysis. We hypothesized that a “reusable” single cell can be used to increase sparse single-cell sequencing reads through repeated experiments in the same single cell. Here, we tested whether reusable single cells are a useful tool for detecting multiple epigenetic marks, including histone modifications (H3K27ac and H3K27me3), DNA modifications (5hmC), and genome interacting proteins (MED1 and RNA polymerase II) in the same single cell.
Results
Method design: a reusable single cell for epigenomic analysis (REpi-seq)
The new method consists of two principal sequential steps. The first step (Fig. 1A) generates reusable single cells. Cellular proteins, including nuclear proteins, are modified with monomer acrylamide using a paraformaldehyde (PFA)/acrylamide mixture; the monomer acrylamide on the proteins is incorporated into a polyacrylamide scaffold by polymerizing the acrylamide (Fig. 1A). Individual cells are then embedded in a polyacrylamide gel bead (Supplemental Fig. S1). The second step acquires locational information of individual antibodies on the genome through a series of biochemical reactions (Fig. 1B). Random primers annealed to the genomic DNA are extended with a DNA polymerase to acquire locational information on the genome. A DNA polymerase, which lacks exonuclease activity, is used to protect genomic DNA. Antibodies are conjugated to a DNA probe containing a unique barcode and a ligation sequence (Supplemental Tables S1, S2). The antibodies are incubated with the reusable single cell. After washing the cell, proximity ligation is performed between the antibody–DNA–probe conjugate and the random primers using a ligation adapter with a T4 DNA ligase. The ligated products are amplified by multiple annealing and looping based amplification cycles (MALBAC) (Zong et al. 2012) with a second set of random primers containing a cell-specific barcode (Supplemental Table S3). After eight cycles of MALBAC amplification (“amplification” step in Fig. 1B), the products are collected as supernatant before the second MALBAC PCR amplification and transferred into a separate tube. MALBAC by-products are removed by the reactions shown in Supplemental Figure S2. The antibody–DNA–probe conjugate also contains a T7 promoter sequence. In vitro transcription, RNA purification, and reverse transcription are performed to reduce MALBAC by-products, that is, genome sequences lacking the antibody DNA probe (Supplemental Fig. S2). Products after MALBAC amplification were visualized by agarose gel electrophoresis (Supplemental Fig. S3A). Ligation efficiency monitored at this step (nonligated by-products: <125 bp; ligated products: >140 bp) showed that most products (average 89.73%) were ligated products.
A reusable single cell for epigenomic analysis (REpi-seq). (A) Generating a reusable single cell. (B) Acquiring locational information of individual antibodies on the genome. (*) Unique molecular indexes.
A single cell anchored to a polyacrylamide scaffold is reusable in REpi-seq
We first evaluated whether reusable single cells can retain cellular proteins over repeated heating and cooling cycles, which are used for acquiring locational information of antibodies (Fig. 1B). The results (Supplemental Fig. S1B) indicated that cells treated with 28% acrylamide + 4% PFA before embedding into the polyacrylamide scaffold preserve the highest amount of cellular protein over 100 annealing cycles compared to other solutions.
Next, we tested whether REpi-seq can generate the desired products. We performed the series of reactions (Fig. 1B) using eight single cells anchored to the polyacrylamide scaffold, a single cell embedded into the gel without protein anchoring to the gel, and blank gel (without cells). Antibodies (anti-H3K27ac and anti-H3K27me3) and control IgG were used in the experiment. Final DNA products of REpi-seq (Supplemental Fig. S3B) were quantified using SYBR Gold intensities and normalized based on a 500 ng/lane spike-in control DNA (DNA ladder) in the right and left gels. This quantification showed that the final DNA products of REpi-seq from eight individual cells anchored to polyacrylamide were more abundant than the final REpi-seq DNA products from blank gel (without cells) or gel with cells not anchored to polyacrylamide. In Supplemental Figure S1B, cells not anchored to the polyacrylamide (black line, 0% acrylamide + 0% PFA) lost most cellular proteins during the annealing step, but cells anchored to polyacrylamide retained most cellular proteins. These results suggested that DNA products from single cells anchored or not anchored to the polyacrylamide (Supplemental Fig. S3B) differ. This suggestion was confirmed by shallow sequencing using MiSeq (Supplemental Fig. S3C), which indicated that a single cell anchored to polyacrylamide generates a higher number of desired DNA products containing antibody barcode, ligated sequence, and genomic sequences than single cells without anchoring.
Features of products generated by REpi-seq
We analyzed features of the products generated by REpi-seq identified by having sequences of the antibody probe and proximity ligation. Because the length of genomic sequences acquired by the extension of the first random primer was generally shorter than 32 bp (Supplemental Figs. S4, S5A–G), we checked the mapping accuracy of these short genomic sequences (Supplemental Fig. S5H). On average, the mapping quality score of the mapped reads was 42.02 and the median was 33. A mapping quality score above 30 indicates that the probability of incorrect mapping is <0.1%.
In REpi-seq, the ligated products are amplified by MALBAC. We quantified the number of reads generated by MALBAC that could be mapped to the genome and evaluated MALBAC duplication rates (Supplemental Fig. S6A–J). MALBAC duplicates were identified using the unique molecular identifier (UMI) in the original ligated product, which comprises the antibody barcode, the 8 nt random sequence of the first random primer, and genomic sequences added by the extension. The percentages of amplification duplicates in mapped reads were 10.6% for anti-H3K27ac derived products, 10.4% for anti-H3K27me3 derived products, 18.7% for anti-MED1 derived products, and 20.3% for anti-5hmC derived products. In comparison, the percentages of amplification duplicates in ChIL-seq (Harada et al. 2019) and scChIC-seq (Ku et al. 2019) were 95%–85% and 73.66% (standard deviation ±19.36%), respectively. Therefore, the amplification duplicates in the data shown here were fewer than in previous reports. We removed MALBAC duplicates using the UMI for subsequent data analyses.
The reads remaining after removing the MALBAC duplicates are identified as “unique reads” (Supplemental Fig. S6A–G). On average, the number of unique reads was 699,398 H3K27ac reads/cell, 505,433 H3K27me3 reads/cell, 299,239 5-hydroxymethylcytosine (5hmC) reads/cell, and 93,695 mediator complex subunit 1 (MED1) reads/cell. The number of unique reads derived from specific antibodies was consistently larger than from control IgG. We compared single-cell unique reads in REpi-seq to other methods for detection of single-cell histone reads. Chromatin immunoprecipitation–based scChIP-seq (Rotem et al. 2015) detects up to 800 unique reads/cell. CUT&RUN technology, scChIC-seq (Ku et al. 2019), detects up to 4100 unique reads/cell. In transposase-based approaches, CoBATCH (Wang et al. 2019b) and ChIL-seq (Harada et al. 2019) detect up to 12,000 and 350,000 unique reads/cell, respectively. Therefore, our results for histone modifications suggest that repeating the same experiments with the same single cells can increase the number of unique reads per cell.
Evaluation of methodological bias in REpi-seq
REpi-seq uses a random primer to acquire locational information of antibodies on the genome. Previous experiments have reported that the length of random primer and the ligation sequence can affect GC bias and uniformity of genome coverage (Rosseel et al. 2013). We designed the first random primer to have 8 nt of random sequence, longer than the more common random hexamer. In the sequence for proximity ligation, we used a thymine base immediately upstream of the random sequence. The nucleotide at this position has a strong effect on annealing bias of random primers (Rosseel et al. 2013). To evaluate bias in random priming with our first random primer, we measured the nucleotide content in products of the 8-nt random sequence in IgG-derived products (Supplemental Fig. S7A). Guanine and cytosine representation (28.18% and 31.29%, respectively) was higher than random (25%), showing some degree of bias. We evaluated further the effect of this GC bias on uniformity of genome coverage using Lorenz curves (Supplemental Fig. S7B). Using data from control IgG, the proportion of uncovered genome (1× coverage with 10 kb bin size) was 8.57% in REpi-seq, 7.73% in bulk ChIP-seq, and 33.38% in single-cell ChIL-seq (Harada et al. 2019). These results indicated that bias in REpi-seq is smaller than in ChIL-seq and closer to that in bulk ChIP-seq. A visual comparison of read distribution in REpi-seq (control IgG) and ChIP-seq (control IgG and input control) showed that ChIP-seq generated larger peaks than REpi-seq (Supplemental Fig. S7C). To evaluate potential bias based on chromatin structure, we analyzed read distribution in euchromatin and heterochromatin regions (Supplemental Fig. S7D). Bulk ChIP-seq reads (input control) showed some structural bias for euchromatin regions compared to REpi-seq reads from polyacrylamide-anchored single cells using 4% PFA combined with 5%–28% acrylamide. These results suggest that anchoring cellular proteins to a polyacrylamide scaffold may help reduce REpi-seq bias based on chromatin structure.
Analysis of REpi-seq bias for nucleosome positions
REpi-seq acquires locational information of individual antibodies on the genome using the first random primer and antibodies in combination with a series of biochemical reactions. We evaluated the presence of bias in REpi-seq products. Because nucleosomes alter accessibility of enzymes and molecules to genomic DNA (Schones et al. 2008; Gangadharan et al. 2010; Cui and Zhao 2012), we specifically evaluated nucleosome-related bias in REpi-seq. For this analysis, we used unique reads from control IgG rather than unique reads from specific antibodies because these would reflect the nonrandom distribution of specific targets. Control IgG unique reads showed some positive bias for the 5′ location of nucleosomes and some negative bias for the 3′ location of nucleosomes (±0.04 reads difference between 5′ and 3′ locations at nucleosomes) (Supplemental Fig. S8A). However, this bias appears quantitatively minor when compared to the distribution of H3K27ac-specific unique reads (Supplemental Fig. S8B).
Preservation of nuclear protein positions over repeated experiments
Because cellular proteins were mostly retained over repeated annealing cycles (Supplemental Fig. S1B), we evaluated whether REpi-seq maintains the relative position of nuclear proteins and genomic DNA over repeated experiments. We repeated the same experiment three times using the same eight single cells with anti-H3K27ac, anti-H3K27me3, and control IgG. Amplification duplicates were computationally removed based on combinations of antibody barcode, 8-nt random sequence of the first random primer, and mapped position of the 5′ end on the genome. After removal of amplification duplicates, we analyzed the read distribution in the first, second, and third repeated experiment (Fig. 2A,B). First, we identified the location on the genome of unique reads detected in the first experiment (green). Subsequently, we identified the distribution of unique reads detected in the second (blue) and the third (red) repeated experiments in the same genomic regions detected in the first experiment. Read distribution patterns in the second and third experiments showed similar patterns to those found in the first experiment. These results indicate that the position of H3K27ac and H3K27me3 marks is closely maintained over three replicate experiments. These results also indicate that unique reads detected in one experiment could be redetected in repeated experiments. Read redetection was analyzed in each single cell over three repeated experiments (Supplemental Fig. S9A,B). On average, 52.49% H3K27ac and 50.36% H3K27me3 unique reads in an experiment were redetected in one repeated experiment with the same single cell. In three replicates, 62.03% of H3K27ac reads in an experiment was confirmed by an additional two repeated experiments. These results indicate that polyacrylamide-anchored single cells can be used to confirm epigenetic signals by repeating the same experiments with the same single cell. In addition, these results support the conclusion that the polyacrylamide-anchored single cells are reusable at least three times.
Repeated experiments identify reproduced reads in the same single cells. (A,B) Genomic location of H3K27ac (A) and H3K27me3 (B) marks is preserved over repeated experiments in eight single K562 cells. Genomic regions containing reads in the first experiment were analyzed in the two subsequent experiments. Read distribution in the first (green line), second (blue line), and third (red line) experiment is shown. (C,E) Number of genomic regions (500 bp) with reproduced antibody reads (false-positive rates <1% by the bootstrap procedure compared to IgG and randomized antibody reads) in each single cell (for details, see Supplemental Methods). Data sets from three repeated experiments with the same single cell were combined before identifying the genomic region with reproduced reads. The bootstrap procedure was performed separately in each single cell. Genomic regions with reproduced antibody reads were identified by the bootstrap procedure based on estimated false-positive rates (<1%). (D,F) Number of reproduced reads per cell from antibodies to H3K27ac (D) and H3K27me3 (F) (for details, see Supplemental Methods). Horizontal bars show the mean of eight single cells, and error bars represent standard deviation.
Repeated experiments identify reproducible single-cell reads by statistical analysis
Current single-cell epigenomic methods (Rotem et al. 2015; Carter et al. 2019; Harada et al. 2019; Ku et al. 2019; Wang et al. 2019b) identify peaks by aggregating single-cell data using peak calling tools (Wilbanks and Facciotti 2010; Feng et al. 2012; Bailey et al. 2013) developed for bulk ChIP-seq. We tested whether the peak calling software MACS2 and SICER can distinguish peaks from background noise in data sets from one cell. We analyzed ChIL-seq H3K27ac data sets (Harada et al. 2019) with a variable input cell number (10,000, 1000, 100 cells, and 1 cell). The number of H3K27ac peaks identified by MACS2 decreased as we decreased cell number (Supplemental Fig. S10). No peak was identified from one cell. SICER also detected no peak from one cell. This analysis indicates that the number of “peaks” identified is affected by cell number and is reduced to zero when one cell only is analyzed. For “peak calling”/identification of epigenetic marks in one cell without aggregating single-cell data sets, we tested whether a statistical approach, the “bootstrap” procedure (Efron 1979; Westfall et al. 1990; Lin 2005; Seaman and Müller-Myhsok 2005; Conneely and Boehnke 2007; Han et al. 2009; Goodhue et al. 2012; Joo et al. 2016) can identify the genomic regions with epigenetic marks in one cell by repeating experiments with the same single cell.
To establish whether reproduced reads from specific epigenetic antibodies differ from those of control IgG and stochastic background, we analyzed further the data from the three repeated experiments using the same reusable single cells. Specifically, we applied the bootstrap statistical procedure (Supplemental Methods) to each 500-bp genomic region (shifted every 250 bp) from each of the triplicate experiments with each single cell to identify genomic regions where antibody-derived reads are enriched compared to control IgG and stochastic noise. The test results identified, on average, 125,502 genomic regions with reproduced H3K27ac reads (Fig. 2C) and 136,387 genomic regions with reproduced H3K27me3 reads in each cell (Fig. 2E). These regions were different from control IgG and accidental redetection by the specific antibody (false-positive rates <1%). These regions with reproduced reads contained, on average, 556,432 H3K27ac reads per cell (Fig. 2D) and 375,756 H3K27me3 reads per cell (Fig. 2F). Single cell 3 was an outlier for H3K27me3 (Fig. 2E,F). However, single cell 3 showed an inverse trend for H3K27ac (Fig. 2C,E), suggesting that results from single cell 3 are not reflective of experimental error.
The results in Figure 2C–F indicate that the regions (each encompassing 500 bp) most enriched with H3K27ac and H3K27me3 unique reads contain, on average, 4.91 and 3.81 reads/cell, respectively. Because DNA wrapping around a nucleosome is 146 bp long and linker DNA is up to 80 bp long, a 500-bp genome region may contain a maximum of 2–3 nucleosomes. Because a nucleosome contains two copies of histone H3, each 500-bp stretch of the genome contains at most 4–6 copies of histone H3. Therefore, the average frequencies of 4.91 H3K27ac and 3.81 H3K27me3 reads per 500-bp region detected here by REpi-seq likely reflect high-density signal regions. In a single-cell experiment, one nucleosome can only generate a few reads because one nucleosome only has one 146-bp-long stretch of dsDNA. Results from repeated single-cell experiments revealed read patterns from epigenetic antibodies that are distinct from the random pattern of controls. In the subsequent analysis we used the term “reproduced reads” to indicate sequencing reads with false-positive reproducibility rates <1% by the bootstrap procedure.
Precision and sensitivity of REpi-seq reads
H3K27ac and H3K27me3 unique reads shown in Supplemental Figure S6 were further evaluated relative to ChIP-seq results from bulk K562 cells (Supplemental Fig. S11A,B). To this end, we analyzed the precision (Rotem et al. 2015) by calculating the percentage of antibody reads derived from REpi-seq overlapping with ChIP-seq peaks identified by bulk cell analysis. The precision of REpi-seq for detection of H3K27ac is, on average, 91% ± 3.24% (Supplemental Fig. S11A). Current single-cell epigenomic techniques for detection of active histone marks display a “precision” of 53% (Drop-ChIP; H3K4me3) (Rotem et al. 2015), 50% (scChIC-seq; H3K4me3) (Ku et al. 2019), and 60% (ACT-seq; H3K4me3) (Carter et al. 2019). Therefore, REpi-seq detection of H3K27ac has a high degree of precision. REpi-seq shows 52.09% ±3.71% precision for detection of H3K27me3 (Supplemental Fig. S11B). Single-cell ChIC-seq (Ku et al. 2019) reported 47% precision for the detection of H3K27me3. Overall, these results indicate that the precision of REpi-seq detection of H3K27ac and H3K27me3 is high.
Additionally, REpi-seq sensitivity was evaluated by analyzing how many peaks detected by ChIP-seq were also detected by REpi-seq reproduced reads (Supplemental Fig. S11C,D). The results show that 55.30% H3K27ac and 50.94% H3K27me3 peaks detected by ChIP-seq were also detected by REpi-seq reproduced reads. This level of sensitivity from REpi-seq appears higher than that observed in other cutting-edge technologies for single-cell epigenomic analysis: the sensitivity of Drop-ChIP is up to 5% in (H3K4me3) (Rotem et al. 2015), the average sensitivity of ACT-seq is 5% (H3K4me3) (Carter et al. 2019), and average sensitivity of scChIC-seq is 9.5% in (H3K27me3) (Ku et al. 2019).
Evaluation of reproduced reads at promoters and enhancers
Because histone H3K27ac is enriched at promoter and enhancer regions (Creyghton et al. 2010), we evaluated the location of REpi-seq H3K27ac reproduced reads in promoters and enhancers by comparing with bulk ChIP-seq results (Fig. 3A–D). For this analysis, we used the human active enhancers to interpret regulatory variants (HACER) atlas (Wang et al. 2019a), which defines cell-specific active enhancers based on bidirectional enhancer RNA expression and validated enhancer–promoter interactions in 265 human cell types. HACER also contains experimentally validated data based on active enhancers–promoter interaction. In HACER, K562 cell enhancers and promoters are classified into two groups: K562 cell type–specific, active enhancer/promoter (referred to here as K562-active enhancer/promoter) and K562 cell type–nonspecific, active enhancer/promoter (referred to here as other active enhancer/promoter). REpi-seq detected 9974 promoters with reproduced read enrichment (false-positive rates <5%), 62.93% of which were confirmed by bulk ChIP-seq data (Fig. 3A). Among the K562-active promoters (Fig. 3B), REpi-seq detected 4212 promoters, 77.28% of which were confirmed by bulk ChIP-seq data. Among other active enhancers (Fig. 3C), REpi-seq detected 78,874 enhancers enriched with the reproduced reads (false-positive rates <5%), 25.77% of which were confirmed by bulk ChIP-seq data. Among K562-active enhancers detected by REpi-seq (Fig. 3D), 73.89% were confirmed by bulk ChIP-seq data. The 73.89% confirmation rate of K562-active enhancers is higher than the 25.77% confirmation rate of other active enhancers. These results indicate that reproduced reads identified by REpi-seq combined with the bootstrap procedure detect established cell-specific enhancers. These results further suggest that REpi-seq can detect other, cell type–nonspecific, active enhancers in K562 cells.
Evaluation of REpi-seq reproduced reads. (A–D) REpi-seq reproduced reads evaluated by bulk ChIP-seq. H3K27ac reproduced reads from eight single cells were combined before statistical analysis. Enrichment of H3K27ac reproduced reads was analyzed in all promoters (A), K562 cell type–specific, active promoters (B), K562 cell type–nonspecific, active enhancers (C), K562 cell type–specific, active enhancers (D). Significance of reproduced read enrichment in promoters and enhancers was calculated by the bootstrap procedure. Promoters and enhancers enriched with reproduced reads (false-positive rates <5%) are shown in the Venn diagrams (for details, see Methods). Promoters or enhancers detected by REpi-seq and confirmed by bulk ChIP-seq are indicated as percentages in the center of Venn diagrams. (E–H) Evaluation of REpi-seq reproduced reads by enhancer classification. Enhancers were classified by the relative ratio log2(H3K27ac/H3K27me3), as detailed in Supplemental Methods. H3K27ac (E), H3K27me3 (F), MED1 (G), and 5hmC (H) read counts in the classified enhancers are shown in the y-axis.
Enhancer classification using H3K27ac and H3K27me3
The presence of H3K27ac uniquely marks active enhancers that activate genes (Creyghton et al. 2010; Rada-Iglesias et al. 2011). Poised or inactive enhancers that are linked to inactive genes are distinguished by the absence of H3K27ac and enrichment of H3K27me3 (Rada-Iglesias et al. 2011). Ratios of H3K27ac/H3K27me3, but not simply by the presence or absence of H3K27ac or H3K27me3, explain changes in gene expression during hematopoietic lineage differentiation (Prescott et al. 2015; Gray et al. 2017). Here, we used relative ratios log2(H3K27ac/H3K27me3) (shown in the x-axis) (Fig. 3E–H) to classify the enhancers from REpi-seq results. Results are expressed as the average number of H3K27ac (y-axis) (Fig. 3E) and H3K27me3 (y-axis) (Fig. 3F) reproduced reads per kilobase/enhancer. Consistent with previous reports (Creyghton et al. 2010; Rada-Iglesias et al. 2011), enhancers with log2(H3K27ac/H3K27me3) values above 6 were exclusively H3K27ac-positive (H3K27me3-negative). In the transitional −5 to +5 range, H3K27ac-reproduced reads were dominant in the 0 to +5 range, whereas H3K27me3-reproduced reads were dominant in the 0 to −5 range. In the less than −5 range, H3K27me3 was exclusively positive in enhancers (H3K27ac-negative). These results indicate that reproduced reads from REpi-seq could classify enhancers into at least three groups: poised enhancers (exclusively H3K27me3-positive), intermediate enhancers (transitional), and active enhancers (exclusively H3K27ac-positive).
Superenhancers are clusters of highly active enhancers marked by high-level H3K27ac, high-density master transcription factors, and mediator complexes (Whyte et al. 2013). Therefore, if the enhancer classification by REpi-seq (Fig. 3E,F) is correct, mediator complex subunit1 (MED1) should be enriched in the active enhancers. To examine this, we retested the same eight single cells with anti-MED1 antibody and control IgG (fourth experiment). MED1 unique reads with false-positive rates <1% were identified by the bootstrap procedure using aggregate data sets from eight single cells (Supplemental Fig. S12A,B). This aggregate data identified common MED1 reads among the eight single cells based on redetection of reads over control IgG and stochastic noise (levels of accidentally reproduced antibody reads). The results from counting MED1 reads in the enhancers classified by REpi-seq show that MED1 reads are enriched in the active enhancers, especially in the most active enhancers (Fig. 3G). These results also indicate that REpi-seq data can correctly identify the epigenetic status of enhancers as defined by the relative ratio of log2(H3K27ac/H3K27me3).
We evaluated further the enhancer classification using the additional epigenetic mark, 5-hydroxymethylcytosine (5hmC). Stroud et al. (2011) reported that 5hmC is significantly enriched in enhancers with H3K27ac. In addition, 5hmC is generated by the enzyme tet methylcytosine dioxygenase 1 (also known as ten-eleven translocation 1; TET1) (Ito et al. 2011; Williams et al. 2011) that interacts with MED1 superenhancer complex (Ding et al. 2015). If the enhancer classification by REpi-seq is correct, 5hmC should be enriched in active enhancers. For this evaluation, we retested the same eight single cells with anti-5hmC and control IgG (fifth experiment with the same single cells). 5hmC reads with false-positive rates <1% were identified based on the bootstrap procedure using aggregate data sets from eight single cells (Supplemental Fig. S12C,D). We calculated the average number of 5hmC reads (false-positive rates <1%) in each classified enhancer range. Consistent with previous reports (Stroud et al. 2011), the results indicate that the 5hmC reads (false-positive rates <1%) are enriched in the active enhancers (Fig. 3H). These results also indicate that the H3K27ac- and H3K27me3-reproduced reads from REpi-seq can correctly recognize the epigenetic status of enhancers. Furthermore, these results indicate that the reusable single cells are reusable at least five times in REpi-seq, and that REpi-seq can analyze at least four epigenetic marks in the same single cells.
Evaluation of reproduced reads in enhancers based on gene targets
The results of REpi-seq testing provide evidence that H3K27ac and H3K27me3, combined, can correctly identify active enhancers in K562 single cells. We now assessed the function of these active enhancers by focusing on interacting genes. The HACER data set (Wang et al. 2019a) contains experimentally validated interactions between enhancers and genes from 4D Genome (Teng et al. 2015) and chromatin interaction studies from Hi-C, ChIA-PET, HiChIP, and Capture Hi-C (Fullwood et al. 2009; Li et al. 2012; Mifsud et al. 2015; Tang et al. 2015; Teng et al. 2015; Hnisz et al. 2016; Mumbach et al. 2016; Schuijers et al. 2018; Wang et al. 2019a). K562-active enhancers detected by REpi-seq (2363 enhancers) and by bulk ChIP-seq (3938 enhancers) interact with 3154 and 5002 genes, respectively (Fig. 4A). Interacting genes identified by REpi-seq were mostly (93.18%) common with those identified by bulk ChIP-seq. Among other active enhancers (Fig. 4B), overlap between REpi-seq and bulk ChIP-seq (78.44%) was smaller than with the K562-active enhancers (93.18%). Because enhancer–promoter/gene interactions transmit enhancer activity to target genes (Robson et al. 2019), these results suggest that reproduced reads from REpi-seq can correctly capture sets of enhancers that regulate functions of K562 single cells.
Evaluation of REpi-seq reproduced reads by target genes and target pathways. (A,B) Number of genes interacting with K562 cell type–specific, active enhancers (A) and K562 cell type–nonspecific, active enhancers (B). The activity of enhancers was determined by the relative ratio log2(H3K27ac/H3K27me3) from bulk ChIP-seq and REpi-seq data, as detailed in Methods. The results show the percent interacting genes detected by ChIP-seq of bulk K562 cells that were codetected by single cell REpi-seq. (C) Process for transmission of promoter + enhancers activity to a gene and extrapolating the biological function of active enhancers and promoters. (D) Enriched canonical pathways identified by bulk ChIP-seq and REpi-seq. Activation Z-scores from ChIP-seq (x-axis) and REpi-seq (y-axis) are shown; the Pearson correlation coefficient was calculated. (E) Differential gene expression in bulk K562 and H1 cells by RNA-seq. The top 5000 transcripts in K562 and H1 cells were used as input data in F and G. (F,G) Enriched canonical pathways identified by REpi-seq (eight single K562 cells) and RNA-seq from bulk K562 cells (top 5000 transcripts) (F), and by REpi-seq (eight single K562 cells) and RNA-seq from bulk H1 cells (top 5000 transcripts) (G).
Evaluation of reproduced reads in enhancers and promoters based on canonical signaling pathways
We further evaluated reproduced reads from REpi-seq by pathway enrichment analysis (Krämer et al. 2014). To this end, we focused on analysis of genes proximal to active enhancers and promoters detected by REpi-seq and bulk ChIP-seq. Because enhancer–promoter/gene interactions transmit enhancer activity to target genes (Robson et al. 2019), we mimicked this transmission in silico. We calculated the combined relative scores [log2(H3K27ac/H3K27me3)] of enhancers and promoters and transmitted this score to the proximal gene (Fig. 4C). The transmitted scores to genes were used in pathway enrichment analysis. By comparing the 5000 genes with the highest scores (putatively active genes) from REpi-seq and bulk ChIP-seq, we found that 88.21% of the enriched canonical pathways (referred to here as “pathways”) from REpi-seq were common to the enriched pathways from bulk ChIP-seq (Fig. 4D). Activation Z-scores of the enriched pathways from REpi-seq and bulk ChIP-seq showed a strong correlation (Pearson correlation coefficient, r = 0.875). We further evaluated the results of pathway enrichment from REpi-seq data by analysis of RNA-seq data of bulk cells. The top 5000 transcripts from bulk K562 cells and bulk H1 cells (embryonic stem cells) were used in pathway enrichment analysis (Fig. 4E). The RNA-seq data from H1 cells were used as a reference control. Most (89.15%) of the enriched pathways from REpi-seq were confirmed as enriched pathways from bulk RNA-seq of K562 cells (Fig. 4F). Activation Z-scores of the enriched pathways from RNA-seq and REpi-seq showed a strong correlation (Pearson correlation coefficient, r = 0.864). However, only 17.92% of the enriched pathways from REpi-seq overlapped with the enriched pathways of bulk H1 RNA-seq (Fig. 4G), and the overlapped pathways were poorly correlated (Pearson correlation coefficient, r = 0.365). These results suggest that reproduced reads from REpi-seq are useful to infer downstream functions of epigenetically active enhancers.
Epigenetic signatures generated by REpi-seq
The results of Figure 4 supported the conclusion that reproduced reads from REpi-seq reflect activation at cis-elements, gene targets of cis-elements, and pathways linked to putative active genes. Next, we evaluated at a cellular level the significance of reproduced reads generated by REpi-seq. To this end, we used the epigenetic status [log2(H3K27ac/H3K27me3)] of enhancers and promoters to compare cell types by stochastic neighbor embedding (t-SNE) (Fig. 5A). K562 single cells analyzed by REpi-seq (red dots) were compared to bulk K562 cells (blue dots) and other cell types analyzed by ChIP-seq in the ENCODE Project (148 data sets were used here; for details, see Supplemental Table S4). Other cell types included in this analysis are hematopoietic malignant cell lines (orange dots, nine cell lines), primary hematopoietic cells (magenta dots, 15 cell types), endothelial cells (yellow dots, one cell type), fibroblasts (green dots, four cell lines plus four primary cell types), and myoblasts (light blue dots, one primary cell type). Results of t-SNE show that K562 single cells and K562 bulk cells differ from endothelial cells, fibroblasts, and myoblasts. The K562 single and bulk cells bordered hematopoietic malignant cell lines and primary hematopoietic cells, consistent with the K562 cell line being a myelogenous leukemia cell line (Lozzio and Lozzio 1975). Contour plots of K562 single cells (red lines) and K562 bulk cells (blue lines) indicate epigenetic similarities between data sets from K562 single and bulk cells (Fig. 5A). These data support the conclusion that reproduced reads generated by REpi-seq can capture cell type–specific epigenetic signatures at a cellular level.
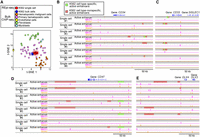
Visualization of epigenetic signatures generated by REpi-seq using dimensionality reduction. (A) Dimensionality reduction of whole data sets generated by REpi-seq and bulk ChIP-seq. Epigenetic status of enhancers and promoters was determined from bulk ChIP-seq data of various cell types and from REpi-seq of eight K562 cells by log2(H3K27ac/H3K27me3), as detailed in the Supplemental Methods. K562 single cells analyzed by REpi-seq (red) were compared with bulk cells, K562 bulk cells (blue), hematopoietic malignant cell lines (orange, nine cell lines), primary hematopoietic cells (magenta, 15 cell types), endothelial cells (yellow, one cell type), fibroblasts (green, four cell lines and four types primary cells), and myoblasts (light blue dots, one primary cell type). Bulk ChIP-seq data are from the ENCODE (148 data sets, listed in Supplemental Table S4). Dimensions of cell data were compressed by t-stochastic neighbor embedding (t-SNE). (B–E) Identified active enhancers, MED1, and 5hmC reads by statistical analysis. Significant activation of enhancers was determined by the bootstrap procedure (false-positive rates <5%) using data sets of H3K27ac and H3K27me3 generated by REpi-seq. Identified active enhancers were further classified into K562 cell type–specific, active enhancers (green), and K562 cell type–nonspecific, active enhancers (red) by bulk ChIP-seq data. MED1 and 5hmC reads (false-positive rates <1%) were also identified by statistical analysis, the bootstrap procedure. Loci of CD34 (B), CD33 (C), CD47 (D), and DLX4 (E) are shown. See also Supplemental Figure S12.
Active enhancer usage and association with MED1 among single cells
Figure 3, C through H, shows the association of MED1 and 5hmC with active enhancers. K562 cells have features shared by common myeloid progenitors (CMPs), megakaryocyte-erythroid progenitors (MEPs), and/or granulocyte-monocyte progenitors (GMPs), and display differentiation potential along the erythroid, myeloid, and megakaryocytic lineages (Klein et al. 1976; Andersson et al. 1979; Lozzio et al. 1981). CD34 is expressed in CMP and GMP, but not in MEP (Warren et al. 2006). Stem-like chronic myeloid leukemia cells are marked by CD33 and CD47 (Valent et al. 2014). The epigenetic status of the CD34 locus, the CD33 locus, and the CD47 locus in the eight K562 single cells is shown in Figure 5, B through D. K562-active enhancers (green) and other active enhancers (red) were detected in some of the single K562 cells by REpi-seq. In addition, MED1 and 5hmC marked active enhancers and other regions in most cells, suggesting the occurrence of interaction between some of the active enhancers and the mediator complex. These results indicate that the CD34, CD33, and CD47 genes could be epigenetically active in some of the K562 cells. Supporting these results, single-cell RNA-seq confirmed that CD34, CD33, and CD47 are expressed in 2.34%, 54.3%, and 52.63% of K562 cells, respectively (Hendriks et al. 2019).
Megakaryocytic differentiation is induced in K562 cells by the homeobox transcription factor DLX4, whereas erythroid differentiation is repressed. Other active enhancers were detected upstream of the DLX4 locus, some of which were marked with MED1 (Fig. 5E), suggesting an epigenetic bias toward megakaryocytic differentiation in some of the K562 cells.
K562 cells have been used as a human leukocyte antigen (HLA)-deficient cell line to measure cytotoxicity of natural killer cells (Nagel et al. 1981). Expression of HLA genes can be induced in K562 cells by sodium butyrate, which inhibits histone deacetylation and increases histone acetylation (Sutherland et al. 1985). Our analysis of HLA-A, HLA-B, and HLA-C loci (Supplemental Fig. S13A–C) is consistent with previous reports (Nagel et al. 1981; Sutherland et al. 1985) in showing that these regions are mostly epigenetically inactive, except for upstream regions of HLA-B in single cells 5 and 6. Overall, the results in Figure 5, B through E, and Supplemental Figure S13, A through C, indicate that REpi-seq can identify the activation status of cis-elements, association of a DNA-binding protein, and DNA modification in the same single cell.
Detecting RNA polymerase II in the same single cells
The data presented thus far support the conclusion that REpi-seq can analyze at least four epigenomic marks, inclusive of H3K27ac, H3K27me3, MED1, and 5hmC, in the same single cell. These are relatively stable and abundant epigenomic marks in cells. We now evaluated RNA polymerase II (Pol II phosphorylated at Serine 5) as an example of a less abundant (<80,200 molecules/cell) and transient DNA binder (204–307 sec residence at transcription start site [TSS]) (Darzacq et al. 2007; Zhao et al. 2014). The same single cells (1–8) were reused and reanalyzed with anti-RNA polymerase II (phosphorylated Serine 5, Pol II) and control IgG. As shown in Supplemental Figure S14A, we identified, on average, 7322 Pol II unique reads/cell (up to 21,736 Pol II reads/cell) compared to control IgG and stochastic noise (false-positive rates <1%). In K562 cells, phosphorylated Pol II is approximately one-third of the total Pol II (data from ENCODE 61727), predicting that the number of phosphorylated Pol II molecules/cell is lower than 26,733. Therefore, REpi-seq detected Pol II reads at a high rate.
Next, we evaluated the Pol II unique reads (false-positive rates <1%) based on the distribution pattern around the TSS (Supplemental Fig. S14B). REpi-seq detected Pol II reads (green line) around the TSS. Pol II is loaded at the TSS after phosphorylation of Serine 5, and is present at 20–60 nts downstream from the TSS for 240 sec (Darzacq et al. 2007; Fuchs et al. 2014). The sharp peak of phosphorylated polymerase II reads detected by REpi-seq immediately downstream from the TSS is consistent with the temporal pausing of the polymerase around positions 20–60 nts from the TSS. Pol II reads from REpi-seq were further evaluated by Pol II ChIP-seq (Supplemental Fig. S14C). Eight K562 single cells have a total of 59,338 Pol II reads; 79.56% of Pol II REpi-seq reads were also observed in Pol II bulk ChIP-seq of K562 cells. These Pol II reads were observed in gene body and/or TSS (Supplemental Fig. S14D). On average, 2370 genes/cell were detected as Pol II-positive genes (Pol II+ genes) in a single cell. To evaluate these results, we counted the number of genes transcribed in K562 cells over 60 min by analyzing data sets of K562 single cells reported by Hendriks et al. (2019) using new transcriptome alkylation-dependent single-cell RNA sequencing (NASC-seq); results of this analysis are shown in Supplemental Figure S14E. On average, 612 genes/K562 cell were transcribed over 60 min, suggesting that Pol II is present on the body of these genes. We found that a portion of Pol II+ genes detected by REpi-seq (44.36%, 5477 genes) were codetected by single-cell RNA-seq (NASC-seq) (Supplemental Fig. S14F). In addition, 76.26% Pol II-negative genes (Pol II− genes) in REpi-seq were also negative in NASC-seq (Supplemental Fig. S14G). These results represent the first detection of Pol II in a single cell and support the possibility that reusable single cells are a useful tool to capture unstable and transient interactions between a protein and genomic DNA at the single cell level.
Discussion
Here, we provide initial evidence that the reusable single cell is amenable to reanalysis of epigenetic marks at least six times. This feature of reusable single cells stems from nuclear proteins and genomic DNA preserving their proper location over repeated experiments. REpi-seq is a novel single-cell method that takes advantage of reusable single cells for identification of multiple epigenetic marks in single cells controlling cis-regulatory elements (Fig. 3), gene targets and downstream pathways of cis-regulatory elements (Fig. 4), and cell identity and function (Fig. 5A).
The method first described here is in its infancy and has limitations, but its novelty and potential are clear. There are two novel elements key to REpi-seq. The first is the ability to more broadly characterize the epigenome at a single cell level. Thus far it has been challenging to increase the number of histone modifications and DNA-binding proteins one can analyze in the same single cell. Our results show that at least five epigenetic marks could be analyzed in the same single cell based on the reusability of individual single cells. This advance magnifies the potential for detection of epigenetic differences among single cells. This is important because detection of multiple histone modifications in bulk cell populations has been shown to improve predictions of gene expression using deep learning approaches (Karlic et al. 2010; Dong and Weng 2013; Singh et al. 2016; Sekhon et al. 2018; Yin et al. 2019). In addition, broader epigenetic profiling can better predict responses of cells to extracellular cues (Bock et al. 2011; Krausgruber et al. 2020) and provide mechanistic insights into cellular phenotypes.
The second novel element of REpi-seq is the approach taken to analytical analysis of the results. Previous approaches for identification of single-cell epigenetic signals have relied on data aggregation, such that only common signals among cells are identified. We have utilized the bootstrapping procedure to rank reproducible reads of a single cell based on false-positive rates without relying on data aggregation from multiple cells. As a result, distinguishing features of individual cells can now be reliably identified. This indicates that REpi-seq is most equipped at investigating cell-to-cell epigenetic differences.
The number of replicates required for the bootstrap procedure in single-cell REpi-seq is a minimum of two replicates. Three replicates showed an increased number of reproduced reads (two replicates: 52.49%; three replicates: 62.03%), but users can determine the number of replicates based on the desired level of accuracy.
The experiments presented in this report were performed manually, without automation, as a proof-of-principle. This is a limitation of REpi-seq as presented. Automation using robots, microfluidics, or other innovative approaches are currently being tested to scale up REpi-seq throughput, and initial results have shown substantial advantages from automation of steps in the assay.
Currently, effective analysis of epigenetic mechanisms of gene expression and cell responses in single cells is challenging. The current results suggest that analysis of multiple epigenetic marks is possible at a single cell level and may allow predicting gene expression and cellular responses in single cells.
Methods
Cell culture
The origin of K562 cells and culture method is described in Supplemental Methods (1-1).
Overview of REpi-seq protocol
The REpi-seq method consists of two main parts. The first part generates reusable single cells; we used K562 cells (see Supplemental Methods, section 1-2, Cell Culture). Cellular proteins are modified with monomer acrylamide by soaking cells washed with TBS buffer into an acrylamide/bis-acrylamide/ammonium persulfate solution (see Supplemental Methods, section 1-3, Preparation of “Reusable” Single Cells). A single cell is transferred into a PCR tube using a micromanipulator (ALS CellCelector or PicoPet) under microscopy. The single cell is embedded into a 3 µL polyacrylamide bead (4% gel) by polymerizing the acrylamide solution. Cellular proteins are anchored to the polyacrylamide polymer of a polyacrylamide gel.
The second part of the method acquires locational information of antibodies on the genome of the reusable single cell. First, cytoplasmic and nuclear membranes are permeabilized with 1% Triton X-100 and methanol treatment (see Supplemental Methods, section 1-4, Permeabilization of Cell and Nuclear Membranes in “Reusable” Single Cells). A first random primer is annealed to the genomic DNA of the reusable single cell (see Fig. 1; Supplemental Methods, section 1-6, Annealing 1st Random Primer). The first random primer consists of two parts: a random 8-nt sequence and a DNA scaffold sequence for proximity ligation with an antibody DNA probe. Once annealed to the genome, the first random primer is slightly extended to stabilize its binding to the genome (see also Supplemental Methods, section 1-7, Extension of Annealed 1st Random Primer). After the extension, specific antibodies and control IgG are incubated with the single cell overnight (see also Supplemental Methods, section 1-8, Antibody Binding). The antibodies and control IgG are conjugated to a DNA probe, which has a unique DNA sequence that serves as a barcode in data analysis (see Supplemental Methods, section 1-5, Antibody Conjugation to DNA Probe). Nonbinding first random primer, antibodies, and control IgG are removed by washing. Subsequently, the antibody DNA probe and the scaffold sequence of the first random primer are connected using a complementary DNA and T4 DNA ligase. This proximity ligation requires that the distance between the antibody and the first random primer is < 28.56 nm (see Supplemental Methods, section 1-9, Proximity Ligation of Antibody Probe and a Random Primer). The proximity ligation products are amplified by modified multiple annealing and looping based amplification cycles (MALBAC) (Lu et al. 2012; Zong et al. 2012). During MALBAC, the first random primer is fully extended by Bst DNA polymerase and dissociated from the genomic DNA. MALBAC generates genomic amplicons that do or do not contain the antibody probe, which contains a T7 promoter sequence. To reduce the genome-derived by-products, in vitro transcription, RNA purification, and reverse transcription are performed (see Supplemental Methods, sections 1-10, amplification of proximity ligation products, and 1-11, removing genome-derived MALBAC byproducts by in vitro transcription and reverse transcription). The final products contain the antibody barcode, the 8-nt random sequence (used as a unique molecular index), and the genomic sequence of the extended first random primer, allowing identification of the genomic location of the antibody.
Antibody conjugation to DNA probe
A DNA probe was conjugated to an antibody as previously described (Grotzky et al. 2012). DNA probes used are listed in Supplemental Table S1. The DNA probe contains an antibody barcode unique to each antibody (Supplemental Table S2). A detailed protocol is described in Supplemental Methods (1-2).
Preparation of reusable single cells
Details of the protocol are described in Supplemental Methods (1-3). In brief, a K562 single cell was isolated into a PCR tube and treated with a mixture of paraformaldehyde and acrylamide for 1 h at room temperature. The single cell was then immersed into acrylamide solution (acrylamide/bis-acrylamide/ammonium persulfate/PBS). The acrylamide solution was polymerized by adding mineral oil containing N,N,N,N-Tetramethyl ethylenediamine.
Data analyses
The following methods of data analyses are described in Supplemental Methods: GC contents; Lorentz curves; data visualization by Integrative Genomics Viewer; methodological bias evaluations; read redetection by repeated experiments; accuracy of the method; sensitivity of the method; promoters and enhancers related analyses; pathway enrichment analysis; and t-Stochastic Neighbor Embedding.
Software availability
All codes used in this study are available at GitHub (https://github.com/HidetakaOhnuki-NCI/REpi-seq) and as Supplemental Codes 1–10.
Data access
The sequencing read data generated in this study (Supplemental Table S5) have been submitted to the NCBI BioProject database (https://www.ncbi.nlm.nih.gov/bioproject/) under accession number PRJNA669138.
Competing interest statement
H.O. and G.T. are coinventors on a patent application titled “Methods for preparing a reusable single cell and methods for analyzing the epigenome, transcriptome and genome of a single cell” (International PCT Application Number PCT/US2018/031201 filed May 4, 2018). The patent application was filed in part based on preliminary results related to the technology described in the current manuscript. The invention or inventions described and claimed in this patent application were made while the inventors were full-time employees of the U.S. government. Therefore, under 45 Code of Federal Regulations Part 7, all rights, title, and interest to this patent application have been or should by law be assigned to the U.S. government. The U.S. government conveys a portion of the royalties it receives to its employee inventors under 15 U.S. Code § 3710c.
Acknowledgments
We thank Drs. David Sanchez-Martin and Christopher B. Buck for comments during the conceptualization stage of the project. We also thank the Genomics Core, Center for Cancer Research (CCR), National Cancer Institute (NCI), National Institutes of Health (NIH) for help in preliminary experiments, and the Collaborative Bioinformatics Resource, CCR, NCI, NIH for advice in computational analysis. We thank Ms. Anna Word for helping with the optimization of DNA polymerases used in the method. This work used the computational resources of the NIH High Performance Computing (HPC) Biowulf cluster (http://hpc.nih.gov). This project is supported by the Intramural Program of the Center for Cancer Research, National Cancer Institute, National Institutes of Health, the NCI Director's Innovation Award (397172) and Federal funds from the National Cancer Institute under Contract No. HHSN261200800001E, and also by the NCI Supplemental Technology Award Review System (STARS), no. 635. We thank Drs. Tom Misteli, Carol Thiele, Douglas R. Lowy, and all members of the Laboratory of Cellular Oncology for productive comments. We also thank Drs. Christopher B. Buck, Robert Yarchoan, and Douglas R. Lowy for reviewing the manuscript.
Author contributions: Conceptualization, H.O.; methodology, H.O.; codes, H.O. and A.L.; validation, H.O. and G.T.; formal analysis, H.O. and D.J.V.; investigation, H.O.; data curation, H.O. and A.L.; writing—original draft, H.O.; writing—review and editing, H.O., D.J.V., A.L., and G.T.; supervision, H.O. and G.T.; project administration, H.O. and G.T.; funding acquisition, H.O. and G.T.
Footnotes
-
[Supplemental material is available for this article.]
-
Article published online before print. Article, supplemental material, and publication date are at https://www.genome.org/cgi/doi/10.1101/gr.269068.120.
- Received July 20, 2020.
- Accepted January 14, 2021.
This is a work of the US Government.


